Abstract
Export of proteins into the infected erythrocyte is critical for malaria parasite survival. The majority of effector proteins are thought to export via a proteinaceous translocon, resident in the parasitophorous vacuole membrane surrounding the parasite. Identification of the Plasmodium translocon of exported proteins and its biochemical association with exported proteins suggests it performs this role. Direct evidence for this, however, is lacking. Here using viable purified Plasmodium falciparum merozoites and three-dimensional structured illumination microscopy, we investigate remodelling events immediately following parasite invasion. We show that multiple complexes of the Plasmodium translocon of exported proteins localize together in foci that dynamically change in clustering behaviour. Furthermore, we provide conclusive evidence of spatial association between exported proteins and exported protein 2, a core component of the Plasmodium translocon of exported proteins, during native conditions and upon generation of translocation intermediates. These data provide the most direct cellular evidence to date that protein export occurs at regions of the parasitophorous vacuole membrane housing the Plasmodium translocon of exported proteins complex.
🔬 Techniques
🧬 Organisms
💻 Software
✨ Fluorophores
🧪 Sample Preparation
🏭 Microscope Brands
🧪 Reagent Suppliers
📷 Detectors
🔎 Objectives
💻 Software Details
🏛️ Research Organizations (ROR)
Affiliated research institutions:
📋 Methods
Ethics statement
The culture of P. falciparum parasites using donated blood and serum from the Australian Red Cross Society has been approved by The Walter and Eliza Hall Institute Human Ethics Committee (HEC 86/17). Parasite culture and sample preparation Various P. falciparum lines derived from 3D7 and D10 were maintained as asexual stages in erythrocytes (Blood Group O) under standard culture conditions: D10-PfM3′ (ref. 46, ), 3D7+PTEX-150HA and 3D7+HSP101HA for imaging of PTEX 16 , 3D7+GBP130-mDHFR-GFP for export inhibition experiments 15 . To ensure synchronization of parasites, viable filtered merozoites were prepared as described previously 25 . Briefly, late schizont parasites (>40 h), synchronized using either sorbitol or heparin 25 , were purified by magnet (MACS Miltenyi Biotech) and returned to culture in the presence of 10 μ M E-64 protease inhibitor (Sigma). After incubation for 6–8 h, E-64-treated schizonts were pelleted at 1,900 g for 5 min. Parasites were resuspended in culture medium without Albumax II for time points 30 min. Following filtration through a 32 mm, 1.2 μm syringe filter (Sartorius Stedim Biotech) merozoites were mixed with washed erythrocytes and allowed to invade, with shaking, at 37 °C. Between 30 and 60 min post invasion (for time points >30–60 min) newly infected cultures were resuspended in fresh culture media and returned to standard culture conditions.
Immunofluorescence assays
Sample fixation and IFA were undertaken in solution as described previously 31 47 . Fixation was in 4% paraformaldehyde with 0.0075% glutaraldehyde in PBS for 30 min at room temperature. Following 10 min permeabilisation using 0.1% Triton-X 100, samples were blocked in 3% bovine serum albumin in PBS at 4 °C overnight. Primary antibodies were used at the following dilutions in blocking solution for 1 h: rabbit anti-EXP2 1:100–1:500 ( 17 ), mouse anti-EXP2 1:500 (ref. 48 ), mouse anti-RAP1 1:500 (ref. 27 ), rabbit anti-MSP1-19 1:200 (ref. 26 ), mouse anti-RON4 1:500 (ref. 49 ), rabbit anti-RON4 (ref. 50 ), mouse anti-RESA 1:100 (ref. 35 ), mouse anti-GFP 1:200 (Roche) and rat anti-HA 1:100 (Roche, Clone 3F10). Following three washes of PBS, AlexaFluor 488 or 594 goat anti-rabbit, rat or mouse (Invitrogen) secondary antibodies were diluted at 1:500 in blocking solution. Following three further washes with PBS, samples were settled onto polyethyleneimine-coated coverslips and mounted in VectaShield (Vector Laboratories) with 0.1 ng μl −1 4′,6–diamidino-2-phenylindole (Invitrogen). Widefield deconvolution and three-dimensional structured illumination (3D-SIM) microscopy For widefield and 3D-SIM microscopy, samples were prepared by IFA as above. Widefield images were captured with mercury illumination on an AxioVert 200M inverted microscope (Zeiss), equipped with a Plan-Apochromat 100 × /1.40 NA Ph3 oil-immersion objective lens (Zeiss), high-efficiency filter sets (Zeiss; in nm: Ex 365-Em 445/50, Ex 470/40-Em 525/50 and Ex 587/25-Em 647/70) and a 1,388 × 1,040 pixel AxioCam Mrm camera (Zeiss) driven by Axiovision release 4.8.2 software (Zeiss). Z-stacks were taken well above and below parasites using a 200 nm Z-step size. Deconvolution (fast iterative setting) and channel shift correction, as measured using commercially available test slides, were performed with an offline 64-bit version of Axiovision release 4.8.1.0 software (Zeiss). 3D-SIM images were captured on a V3 DeltaVision OMX 3D-SIM imaging system (OMX V3) or a DeltaVision OMX 3D-SIM imaging system with a Blaze SIM module (OMX Blaze) (Applied Precision Inc). Solid-state lasers (405, 488, 593 nm) provided wide-field illumination and multi-channel images were captured simultaneously using three cameras (OMX V3, Photometrics Cascade (Photometrics) back-illuminated EMCCD cameras (>90% QE) with a 512 × 512 pixel CCD (charge-coupled device), and on-chip charge multiplication; OMX Blaze, pco.edge scientific CMOS cameras (PCO AG), 512 × 512 pixel with 15-bit dynamic range). Data was captured using either a 100 × (OMX V3) or 60 × (OMX Blaze) 1.4 NA UPlanSApo oil objective (Olympus Corp) and standard excitation and emission filter sets (in nm, 405 EX/ 419–465 EM, 488 EX/500–550 EM and 592.5 EX/608–648 EM). Interference patterns for 3D-SIM were generated either by a physical grid in OMX V3 (refs 51,52 51,52 ) or by interfering light beams in OMX Blaze 53 . 3D-SIM images were sectioned using a 125 nm Z-step size. Raw 3-phase images were reconstructed as previously described 51 52 . General Image Processing Reconstructed 3D-SIM images were rendered in 3D, with interpolation, using IMARIS version 7.2.2–7.6.0 (Bitplane Scientific), with correction for channel-dependent pixel shifts. Full imaging data sets are available on request. For clarity of display, gamma settings were altered on some 3D data sets; however, no comparisons of labelling levels were made from such altered images. General image handling was undertaken using ImageJ ( http://rsb.info.nih.gov/ij/ ) and Photoshop CS5 (Adobe) software before being compiled using Illustrator CS5 (Adobe).
Show full methods section
Ethics statement
The culture of P. falciparum parasites using donated blood and serum from the Australian Red Cross Society has been approved by The Walter and Eliza Hall Institute Human Ethics Committee (HEC 86/17). Parasite culture and sample preparation Various P. falciparum lines derived from 3D7 and D10 were maintained as asexual stages in erythrocytes (Blood Group O) under standard culture conditions: D10-PfM3′ (ref. 46, ), 3D7+PTEX-150HA and 3D7+HSP101HA for imaging of PTEX 16 , 3D7+GBP130-mDHFR-GFP for export inhibition experiments 15 . To ensure synchronization of parasites, viable filtered merozoites were prepared as described previously 25 . Briefly, late schizont parasites (>40 h), synchronized using either sorbitol or heparin 25 , were purified by magnet (MACS Miltenyi Biotech) and returned to culture in the presence of 10 μ M E-64 protease inhibitor (Sigma). After incubation for 6–8 h, E-64-treated schizonts were pelleted at 1,900 g for 5 min. Parasites were resuspended in culture medium without Albumax II for time points 30 min. Following filtration through a 32 mm, 1.2 μm syringe filter (Sartorius Stedim Biotech) merozoites were mixed with washed erythrocytes and allowed to invade, with shaking, at 37 °C. Between 30 and 60 min post invasion (for time points >30–60 min) newly infected cultures were resuspended in fresh culture media and returned to standard culture conditions.
Immunofluorescence assays
Sample fixation and IFA were undertaken in solution as described previously 31 47 . Fixation was in 4% paraformaldehyde with 0.0075% glutaraldehyde in PBS for 30 min at room temperature. Following 10 min permeabilisation using 0.1% Triton-X 100, samples were blocked in 3% bovine serum albumin in PBS at 4 °C overnight. Primary antibodies were used at the following dilutions in blocking solution for 1 h: rabbit anti-EXP2 1:100–1:500 ( 17 ), mouse anti-EXP2 1:500 (ref. 48 ), mouse anti-RAP1 1:500 (ref. 27 ), rabbit anti-MSP1-19 1:200 (ref. 26 ), mouse anti-RON4 1:500 (ref. 49 ), rabbit anti-RON4 (ref. 50 ), mouse anti-RESA 1:100 (ref. 35 ), mouse anti-GFP 1:200 (Roche) and rat anti-HA 1:100 (Roche, Clone 3F10). Following three washes of PBS, AlexaFluor 488 or 594 goat anti-rabbit, rat or mouse (Invitrogen) secondary antibodies were diluted at 1:500 in blocking solution. Following three further washes with PBS, samples were settled onto polyethyleneimine-coated coverslips and mounted in VectaShield (Vector Laboratories) with 0.1 ng μl −1 4′,6–diamidino-2-phenylindole (Invitrogen). Widefield deconvolution and three-dimensional structured illumination (3D-SIM) microscopy For widefield and 3D-SIM microscopy, samples were prepared by IFA as above. Widefield images were captured with mercury illumination on an AxioVert 200M inverted microscope (Zeiss), equipped with a Plan-Apochromat 100 × /1.40 NA Ph3 oil-immersion objective lens (Zeiss), high-efficiency filter sets (Zeiss; in nm: Ex 365-Em 445/50, Ex 470/40-Em 525/50 and Ex 587/25-Em 647/70) and a 1,388 × 1,040 pixel AxioCam Mrm camera (Zeiss) driven by Axiovision release 4.8.2 software (Zeiss). Z-stacks were taken well above and below parasites using a 200 nm Z-step size. Deconvolution (fast iterative setting) and channel shift correction, as measured using commercially available test slides, were performed with an offline 64-bit version of Axiovision release 4.8.1.0 software (Zeiss). 3D-SIM images were captured on a V3 DeltaVision OMX 3D-SIM imaging system (OMX V3) or a DeltaVision OMX 3D-SIM imaging system with a Blaze SIM module (OMX Blaze) (Applied Precision Inc). Solid-state lasers (405, 488, 593 nm) provided wide-field illumination and multi-channel images were captured simultaneously using three cameras (OMX V3, Photometrics Cascade (Photometrics) back-illuminated EMCCD cameras (>90% QE) with a 512 × 512 pixel CCD (charge-coupled device), and on-chip charge multiplication; OMX Blaze, pco.edge scientific CMOS cameras (PCO AG), 512 × 512 pixel with 15-bit dynamic range). Data was captured using either a 100 × (OMX V3) or 60 × (OMX Blaze) 1.4 NA UPlanSApo oil objective (Olympus Corp) and standard excitation and emission filter sets (in nm, 405 EX/ 419–465 EM, 488 EX/500–550 EM and 592.5 EX/608–648 EM). Interference patterns for 3D-SIM were generated either by a physical grid in OMX V3 (refs 51,52 51,52 ) or by interfering light beams in OMX Blaze 53 . 3D-SIM images were sectioned using a 125 nm Z-step size. Raw 3-phase images were reconstructed as previously described 51 52 . General Image Processing Reconstructed 3D-SIM images were rendered in 3D, with interpolation, using IMARIS version 7.2.2–7.6.0 (Bitplane Scientific), with correction for channel-dependent pixel shifts. Full imaging data sets are available on request. For clarity of display, gamma settings were altered on some 3D data sets; however, no comparisons of labelling levels were made from such altered images. General image handling was undertaken using ImageJ ( http://rsb.info.nih.gov/ij/ ) and Photoshop CS5 (Adobe) software before being compiled using Illustrator CS5 (Adobe).
Image Analysis
Analyses were undertaken on 3D-SIM data sets in 3D using IMARIS versions 7.2.2–7.6.0 (Bitplane Scientific). Statistical presentation and analyses were performed using Prism version 5.0a (Graph Pad Software). For colocalization studies, IMARIS ‘Colocalization Module’ was used. To avoid subjectivity all thresholds were automatically determined using algorithms based on those of Costes 54 . To create a stringent threshold, the automated algorithm was run only on values above an initial input pixel intensity value of 1,000 in the non-EXP2 channel, determined after consideration of representative images from each data set. The % colocalization (‘Intensity Weighted Overlap’ statistic) was calculated as the percentage of summed pixel intensities in the non-EXP2 channel that coincide with above threshold EXP2 values. A Kruskal–Wallis test, with Dunn's multiple comparison post test, was used to analyse the difference of medians between all data sets depicted in Fig. 2d . As required, all data sets showed similar variance by Levene’s test 55 . As a precaution, a non-parametric test was used because some samples did not pass the D’Agostino and Pearson omnibus normality test. Similar analysis was performed for data presented in Fig. 4c ; however, GBP130-DHFR-GFP data was excluded from analysis due to its non-similar distribution, again measured using Levene’s test. EXP2 volume analyses were performed using parasites labelled for RAP1 and EXP2. Using IMARIS ‘Surface tool’, ‘Pre-segmentation’ EXP2-labelled regions were isolated using automated thresholding based on a published algorithm 56 (0.0395 μm smoothing, Background subtraction 0.29625 μm, automatic threshold). Objects with
📊 Figures
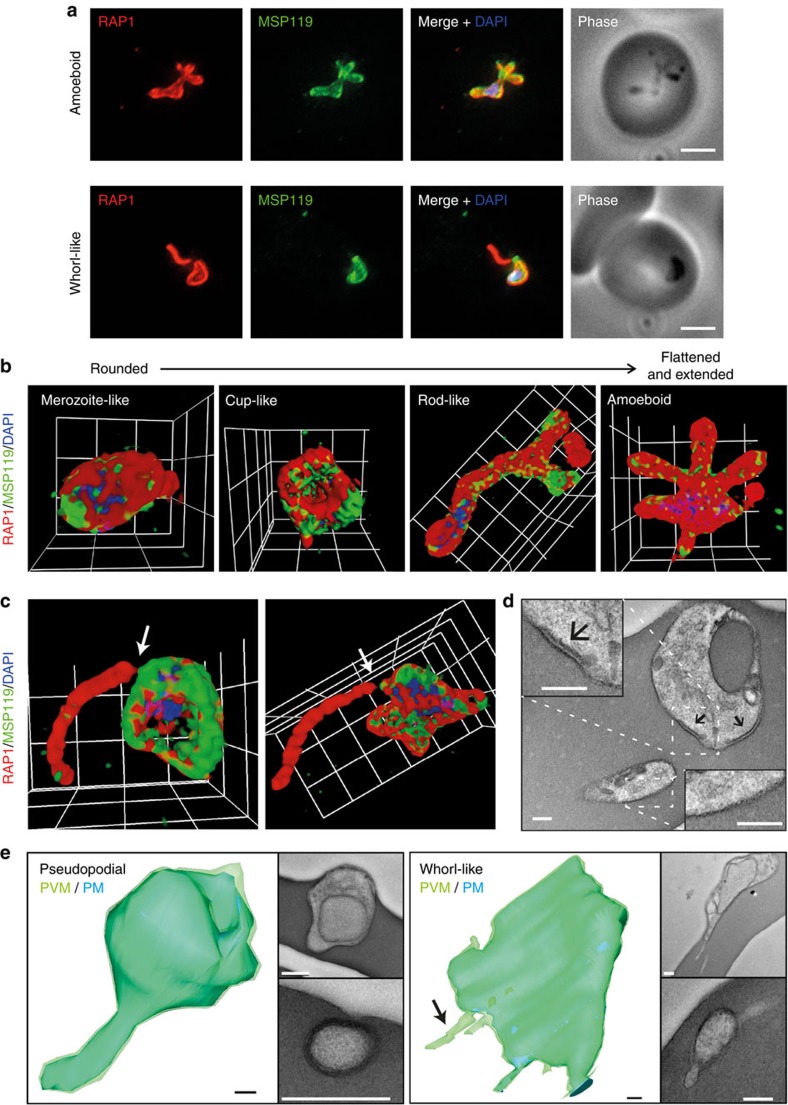
Figure 1
P. falciparum merozoite morphology changes post erythrocyte invasion.
Parasites were fixed <12u2009min following merozoite invasion and labelled by IFA using standard markers for the PV (RAP1, red), parasite plasma membrane (MSP1-19, green) and nucleus (4u2032,6u2013...
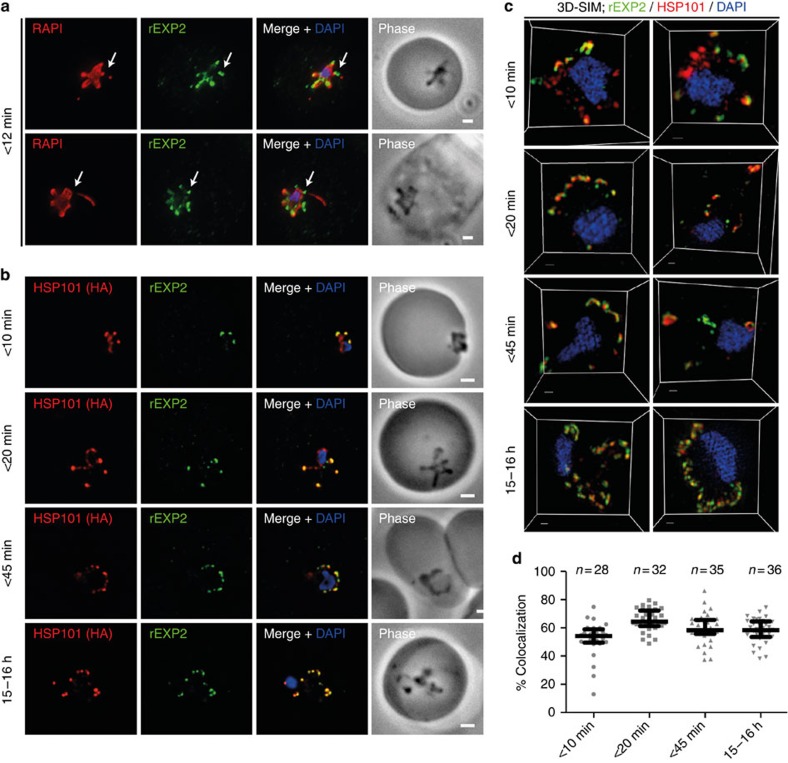
Figure 2
PTEX components localize to the parasite periphery immediately following invasion.
( a ) Widefield deconvolution imaging of parasites fixed <12u2009min following erythrocyte invasion and labelled by IFA for EXP2 (green), the PV (RAP1, red) and the nucleus (4u2032,6u2013diamidino-...
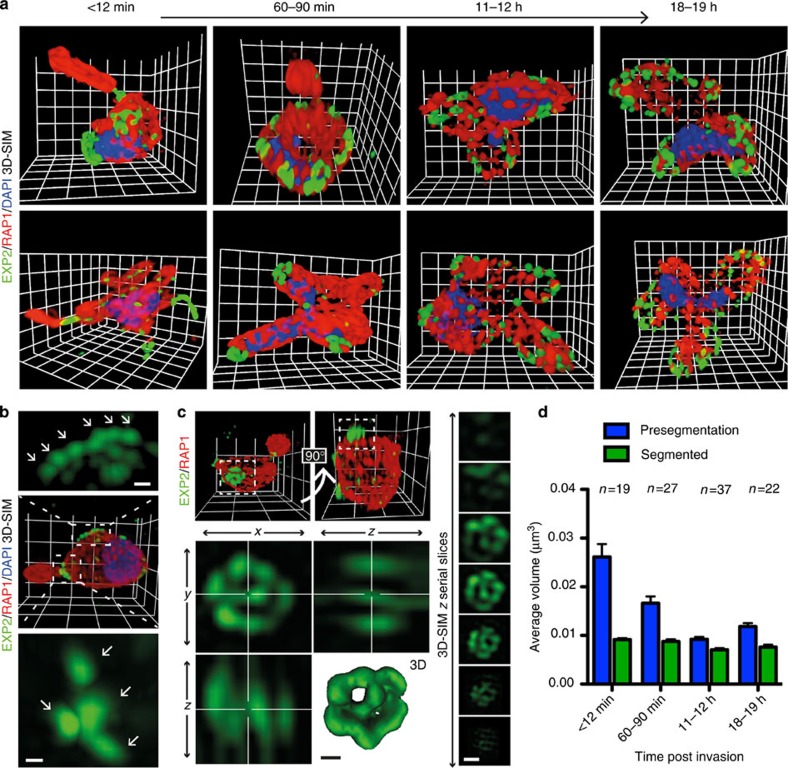
Figure 3
EXP2 exhibits clustering dynamics across the ring-stage lifecycle.
A time course of parasites fixed <12u2009min, 60u201390u2009min, 11u201312u2009h and 18u201319u2009h after invasion was labelled by IFA for EXP2 (green), the PV (RAP1, red) and the nucleus (4u2032,...
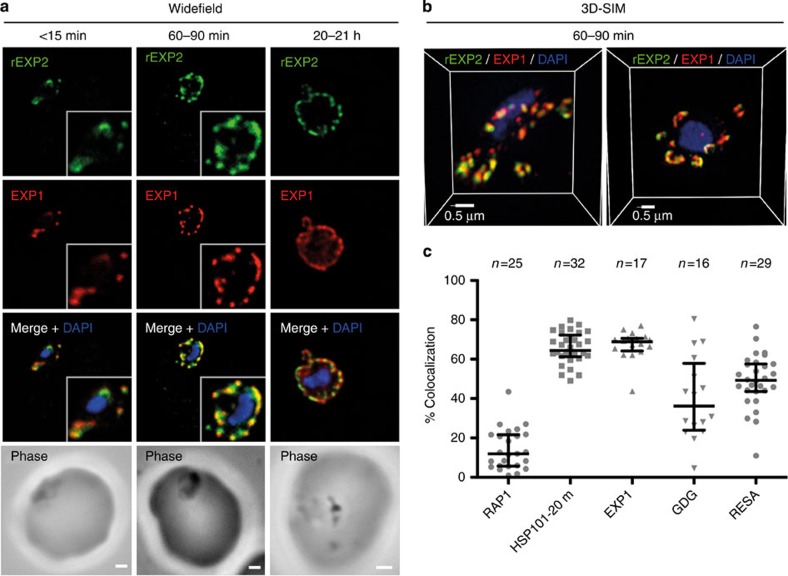
Figure 4
EXP1 localizes to PVM domains with PTEX.
Parasites were fixed at <15u2009min, 60u201390u2009min and 20u201321u2009h after invasion and labelled by IFA for EXP1 (red), EXP2 (green) and the nucleus (4u2032,6u2013diamidino-2-phenylindole (DA...
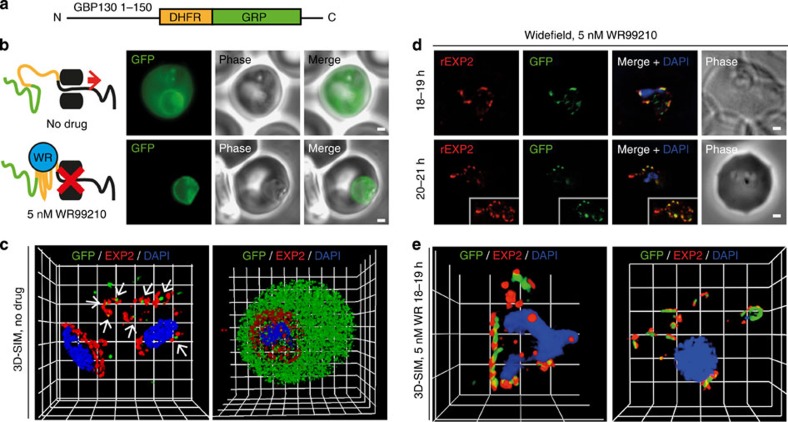
Figure 5
Prevention of GBP130-DHFR-GFP protein unfolding causes association with EXP2.
( a ) The GBP130-DHFR-GFP construct involves a 150 amino-acid leader sequence from the PEXEL containing protein GBP130, fused to mDHFR and GFP. ( b ) Imaging of live parasites by widefield microscopy ...
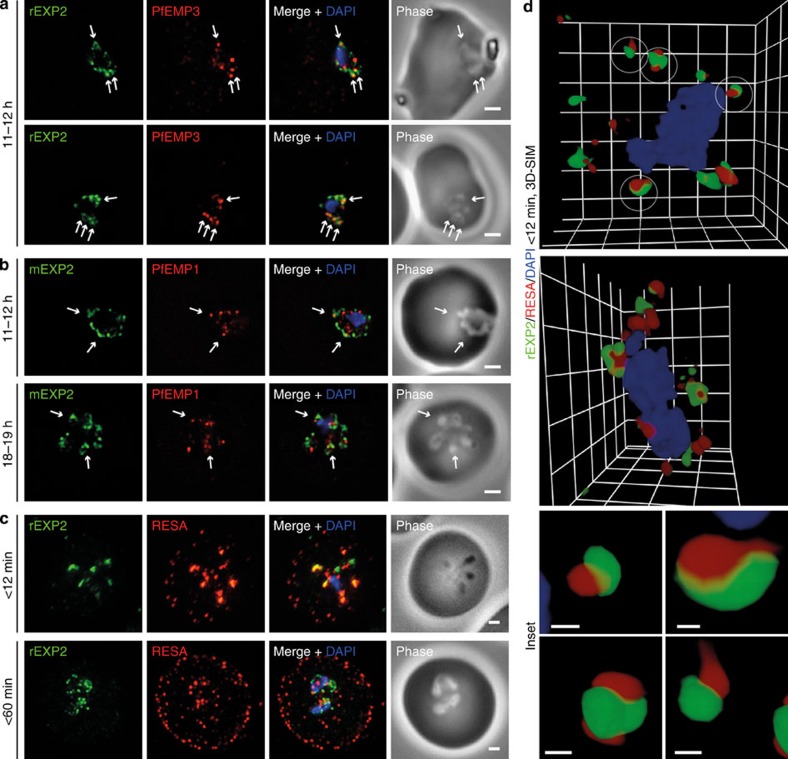
Figure 6
Protein accumulates at sites marked by PTEX during native PEXEL-dependent protein export.
Widefield deconvolution microscopy of parasites fixed and labelled by IFA for EXP2 (green), the nucleus (4u2032,6u2013diamidino-2-phenylindole (DAPI), blue) and ( a ) PfEMP3 (red), a protein exported ...
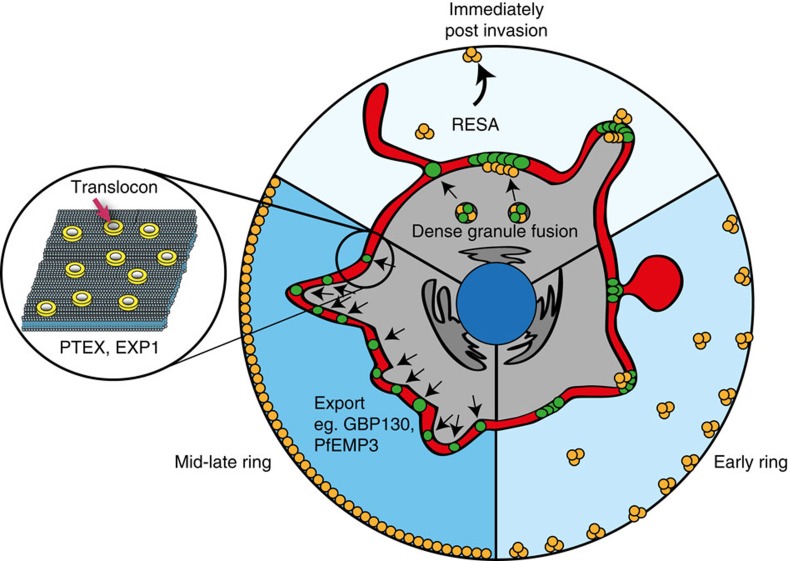
Figure 7
Model of export from the ring-stage malaria parasite.
Immediately following invasion, dense granule fusion causes local membrane extension and deposits export-associated regions as clusters of foci at the parasite periphery. Each focus contains multiple ...
Figure images are served from the NIH/NLM PubMed Central Open Access Subset or Europe PMC; copyright remains with the publishers and authors.
💬 Discussion
0 commentsNo comments yet. Be the first to start a discussion!
Leave a Comment