Abstract
Abstract Voltage-gated sodium (Na V ) channels initiate action potentials in excitable cells, and their function is altered by potent gating-modifier toxins. The α-toxin LqhIII from the deathstalker scorpion inhibits fast inactivation of cardiac Na V 1.5 channels with IC 50 = 11.4 nM. Here we reveal the structure of LqhIII bound to Na V 1.5 at 3.3 Å resolution by cryo-EM. LqhIII anchors on top of voltage-sensing domain IV, wedged between the S1-S2 and S3-S4 linkers, which traps the gating charges of the S4 segment in a unique intermediate-activated state stabilized by four ion-pairs. This conformational change is propagated inward to weaken binding of the fast inactivation gate and favor opening the activation gate. However, these changes do not permit Na + permeation, revealing why LqhIII slows inactivation of Na V channels but does not open them. Our results provide important insights into the structural basis for gating-modifier toxin binding, voltage-sensor trapping, and fast inactivation of Na V channels.
🔬 Techniques
💻 Software
✨ Fluorophores
🧪 Sample Preparation
🔬 Cell Lines
🏭 Microscope Brands
🧪 Reagent Suppliers
📷 Detectors
💻 Software Details
💾 Data Repositories
🏛️ Research Organizations (ROR)
Affiliated research institutions:
📋 Methods
Electrophysiology
All experiments were performed at room temperature (21–24 °C) as described previously 21 . Human HEK293S GnTI – cells (American Type Culture Collection Cat# CRL-3022) were maintained and infected on cell culture plates in Dulbecco’s Modified Eagle Medium (DMEM) supplemented with 10% fetal bovine serum and glutamine/penicillin/streptomycin at 37 °C and 5% CO 2 for electrophysiology. Unless otherwise mentioned, HEK293S GnTI – cells were held at -120 mV and 100-ms pulses were applied in 10 mV increments from −120 mV to +60 mV. A P/-4 holding leak potential was set to −120 mV. Extracellular solution contained in mM: 140 NaCl, 2 CaCl 2 , 2 MgCl 2 , 10 HEPES, pH 7.4. Intracellular solution contained: 35 NaCl, 105 CsF, 10 EGTA, 10 HEPES, pH 7.4. Glass electrodes had a resistance of 1.5–3 MΩ. Currents resulting from applied pulses were filtered at 5 kHz with a low-pass Bessel filter and then digitized at 20 kHz. Data were acquired using an Axopatch 200B amplifier (Molecular Devices). Voltage commands were generated using Pulse 8.5 software (HEKA, Germany) and ITC18 analog-to-digital interface (Instrutech, Port Washington, NY).
Protein expression and purification
Detailed expression and purification of rat rNa V 1.5 C were described in our previous study 21 . Briefly, rNa V 1.5 C was expressed in HEK293S GnTI- cells (ATCC). The protein was extracted by 1% (w/v) n-dodecyl-β- d -maltopyranoside (DDM, Anatrace) and 0.2% (w/v) cholesteryl hemisuccinate Tris salt (CHS, Anatrace) in Buffer A containing 25 mM HEPES pH = 7.4, 150 mM NaCl and 10% glycerol. After centrifugation, the supernatant was agitated with anti-Flag M2-agarose resin (Sigma). Flag resin was washed in Buffer A supplemented with 0.06% glycol-diosgenin (GDN, Anatrace). Purified protein was then loaded onto a Superose-6 column (GE Healthcare) in 20 mM HEPES pH = 7.4, 150 mM NaCl and 0.06% GDN, peak fractions were concentrated to ~1 mg/ml and mixed with 50 μM LqhIII (Latoxan Laboratory) and purified FGF12b and calmodulin overnight. The mixture was then re-loaded to Superose-6 column pre-equilibrated with buffer containing 25 mM imidazole pH = 6.0, 150 mM NaCl and 0.006% GDN. Finally, peak fractions were concentrated to 40 μl at 5 mg/ml.
Show full methods section
Electrophysiology
All experiments were performed at room temperature (21–24 °C) as described previously 21 . Human HEK293S GnTI – cells (American Type Culture Collection Cat# CRL-3022) were maintained and infected on cell culture plates in Dulbecco’s Modified Eagle Medium (DMEM) supplemented with 10% fetal bovine serum and glutamine/penicillin/streptomycin at 37 °C and 5% CO 2 for electrophysiology. Unless otherwise mentioned, HEK293S GnTI – cells were held at -120 mV and 100-ms pulses were applied in 10 mV increments from −120 mV to +60 mV. A P/-4 holding leak potential was set to −120 mV. Extracellular solution contained in mM: 140 NaCl, 2 CaCl 2 , 2 MgCl 2 , 10 HEPES, pH 7.4. Intracellular solution contained: 35 NaCl, 105 CsF, 10 EGTA, 10 HEPES, pH 7.4. Glass electrodes had a resistance of 1.5–3 MΩ. Currents resulting from applied pulses were filtered at 5 kHz with a low-pass Bessel filter and then digitized at 20 kHz. Data were acquired using an Axopatch 200B amplifier (Molecular Devices). Voltage commands were generated using Pulse 8.5 software (HEKA, Germany) and ITC18 analog-to-digital interface (Instrutech, Port Washington, NY).
Protein expression and purification
Detailed expression and purification of rat rNa V 1.5 C were described in our previous study 21 . Briefly, rNa V 1.5 C was expressed in HEK293S GnTI- cells (ATCC). The protein was extracted by 1% (w/v) n-dodecyl-β- d -maltopyranoside (DDM, Anatrace) and 0.2% (w/v) cholesteryl hemisuccinate Tris salt (CHS, Anatrace) in Buffer A containing 25 mM HEPES pH = 7.4, 150 mM NaCl and 10% glycerol. After centrifugation, the supernatant was agitated with anti-Flag M2-agarose resin (Sigma). Flag resin was washed in Buffer A supplemented with 0.06% glycol-diosgenin (GDN, Anatrace). Purified protein was then loaded onto a Superose-6 column (GE Healthcare) in 20 mM HEPES pH = 7.4, 150 mM NaCl and 0.06% GDN, peak fractions were concentrated to ~1 mg/ml and mixed with 50 μM LqhIII (Latoxan Laboratory) and purified FGF12b and calmodulin overnight. The mixture was then re-loaded to Superose-6 column pre-equilibrated with buffer containing 25 mM imidazole pH = 6.0, 150 mM NaCl and 0.006% GDN. Finally, peak fractions were concentrated to 40 μl at 5 mg/ml.
CryoEM grid preparation and data collection
Three microliters of purified sample were applied to glow-discharged holey gold grids (UltraAuFoil, 300 mesh, R1.2/1.3), and blotted for 2.0–3.5 s at 100% humidity and 4 °C before being plunged frozen in liquid ethane cooled by liquid nitrogen using an FEI Mark IV Vitrobot. All data were acquired using a Titan Krios transmission electron microscope operated at 300 kV, a Gatan K2 Summit direct detector, and Gatan Quantum GIF energy filter with a slit width of 20 eV. A total of 4222 movie stacks were automatically collected using Leginon 49 at a nominal magnification of 130,000× with a pixel size of 0.528 Å (super-resolution mode). Defocus range was set between −1.2 and −2.8 μm. The dose rate was adjusted to 8 counts/pixel/s, and each stack was exposed for 8.4 s with 42 frames with a total dose of 60 e − / Å 2 .
Cryo-EM data processing
The movie stacks were motion-corrected with MotionCorr2 50 , binned 2-fold, and dose-weighted, yielding a pixel size of 1.056 Å. Defocus values of each aligned sum were estimated with Gctf 51 – 53 . A total of 3805 micrographs with CTF fitted better than 6 Å were used for particle picking, and a total of 1,817,940 particles were automatically picked in RELION3.0 51 . After several rounds of 2D classification, 882,608 good particles were selected and subjected to one class global angular search 3D classification with an angular search step at 7.5°, at which a low-pass filtered cryo-EM map of rNa V 1.5 C was used as an initial model. Each of the last five iterations was further subjected to four classes of local angular search and 3D classification with an angular search step at 3.75°. After combining particles from the best 3D classes and removing duplicate particles, 570,843 particles were subjected to per-particle CTF estimation by GCTF followed by Bayesian polishing. The polished particles were subjected to last round three-class multi-reference 3D classification. The best class containing 267,595 particles was auto-refined and sharpened in Relion3.0. Local resolution was estimated by ResMap in Relion3.0. A diagram illustrating our data processing is presented in Supplementary Fig. 2 .
Model building and refinement
The structures of rat rNa V 1.5 C (PDB code: 6UZ0) and LqhIII (PDB code: 1FH3) were fitted into the cryo-EM density map in Chimera 52 . The model was manually rebuilt in COOT 54 and subsequently refined in Phenix 55 . The model vs. map FSC curve was calculated by Phenix.mtrage. Statistics for cryo-EM data collection and model refinement are summarized in Supplementary Table 1 .
Molecular dynamics model
The cryo-EM structure of rNa V 1.5 C /LqhIII lacking D I– D II and D II– D III linkers is composed of three chains which correspond to D I– D IV. The MODELLER software (ver. 9.22) was used to insert missing residues and sidechains within the polypeptide chains, followed by quick refinement using MD with simulated annealing 56 . Neutral N- and C-termini were used for the three polypeptide chains in our refined model of rNa V 1.5 C . N-termini from chains D II and D III–IV were acetylated, and a neutral amino terminus (-NH 2 ) was used for D I. Neutral carboxyl groups (–COOH) were used for all C-termini. Disulfide bonds linking residues 327–342, 909–918, and 1730–1744 were included in our model of the channel as they were present in the cryo-EM structure; however, no glycans were added to the protein. Charged N- and C-termini were used for LqhIII and disulfide bonds linking residues 12–65, 16–37, 23–47, and 27–49 were included.
Molecular dynamics simulations
Molecular models of rNa V 1.5 C /LqhIII with and without the toxin were prepared using the input generator, Membrane Builder from CHARMM-GUI 57 – 61 , from CHARMM-GUI (Jo et al., 2009). The rNa V 1.5 C /LqhIII model was embedded in a hydrated DMPC bilayer, with approximately 150 mM NaCl. The protein was translated and rotated for membrane embedding using the PPM server 62 . The lipid bilayer was assembled using the replacement method, and solvent ions were added at random positions using a distance-based algorithm. A periodic rectangular cell with approximate dimensions of 14 × 14 × 13 nm was used, which comprised ~240,000 atoms. The CHARMM36 all-atom force field 63 – 65 was used in conjunction with the TIP3P water model 66 . Non-bonded fixes for backbone carbonyl oxygen atoms with Na + 67 , and lipid head groups with Na + 68 were imposed. Electrostatic interactions were calculated using the particle-mesh Ewald algorithm 69 , 70 and chemical bonds were constrained using the LINCS algorithm 71 . The energy of the system was minimized with protein position restraints on the backbone (4000 kJ/mol/nm 2 ) and side chains (2000 kJ/mol/nm 2 ), as well as lipid position and dihedral restraints (1000 kJ/mol/nm 2 ) using 5000 steps of steepest descent. The simulation systems were pre-equilibrated using multistep isothermal–isovolumetric (NVT) and isothermal–isobaric (NPT) conditions for a total of 10.35 ns (see Table “MDS1 for parameters”). Unrestrained “production” simulations of approximately 300 ns were then generated with a 2 fs time integration step. The first 100 ns of all production simulations were considered part of equilibration based on RMSD analyses of Cα atoms (Supplementary Fig. 6 ) and were excluded from subsequent data analysis. Thirty independent replicas (10 of them 400 ns-long and 20 of them 300 ns long) were generated for each system using random starting velocities, yielding a total simulation time of approximately 10.3 µs per system, of which 7.3 µs were used for analysis. The simulations were carried out using GROMACS version 2019.3 ( http://www.gromacs.org ).
Molecular dynamics simulation analysis
In each snapshot of our simulations, atomic positions were translated and rotated by aligning the Cα atoms from pore transmembrane helices (S5 and S6 from all domains) of rNa V 1.5 C to the initial structure produced by CHARMM-GUI. The positions of all atoms were then centered in the xy-plane by the center of mass (CoM) of pore transmembrane helices and the z -axis by the CoM of Cα atoms from the DEKA motif in the SF. After performing the spatial transformations, the z -axis of the simulation box was used as the pore axis of Na V 1.5 and the transformed positions were used for subsequent analyses. The axial distribution of water was computed by counting the number of water O-atoms within a cylindrical radius 8.5 Å centered on the pore axis. The probability distribution of water was calculated for each replica by counting the number of water molecules in uniform cylindrical slices along the pore-axis and normalizing the counts by the slice with the highest number of water molecules (solvent slice). The average and SEM of the probability distribution was computed across replicas. Pore hydration analysis indicated a dehydrated region located at the ICAG (−2.8 nm < z < −1.5 nm). The number of water molecules in the gate was counted for each frame and normalized by the total number of frames to obtain the probability distribution. The average and s.e.m. were computed across replicas. To measure the size of the intracellular activation gate, residues at the ends of the S6 helices were selected by using a similar residue selection as Lenaeus et al. in their study of open- and closed-state Na V Ab structures 72 . Because rNa V 1.5 C has 94% sequence similarity with hNa V 1.5 (gap open penalty of 12, gap extension penalty of 4), a previously published multiple sequence alignment of Na V Ab to hNa V 1.5 S6 helices by 73 was used to determine the equivalent residues in rNa V 1.5. As a result, the following residue number selections were used in rNa V 1.5: DI: 410–413, DII: 939–942, DIII: 1469–1472, and DIV: 1771–1774. The CoM of Cα-atoms from each selection was projected onto the xy-plane and the distances between opposing S6 tails were measured ( d 1 : DI–DIII and d 2 : DII–DIV). Analyses were performed using MDTraj 74 and molecular visualizations were rendered using Visual Molecular Dynamics 75 . Reporting summary Further information on research design is available in the Nature Research Reporting Summary linked to this article.
Supplementary information Supplementary Information Reporting Summary
📊 Figures
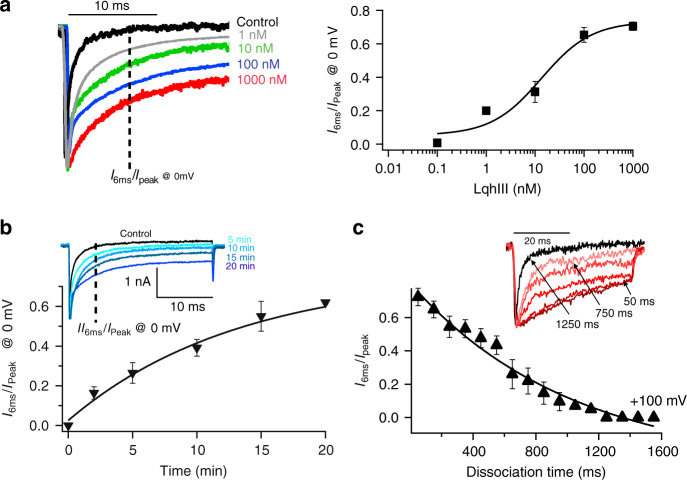
Fig. 1
Block of fast inactivation of rNa V 1.5 C by LqhIII.
a Left . Normalized current traces from HEK293 cells expressing rNa v 1.5c in the absence (black) or in the presence of 1u2009nM (grey), 10u2009nM (green), 100u2009nM (blue), or 1000u2009nM (red) LqhI...
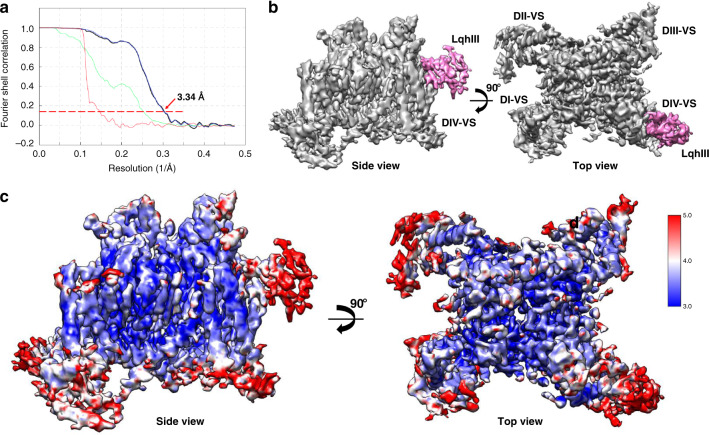
Fig. 2
Cryo-EM structure of the rNaV1.5 C /LqhIII complex.
a The FSC between independently refined half-maps for rNa v 1.5 C /LqhIII reconstruction. b Overall cryo-EM reconstruction (side view, left; top view, right) of the rNa V 1.5 C /LqhIII complex. Na V 1...
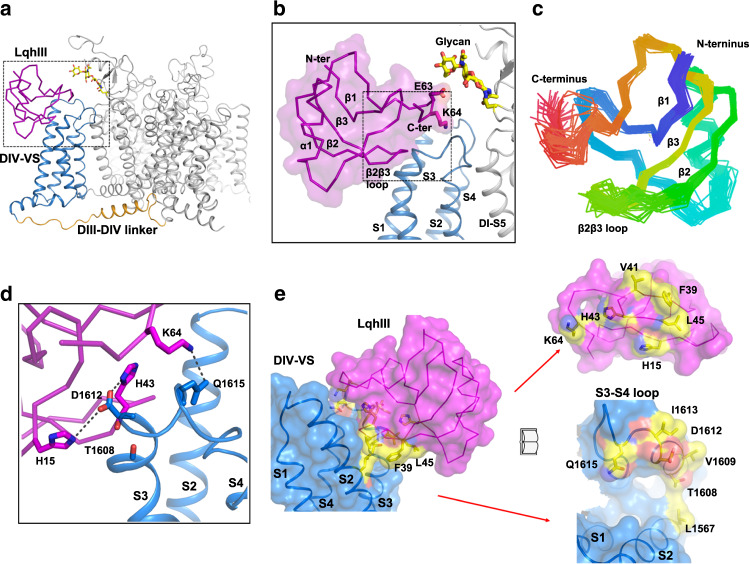
Fig. 3
Overall structure of rNa V 1.5 C /LqhIII complex and LqhIII binding site.
a Cartoon representation of the overall structure of the Na V 1.5 C /LqhIII. LqhIII, D IV-VS and D III- D IV linker were colored in purple, blue and orange, respectively. The same color scheme is appl...
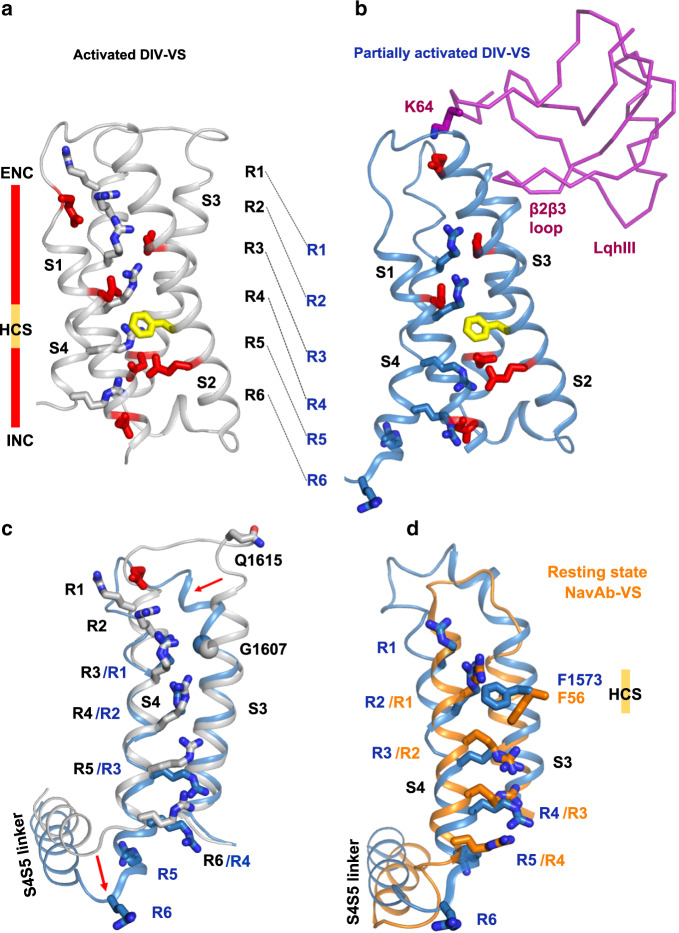
Fig. 4
Conformational Change of D IV-VS.
a , b Structures of the activated Na V 1.5 D IV-VS and intermediate-activated Na V 1.5 D IV-VS were colored in grey and blue, respectively. Gating charges (grey or blue), ENC (red), HCS (yellow), and ...
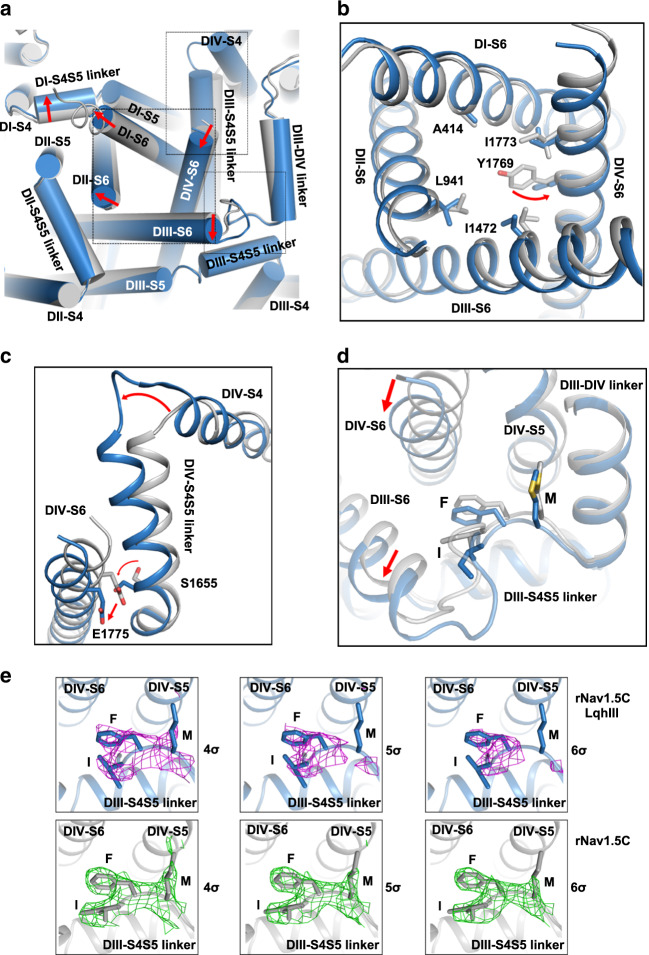
Fig. 5
Coupling of LqhIII binding and conformational change in D IV-VS to the S4u2013S5 linkers and the intracellular activation gate.
a Superposition of Na V 1.5 intracellular gate between activated (grey) and intermediate-activated (blue) states of the D IV-VS. Red arrows indicate the conformational changes. The black dash squares ...
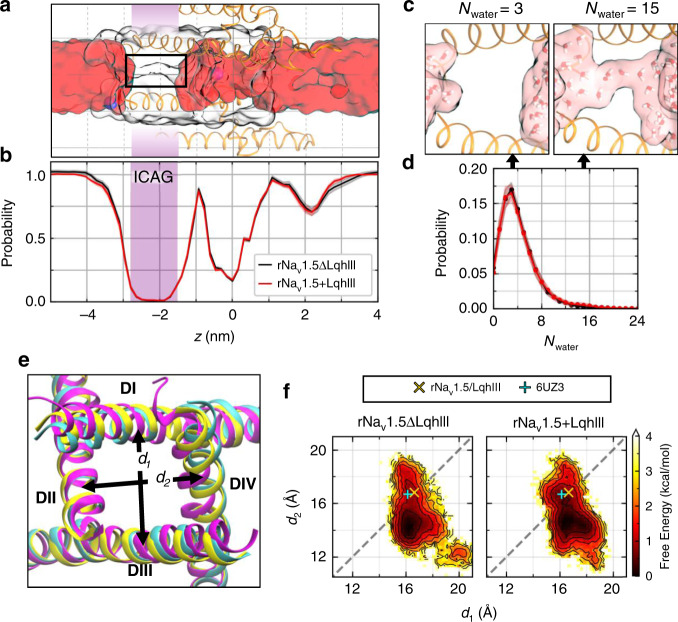
Fig. 6
Molecular dynamics analysis of hydration and Na + permeation through the rNa V 1.5 C /LqhIII complex.
a Side view of rNa V 1.5 C (orange ribbons; domains II and IV) from MD simulations highlighting Na + ions (blue spheres), the water-occupied volume within a cylinder of radius 8.5u2009u00c5 (red surfa...
Figure images are served from the NIH/NLM PubMed Central Open Access Subset or Europe PMC; copyright remains with the publishers and authors.
💬 Discussion
0 commentsNo comments yet. Be the first to start a discussion!
Leave a Comment