Abstract
The four-component intramembrane protease γ-secretase is intricately linked to the development of Alzheimer's disease. Despite recent structural advances, the transmembrane segments (TMs) of γ-secretase remain to be specifically assigned. Here we report a 3D structure of human γ-secretase at 4.32-Å resolution, determined by single-particle, electron cryomicroscopy in the presence of digitonin and with a T4 lysozyme fused to the amino terminus of presenilin 1 (PS1). The overall structure of this human γ-secretase is very similar to that of wild-type γ-secretase determined in the presence of amphipols. The 20 TMs are unambiguously assigned to the four components, revealing principles of subunit assembly. Within the transmembrane region, PS1 is centrally located, with its amino-terminal fragment (NTF) packing against Pen-2 and its carboxyl-terminal fragment (CTF) interacting with Aph-1. The only TM of nicastrin associates with Aph-1 at the thick end of the TM horseshoe, and the extracellular domain of nicastrin directly binds Pen-2 at the thin end. TM6 and TM7 in PS1, which harbor the catalytic aspartate residues, are located on the convex side of the TM horseshoe. This structure serves as an important framework for understanding the function and mechanism of γ-secretase.
🔬 Techniques
🧪 Sample Preparation
🏭 Microscope Brands
🧪 Reagent Suppliers
💻 Software Details
💾 Data Repositories
🏛️ Research Organizations (ROR)
Affiliated research institutions:
📋 Methods
Protein Preparation. The amino-terminal 75 residues in PS1 are flexible and exhibit little EM density ( 31 ). The predicted PS1-TM1 begins at residue 78. The cDNA for T4 lysozyme was placed at the 5′-end of the DNA sequence encoding residues 69–467 of PS1, using the pMLink vector ( 31 ). The other three components were the same as previously reported ( 31 ). Culture and transfection of HEK 293S GnTI − cells [American Type Culture Collection (ATCC)] and purification of γ-secretase were as described ( 31 ), except that amphipols were replaced by 0.1% digitonin (Sigma). In the last step, the purified γ-secretase was fractionated on a Superose-6 column (GE Healthcare) in 0.1% digitonin, 25 mM Hepes, pH 7.4, and 150 mM NaCl. The peak fractions were concentrated for cryo-EM grid preparation or were used for activity assays. Activity Assays. Purified wild-type or T4 lysozyme fused γ-secretase, either in amphipols or digitonin, was mixed with APP-C99 in 0.2% 3-[(3-cholamidopropyl)dimethylammonio]-2-hydroxy-1-propanesulfonate (CHAPSO), 50 mM Hepes, pH 7.0, 0.1% phosphatidylcholine, and 0.025% phosphatidylethanolamine and incubated at 37 °C for 4 h as described ( 38 ). To detect the cleavage products Aβ40 and Aβ42, the AlphaLISA assay was performed following the standard protocol as described in the AlphaLISA kit (PerkinElmer). Briefly, 2-μL reaction samples were incubated at 22 °C for 1 h with 8 μL AlphaLISA Aβ1–40/42 Acceptor beads. After a 30-min incubation with 10 μL AlphaLISA Aβ1–40/42 donor beads in darkness at 22 °C, the samples were read by an Envision-Alpha Reader (PerkinElmer). The assay was repeated at least three times for each data point. Cryo-EM Data Acquisition. Cryo-EM grids were prepared with Vitrobot Mark IV (FEI). Aliquots of 3 μL T4-lysozyme fused γ-secretase at 25 μM were applied to glow-discharged Quantifoil Cu R1.2/1.3 grids, blotted for 4 s, and plunged into liquid ethane cooled by liquid nitrogen. The samples were imaged by Titan Krios (FEI) at 300 kV with a nominal magnification of 22,500. Defocus varied from 1.3 to 3.0 μm. Images were recorded by a K2 Summit counting camera (Gatan Company) with superresolution mode and binned to a pixel size of 1.32 Å. Each image was dose-fractionated to 32 frames with a dose rate of ∼6 counts per second per physical pixel (∼4.5 e − /s Å 2 ), a total exposure time of 10.4 s, and 0.325 s per frame. UCSFImage4 was used for all data collection (developed by X.L.). Image Processing. The images were aligned and summed using the whole-image motion correction ( 39 ). The defocus value of each image was determined by CTFFIND3 ( 40 ). A total of 575,155 particles were picked from 3,312 micrographs using the automatic particle picking subroutine in RELION ( 41 ). Using RELION and IMAGIC ( 42 ), a reference-free 2D classification was performed, yielding 409,909 good particles. The initial 3D model for further 3D analysis was generated using EMAN2 subroutine e2initialmodel.py ( 43 ). Similar to our previous work ( 31 ), the initial model has an overall duck-like shape. The handedness of the initial model was determined and corrected by the comparison. Three-dimensional classification and refinement were carried out using RELION 1.3 ( 41 ). Through 3D classification against the initial model low-pass–filtered to 60 Å, 409,909 particles were classified to generate the most homogeneous class of 219,144 particles. The autorefine procedure of this class produced a 3D reconstruction with a resolution of 4.47 Å, which showed clear secondary structural elements. Using the 219,144 particles, we performed a second-round of 3D classification against the 4.47 Å model, with an eight-class designation and 3.7° precision for local angular search. A total of 177,207 particles from the best six classes were selected for further autorefining. The final 3D reconstruction shows an overall resolution of 4.32 Å based on the gold standard FSC corrected by the phase randomization approach ( 44 ). The final density maps were sharpened by applying a negative B-factor estimated by automated procedures. Local resolution was estimated using ResMap ( 45 ).
Show full methods section
Protein Preparation. The amino-terminal 75 residues in PS1 are flexible and exhibit little EM density ( 31 ). The predicted PS1-TM1 begins at residue 78. The cDNA for T4 lysozyme was placed at the 5′-end of the DNA sequence encoding residues 69–467 of PS1, using the pMLink vector ( 31 ). The other three components were the same as previously reported ( 31 ). Culture and transfection of HEK 293S GnTI − cells [American Type Culture Collection (ATCC)] and purification of γ-secretase were as described ( 31 ), except that amphipols were replaced by 0.1% digitonin (Sigma). In the last step, the purified γ-secretase was fractionated on a Superose-6 column (GE Healthcare) in 0.1% digitonin, 25 mM Hepes, pH 7.4, and 150 mM NaCl. The peak fractions were concentrated for cryo-EM grid preparation or were used for activity assays. Activity Assays. Purified wild-type or T4 lysozyme fused γ-secretase, either in amphipols or digitonin, was mixed with APP-C99 in 0.2% 3-[(3-cholamidopropyl)dimethylammonio]-2-hydroxy-1-propanesulfonate (CHAPSO), 50 mM Hepes, pH 7.0, 0.1% phosphatidylcholine, and 0.025% phosphatidylethanolamine and incubated at 37 °C for 4 h as described ( 38 ). To detect the cleavage products Aβ40 and Aβ42, the AlphaLISA assay was performed following the standard protocol as described in the AlphaLISA kit (PerkinElmer). Briefly, 2-μL reaction samples were incubated at 22 °C for 1 h with 8 μL AlphaLISA Aβ1–40/42 Acceptor beads. After a 30-min incubation with 10 μL AlphaLISA Aβ1–40/42 donor beads in darkness at 22 °C, the samples were read by an Envision-Alpha Reader (PerkinElmer). The assay was repeated at least three times for each data point. Cryo-EM Data Acquisition. Cryo-EM grids were prepared with Vitrobot Mark IV (FEI). Aliquots of 3 μL T4-lysozyme fused γ-secretase at 25 μM were applied to glow-discharged Quantifoil Cu R1.2/1.3 grids, blotted for 4 s, and plunged into liquid ethane cooled by liquid nitrogen. The samples were imaged by Titan Krios (FEI) at 300 kV with a nominal magnification of 22,500. Defocus varied from 1.3 to 3.0 μm. Images were recorded by a K2 Summit counting camera (Gatan Company) with superresolution mode and binned to a pixel size of 1.32 Å. Each image was dose-fractionated to 32 frames with a dose rate of ∼6 counts per second per physical pixel (∼4.5 e − /s Å 2 ), a total exposure time of 10.4 s, and 0.325 s per frame. UCSFImage4 was used for all data collection (developed by X.L.). Image Processing. The images were aligned and summed using the whole-image motion correction ( 39 ). The defocus value of each image was determined by CTFFIND3 ( 40 ). A total of 575,155 particles were picked from 3,312 micrographs using the automatic particle picking subroutine in RELION ( 41 ). Using RELION and IMAGIC ( 42 ), a reference-free 2D classification was performed, yielding 409,909 good particles. The initial 3D model for further 3D analysis was generated using EMAN2 subroutine e2initialmodel.py ( 43 ). Similar to our previous work ( 31 ), the initial model has an overall duck-like shape. The handedness of the initial model was determined and corrected by the comparison. Three-dimensional classification and refinement were carried out using RELION 1.3 ( 41 ). Through 3D classification against the initial model low-pass–filtered to 60 Å, 409,909 particles were classified to generate the most homogeneous class of 219,144 particles. The autorefine procedure of this class produced a 3D reconstruction with a resolution of 4.47 Å, which showed clear secondary structural elements. Using the 219,144 particles, we performed a second-round of 3D classification against the 4.47 Å model, with an eight-class designation and 3.7° precision for local angular search. A total of 177,207 particles from the best six classes were selected for further autorefining. The final 3D reconstruction shows an overall resolution of 4.32 Å based on the gold standard FSC corrected by the phase randomization approach ( 44 ). The final density maps were sharpened by applying a negative B-factor estimated by automated procedures. Local resolution was estimated using ResMap ( 45 ).
Model
Building and Refinement. The atomic models for nicastrin ECD and PS1 were generated from the crystal structures of DpNCT (PDB ID: 4R12) ( 30 ) and PSH (PDB ID: 4HYG) ( 29 ) by CHAINSAW ( 46 ) and docked into the density map by CHIMERA ( 47 ). T4 lysozyme was fitted into the density map manually by COOT (PDB ID: 4S0W). Poly-Ala models for the TMs of Aph-1, Pen-2, and nicastrin were manually built by COOT ( 48 ). The structure was refined in real space by PHENIX ( 49 ) with secondary structure restraint and manually adjusted in COOT.
📊 Figures
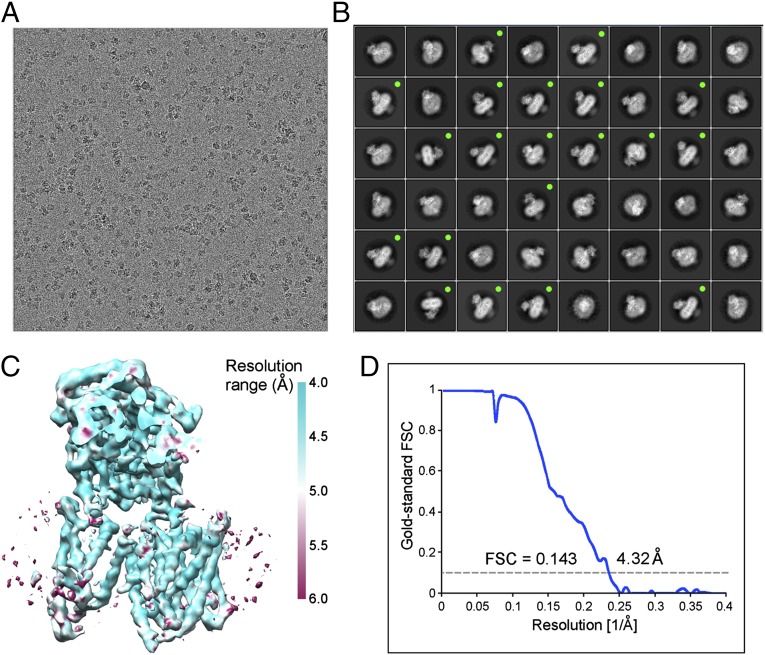
Fig. 1.
Cryo-EM analysis of human u03b3-secretase. ( A ) A representative micrograph of the u03b3-secretase sample. An entire micrograph is shown. ( B ) Representative 2D classifications of the u03b3-secretas...
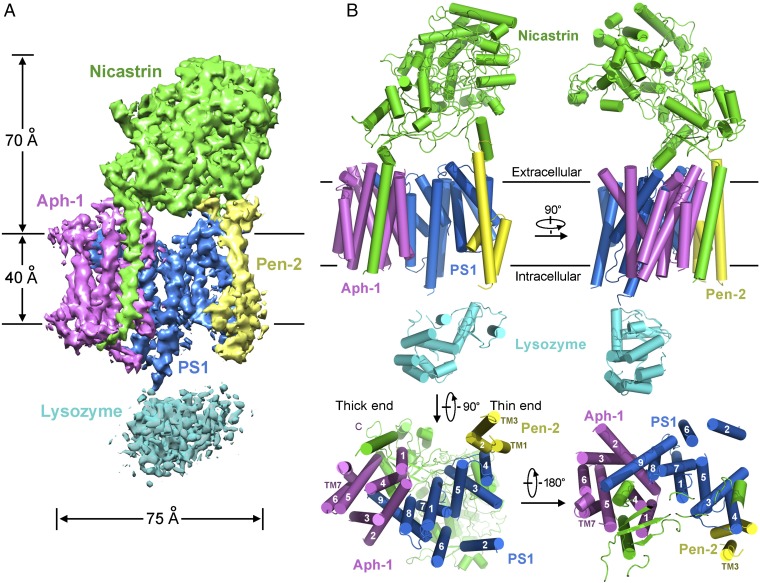
Fig. 2.
Overall structure of human u03b3-secretase. ( A ) An overall view of the EM density at 4.32-u00c5 resolution. Densities for the four components of u03b3-secretase are color-coded: PS1 (blue), Pen-2 (y...
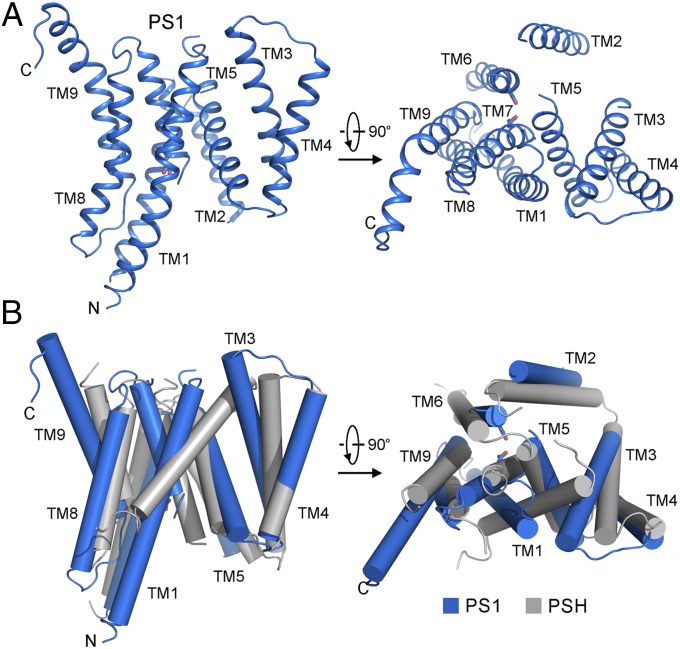
Fig. 3.
Structural features of PS1. ( A ) PS1 exhibits a loosely organized structure. PS1 is shown in two perpendicular cartoon representations. The nine TMs are organized into an extended structure, with TM3...
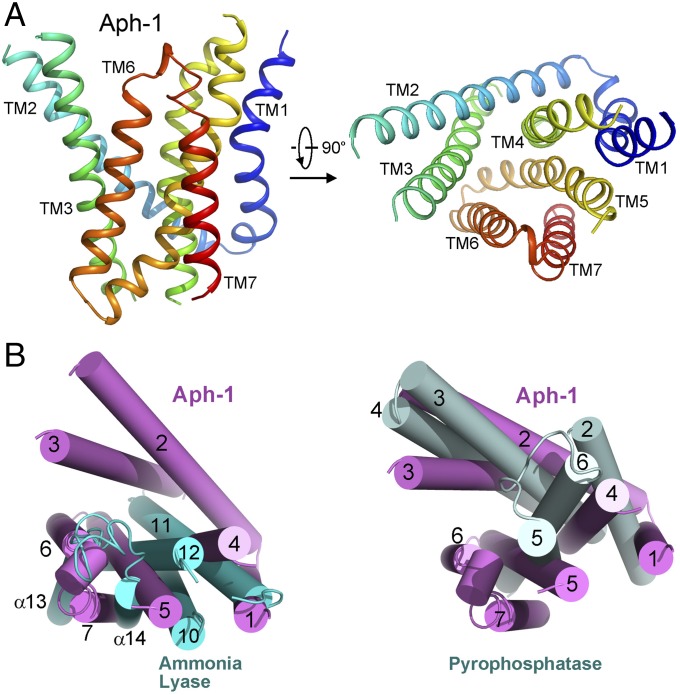
Fig. 4.
Structural features of Aph-1. ( A ) Overall structure of Aph-1 is shown in two perpendicular views. The seven TMs are rainbow-colored, with amino terminus in blue and carboxyl terminus in red. ( B ) S...
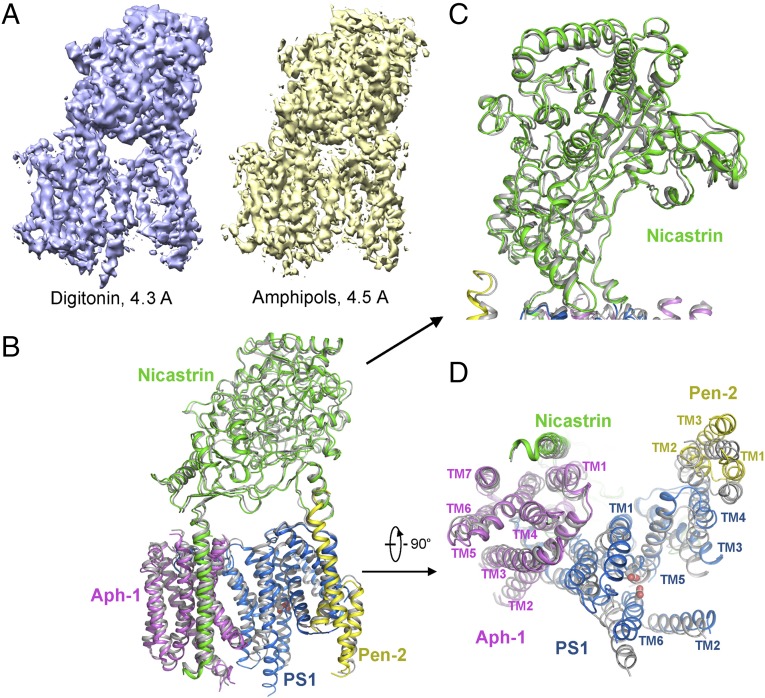
Fig. 5.
Impact of detergents on the structure of u03b3-secretase. ( A ) Comparison of the overall EM densities for u03b3-secretase under digitonin ( Left ) versus amphipols ( Right ). The fine helical feature...
Figure images are served from the NIH/NLM PubMed Central Open Access Subset or Europe PMC; copyright remains with the publishers and authors.
💬 Discussion
0 commentsNo comments yet. Be the first to start a discussion!
Leave a Comment