Abstract
Microtubules are polymers of αβ-tubulin heterodimers essential for all eukaryotes. Despite sequence conservation, there are significant structural differences between microtubules assembled in vitro from mammalian or budding yeast tubulin. Yeast MTs were not observed to undergo compaction at the interdimer interface as seen for mammalian microtubules upon GTP hydrolysis. Lack of compaction might reflect slower GTP hydrolysis or a different degree of allosteric coupling in the lattice. The microtubule plus end-tracking protein Bim1 binds yeast microtubules both between αβ-tubulin heterodimers, as seen for other organisms, and within tubulin dimers, but binds mammalian tubulin only at interdimer contacts. At the concentrations used in cryo-electron microscopy, Bim1 causes the compaction of yeast microtubules and induces their rapid disassembly. Our studies demonstrate structural differences between yeast and mammalian microtubules that likely underlie their differing polymerization dynamics. These differences may reflect adaptations to the demands of different cell size or range of physiological growth temperatures.
🔬 Techniques
🔭 Microscopes
🧬 Organisms
💻 Software
✨ Fluorophores
🏭 Microscope Brands
🧪 Reagent Suppliers
📷 Detectors
💻 Software Details
💾 Data Repositories
🏛️ Research Organizations (ROR)
Affiliated research institutions:
📋 Methods
Reagents
All reagents were purchased from Sigma-Aldrich unless otherwise specified.
Microtubule preparation
Purified porcine tubulin was resuspended and stored as recommended by the manufacturer (T240; Cytoskeleton, Inc.). A yeast strain whose tubulin had been sensitized to Taxol by mutating residues on β-tubulin (strain MGY2) was kindly provided by M. Gupta (Iowa State University, Ames, IA) and was previously described ( Gupta et al., 2003 ). The endogenous tubulin from this strain was purified according to previous protocols ( Drummond et al., 2011 ). Yeast tubulin was purified from inducible overexpressing strains of S. cerevisiae using Ni-affinity and ion-exchange chromatography as described previously ( Geyer et al., 2015 ). Tubulin samples were stored in storage buffer (10 mM Pipes, pH 6.9, 1 mM MgCl 2 , and 1 mM EGTA) containing 50 µM GTP. 6xHis-tagged Bim1-EGFP monomeric construct, comprising Bim1 aa 1–210, was purified according to previous protocols ( Zimniak et al., 2009 ), as was the human EB3 monomer with aa 1–200 ( Zhang et al., 2015 ). The construct for EB1-GFP was generously loaned from the Kapoor laboratory (Rockefeller University, New York, NY). Expression and purification of EB1-GFP was performed as previously described ( Forth et al., 2014 ). Aliquots were stored at −80°C until needed. Aggregates from the freeze-thaw cycle were removed by cold filtration using spin filters (UFC3 0VV 25; Thermo Fisher Scientific) before polymerization. All tubulin was polymerized in BRB80 (80 mM Pipes, pH 6.9, 1 mM EGTA, 1 mM MgCl 2 , and 1 mM DTT) supplemented with 10% glycerol and 1 mM GTP at 30°C. Taxol (TXD01; Cytoskeleton, Inc.) and epothilone-B (S1364; Selleck Chemicals) were dissolved in DMSO to 2 and 1 mM, respectively. Dynamic microtubules were polymerized for 15 min. To generate GMPCPP and GTPγS MTs, the dynamic MTs were pelleted at 17,000 g for 20 min, the supernatant was discarded, and the pellet was resuspended in cold BRB80 buffer with 2 mM of the desired nucleotide and left in ice for 20 min to fully depolymerize and exchange the nucleotide bound to β-tubulin, according to previous protocols ( Hyman et al., 1992 ; Zhang et al., 2015 ). The sample was then warmed to 30°C for 30 min to polymerize into MTs. Nucleotide exchange was verified by the stability of the resulting MTs. For drug stabilized MTs (Taxol and epothilone), dynamic MTs were first polymerized for 10 min, and approximately twofold molar excess of drug was added and polymerized for another 20 min. To minimize the amount of unpolymerized tubulin in the EM images, all MT samples were pelleted at 17,000 g for 20 min before making EM grids, then the pellets were resuspended in BRB80 buffer supplemented with the appropriate nucleotide or drug before vitrification.
Show full methods section
Reagents
All reagents were purchased from Sigma-Aldrich unless otherwise specified.
Microtubule preparation
Purified porcine tubulin was resuspended and stored as recommended by the manufacturer (T240; Cytoskeleton, Inc.). A yeast strain whose tubulin had been sensitized to Taxol by mutating residues on β-tubulin (strain MGY2) was kindly provided by M. Gupta (Iowa State University, Ames, IA) and was previously described ( Gupta et al., 2003 ). The endogenous tubulin from this strain was purified according to previous protocols ( Drummond et al., 2011 ). Yeast tubulin was purified from inducible overexpressing strains of S. cerevisiae using Ni-affinity and ion-exchange chromatography as described previously ( Geyer et al., 2015 ). Tubulin samples were stored in storage buffer (10 mM Pipes, pH 6.9, 1 mM MgCl 2 , and 1 mM EGTA) containing 50 µM GTP. 6xHis-tagged Bim1-EGFP monomeric construct, comprising Bim1 aa 1–210, was purified according to previous protocols ( Zimniak et al., 2009 ), as was the human EB3 monomer with aa 1–200 ( Zhang et al., 2015 ). The construct for EB1-GFP was generously loaned from the Kapoor laboratory (Rockefeller University, New York, NY). Expression and purification of EB1-GFP was performed as previously described ( Forth et al., 2014 ). Aliquots were stored at −80°C until needed. Aggregates from the freeze-thaw cycle were removed by cold filtration using spin filters (UFC3 0VV 25; Thermo Fisher Scientific) before polymerization. All tubulin was polymerized in BRB80 (80 mM Pipes, pH 6.9, 1 mM EGTA, 1 mM MgCl 2 , and 1 mM DTT) supplemented with 10% glycerol and 1 mM GTP at 30°C. Taxol (TXD01; Cytoskeleton, Inc.) and epothilone-B (S1364; Selleck Chemicals) were dissolved in DMSO to 2 and 1 mM, respectively. Dynamic microtubules were polymerized for 15 min. To generate GMPCPP and GTPγS MTs, the dynamic MTs were pelleted at 17,000 g for 20 min, the supernatant was discarded, and the pellet was resuspended in cold BRB80 buffer with 2 mM of the desired nucleotide and left in ice for 20 min to fully depolymerize and exchange the nucleotide bound to β-tubulin, according to previous protocols ( Hyman et al., 1992 ; Zhang et al., 2015 ). The sample was then warmed to 30°C for 30 min to polymerize into MTs. Nucleotide exchange was verified by the stability of the resulting MTs. For drug stabilized MTs (Taxol and epothilone), dynamic MTs were first polymerized for 10 min, and approximately twofold molar excess of drug was added and polymerized for another 20 min. To minimize the amount of unpolymerized tubulin in the EM images, all MT samples were pelleted at 17,000 g for 20 min before making EM grids, then the pellets were resuspended in BRB80 buffer supplemented with the appropriate nucleotide or drug before vitrification.
Cryo-EM sample preparation and imaging
MTs were applied to a glow-discharged C-flat grid with 1.2-µm holes (Protochips). The Mark IV Vitrobot (FEI) used for sample vitrification was set to 30°C and 100% relative humidity for all samples. Dynamic MTs were resuspended in a 1-mg/ml kinesin monomer solution in warm EM buffer (BRB80 with 1 mM GTP and 0.05% Nonidet-P40) and directly applied to the grid. To decorate dynamic MTs with Bim1, it was necessary to resuspend the pellet in Bim1 and apply to the EM grid and plunge-freeze within 1 min. To prepare grids of stabilized MTs decorated with kinesin monomer, Bim1, or EB3, 2 µl MTs was first applied to the grid, allowed to adhere for 30 s, and then washed twice with 4 µl binding protein to saturate all the binding sites. Final concentrations were 25 µM for kinesin and 30 µM for Bim1 and EB3 proteins. No samples had both kinesin and Bim1/EB3. The grids were then blotted for 4 s with blot force 20 and plunged into ethane slush. Images were collected on a low-base Titan electron microscope (FEI) operated at 300 kV and equipped with a K2 direct detector (Gatan) using the Leginon automated data-collection pipeline ( Suloway et al., 2005 ). The micrographs have a nominal magnification of 27,500, resulting in a final pixel size of 1.32 Å per pixel. Twenty frames of 300 ms each were collected at a dose rate of 8 e − per pixel per second, with a total dose of 28 e − /Å 2 . The dynamic yeast microtubules decorated with Bim1 that were difficult to capture were imaged on a Tecnai F20 electron microscope (FEI) operated at 120 kV and equipped with a 4k Ultrascan CCD camera (Gatan). Micrographs were collected using Leginon ( Suloway et al., 2005 ) with a dose of 20 e − /Å 2 and nominal magnification of 80,000, giving a final size of 1.37 Å per pixel.
Image analysis and data processing
Images collected from the Titan microscope were processed using the Appion pipeline ( Lander et al., 2009 ), including individual frame alignment using MOTIONCORR ( Li et al., 2013 ), and CTF estimation using CTFFIND4 ( Rohou and Grigorieff, 2015 ). Images from the Tecnai F20 microscope were processed using the same software, except for the individual frame alignment. According to a previously published MT data-processing protocol ( Zhang and Nogales, 2015 ; Zhang et al., 2015 ), regions of the raw micrographs containing decorated MTs were extracted using overlapping square boxes of 675 Å, spaced 80 Å apart. Each of these boxes was treated as an independent, single particle using iterative helical real space reconstruction (IHRSR; Egelman, 2007 ). The boxed MT segments were sorted by PF number, and initial 3D alignment parameters were generated using EMAN2 multi-model refinement ( Tang et al., 2007 ) with models of 12, 13, 14, and 15 PF MTs ( Sui and Downing, 2010 ) low-pass filtered to 20-Å resolution, followed by IHRSR to obtain initial 3D reconstructions. Frealign ( Lyumkis et al., 2013 ) was then used to further process the dominant PF number for each MT condition to obtain better alignment parameters. Finally, we applied in-house scripts to determine the seam location (i.e., to align α- and β-tubulin) for particles from the same MT ( Zhang and Nogales, 2015 ). This step was critical in separating α- and β-tubulin. If our hypothesis, that the lack of compaction for the yeast dynamic MTs is caused by limited hydrolysis within the lattice, is true, then the experimental map for the E-site nucleotide should show additional density to that seen for the GDP state of mammalian MTs. Unfortunately, during our reconstruction of the dynamic MT state, it became apparent that our previously developed methods to identify the α/β-tubulin register and MT seam position were less effective when used on the yeast data; i.e., the final density still showed signs of α/β-tubulin mixing. One possible explanation would be the presence of multiple seams within an MT. Our efforts to investigate such a possibility indicated that this may be the case. After applying the in-house scripts to determine the seam for the 12-PF dynamic MTs (the largest dataset), we then performed maximum likelihood classification without symmetry in Frealign using 24 classes, to account for the possible seam locations and register of αβ-tubulin. Selected classes from this classification are shown in Fig. S3. The uneven kinesin density for certain PFs (Fig. S3 B), even when the dominant seam position is correctly identified and enforced, suggests that some fraction of the MTs might have additional seams. Unfortunately, our current data-processing algorithm cannot handle such cases. Because a certain percentage of α- and β-tubulin are incorrectly averaged together in our yeast MT reconstructions, we could not directly draw the conclusion of lack of hydrolysis based on the similarity of the densities seen for the E-site and N-site nucleotide. This shortcoming, however, does not exclude the possibility that GTP is only partially hydrolyzed within the yeast MT lattice during assembly. Note that the possibility of A-lattice MTs was also considered, but no evidence for A-lattices could be found in the power spectra of individual MTs decorated with kinesin or Bim1, as has been previously reported for Mal3-decorated MTs ( des Georges et al., 2008 ). Local resolution estimates were performed with the Bsoft software package ( Heymann and Belnap, 2007 ) using the whole MT. Half-maps were generated using MT segments separated by MT, rather than even/odd images, to ensure that each half-map did not contain segments from the same MT. Despite similar imaging conditions and amount of data used, the resolution of the drug-stabilized structures (∼4 Å) was clearly worse than that for the dynamic MT reconstruction (3.7 Å; Fig. S2, A and B). Studies of mammalian MTs stabilized with either Taxol or zampanolide, which like epothilone also bind to the Taxol-binding pocket, have recently shown that these two drugs induce lattice flexibility ( Kellogg et al., 2017 ). Together with our present results, these findings suggest that MT-stabilizing agents that bind to the Taxol site induce the same lattice flexibility, whether in yeast or mammalian MTs.
Atomic model refinement
The resolution of our dynamic yeast MT cryo-EM map is sufficient to follow the path of the αβ-tubulin polypeptide chains and place large side chains, but some ambiguity is present for positioning some parts of the main chain and in the assignment of side-chain rotamers. To build the best possible atomic models of yeast tubulin from our cryo-EM density maps, we used Rosetta ( DiMaio et al., 2015 ), which incorporates statistical information from existing structures. The models were then further refined using REFMAC ( Brown et al., 2015 ) and Phenix ( Adams et al., 2011 ) to ensure good geometry. To build an atomic model, the model of an expanded mammalian tubulin heterodimer ( Zhang et al., 2015 ) was first manually fitted into the yeast dynamic MT reconstruction (which had the highest resolution) using Coot ( Emsley et al., 2010 ). Residues were mutated to match the yeast sequence, and regions of poor fit for the main chain were manually adjusted. To capture interactions between neighboring tubulin heterodimers, nine copies of this starting model were fitted into the density to form a 3 × 3 lattice of heterodimers. This results in the central heterodimer having all the appropriate neighbors for forming contacts. The central heterodimer, and the eight identical copies, were then refined using Rosetta ( DiMaio et al., 2015 ). An ensemble of structures (>1,000 structures) was generated to ensure sufficient sampling of possible solutions by Rosetta. The best structure from the ensemble of models was then subjected to minor refinements with Phenix ( Adams et al., 2011 ) and Refmac ( Brown et al., 2015 ) to ensure proper geometry of all amino acids and ligands. The dynamic starting model was used as the initial model for the epothilone and Taxol mutant model. After addition of the appropriate ligand or mutations using Coot, these models were used as initial models to generate Rosetta ensembles. The best models from the ensembles were then refined to generate the final model. To measure the intra- and interdimer distance for yeast states that did not go through the full model refinement procedure because of the limited resolution of the final map (12-PF GMPCPP and GTPγS and 13-PF dynamic, GMPCPP, and GTPγS), the model for the yeast dynamic tubulin was split into α- and β-monomers with their associated nucleotide, and each monomer was independently fitted as rigid body into the map. Accession numbers The following cryo-EM maps and refined atomic models (accession numbers indicated) have been deposited in the Electron Microscopy Data Bank: Dynamic MT (EMDB-8755, PDB entry 5W3F), Taxol MT (EMD-8757, PDB entry 5W3J), Epothilone MT (EMD-8756, PDB entry 5W3H), GTPγS MT (EMD-8759), and GMPCPP (EMD-8758). Online supplemental material Fig. S1 shows yeast MT reconstructions. Fig. S2 shows Fourier shell correlation curves, local resolution estimation, and lattice parameters. In Fig. S3, classification of 12-PF data shows uneven PF mixing.
Table
S1 is a summary of the lattice parameters for each yeast MT state analyzed.
Online supplemental material Fig. S1 shows yeast MT reconstructions. Fig. S2 shows Fourier shell correlation curves, local resolution estimation, and lattice parameters. In Fig. S3, classification of 12-PF data shows uneven PF mixing.
Table
S1 is a summary of the lattice parameters for each yeast MT state analyzed.
📊 Figures
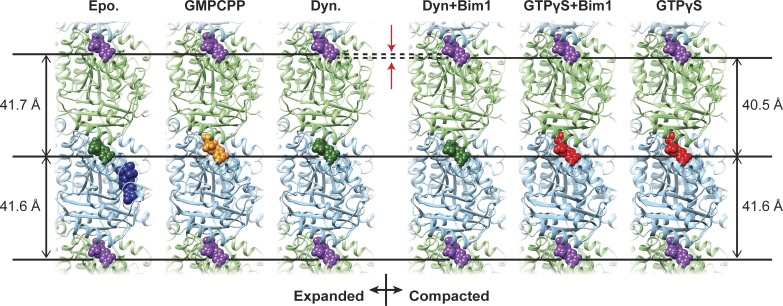
Figure 1.
Lattice distinctions for yeast MTs. Models of two tubulin dimers from a PF for the indicated state. Expanded lattices (epothilone, GMPCPP, and dynamic) and compacted lattices (Dyn+Bim1, GTPu03b3S+Bim1...
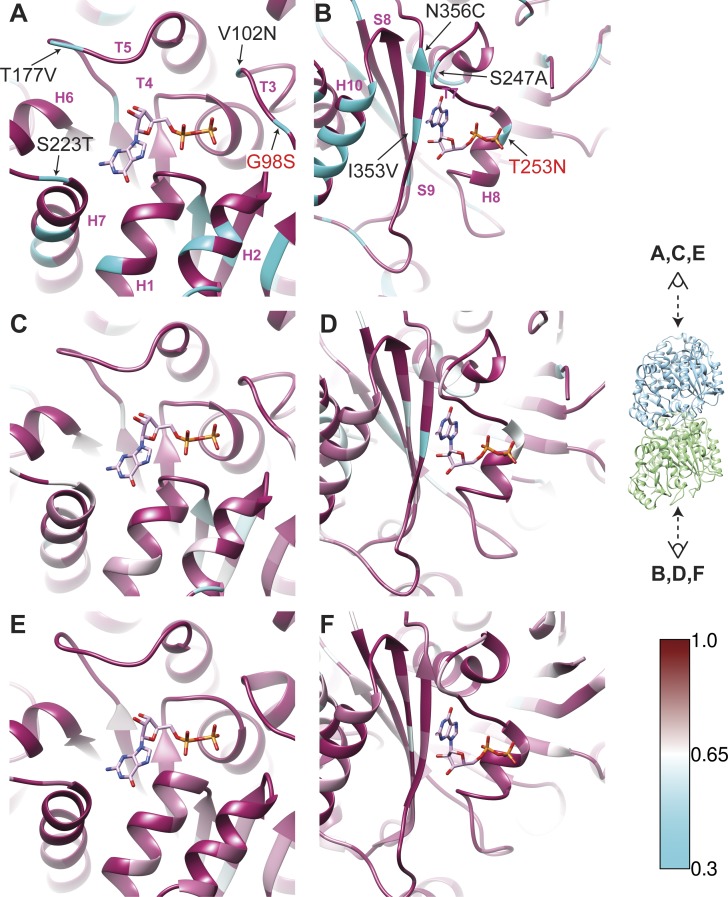
Figure 2.
Tubulin conservation around the E-site. (A and B) View from plus end (A) and minus end (B) of the MT showing sequence conservation around the E-site nucleotide between yeast and mammalian tubulin. Ide...
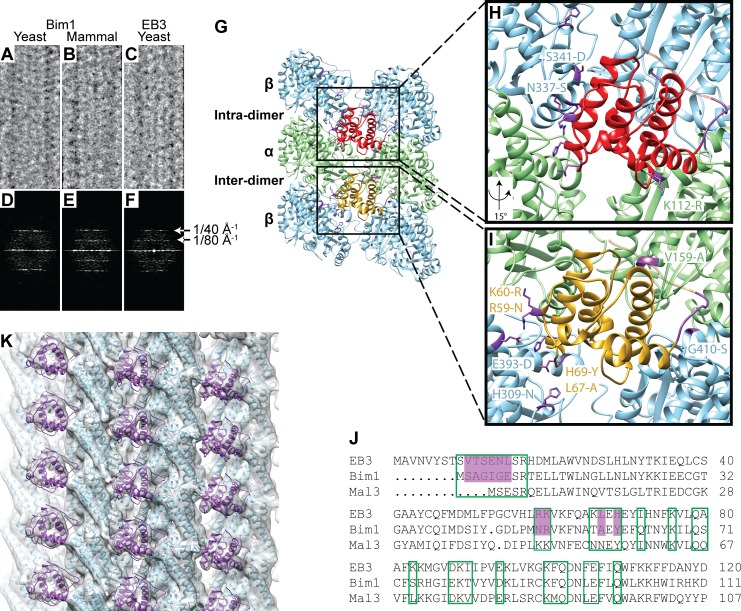
Figure 3.
Bim1 binds yeast microtubules with a monomer repeat binding pattern. (Au2013C) Raw images of MTs assembled from yeast (A and C) or mammalian (B) tubulin decorated with the +TIP Bim1 (A and B) or human...
Figure images are served from the NIH/NLM PubMed Central Open Access Subset or Europe PMC; copyright remains with the publishers and authors.
💬 Discussion
0 commentsNo comments yet. Be the first to start a discussion!
Leave a Comment