Abstract
The open reading frame (ORF) 7a of the SARS-associated coronavirus (SARS-CoV) encodes a unique type I transmembrane protein of unknown function. We have determined the 1.8 A resolution crystal structure of the N-terminal ectodomain of orf7a, revealing a compact seven-stranded beta sandwich unexpectedly similar in fold and topology to members of the Ig superfamily. We also demonstrate that, in SARS-CoV- infected cells, the orf7a protein is expressed and retained intracellularly. Confocal microscopy studies using orf7a and orf7a/CD4 chimeras implicate the short cytoplasmic tail and transmembrane domain in trafficking of the protein within the endoplasmic reticulum and Golgi network. Taken together, our findings provide a structural and cellular framework in which to explore the role of orf7a in SARS-CoV pathogenesis.
🔬 Techniques
🔭 Microscopes
🧬 Organisms
✨ Fluorophores
🧪 Sample Preparation
🔬 Cell Lines
🏭 Microscope Brands
🧪 Reagent Suppliers
💾 Data Repositories
🏛️ Research Organizations (ROR)
Affiliated research institutions:
📋 Methods
Protein Expression and Refolding A fragment of ORF 7a cDNA encoding amino acids −2 through 81 was inserted between the NcoI and BamHI sites of the bacterial expression vector pET-21a. This plasmid was introduced into BL21(DE3)-RIL codon (+) E. coli cells for expression. Recombinant protein was recovered as an inclusion body pellet, denatured, reduced, and then renatured by rapid dilution in refolding buffer consisting of 1 M arginine, 100 mM Tris-HCl, 2 mM EDTA, 200 µM PMSF, 5 mM reduced glutathione, and 500 µM oxidized glutathione at a final pH of 8.3. After 24 hr, the soluble-refolded protein was collected over YM10 membrane in a stirred cell concentrator, passed through a 0.45 μm filter, and subjected to sizing on Superdex 200 using an AKTA-FPLC. The original cDNA clone differed by a single nucleotide from the published sequence (C→A at position 27,360 as numbered in NCBI Accession No. AY278741.1 ). All of our constructs maintain the resulting Leu15 to Ile15 replacement. The final recombinant fragment of orf7a spanned amino acid residues M(−3)SC/ELY···EEVQQE81* and contained no extraneous tags.
Crystal Growth and Preparation
Purified orf7a protein (8 mg/ml in 20 mM HEPES [pH 7.4], 20 mM NaCl) was mixed with an equal volume of reservoir solution containing 16% polypropylene glycol 400 and 100 mM NaOAc/HCl at pH 5.35, then left to equilibrate in hanging drops. Hexagonal crystals belonging to space group P3 1 (a = b = 37.10 Å, c = 55.33 Å) grew as triangular rods. These crystals were prepared for flash cooling at 100 K by transfer into reservoir solution containing 20% ethylene glycol for about 20 s. Heavy-atom Pt derivatives were used to determine the initial phasing by multiple isomorphous replacement (MIR). Fresh 10 mM stock solutions of potassium tetracyanoplatinate (II) [K 2 Pt(CN) 4 ], potassium tetrachloroplatinate (II) (K 2 PtCl 4 ), and potassium tetranitroplatinate (II) [K 2 Pt(NO 2 ) 4 ] were prepared in well solution. Hanging drops containing crystals were supplemented with one-tenth volume of heavy-atom stock solution and held at room temperature for various times.
Show full methods section
Protein Expression and Refolding A fragment of ORF 7a cDNA encoding amino acids −2 through 81 was inserted between the NcoI and BamHI sites of the bacterial expression vector pET-21a. This plasmid was introduced into BL21(DE3)-RIL codon (+) E. coli cells for expression. Recombinant protein was recovered as an inclusion body pellet, denatured, reduced, and then renatured by rapid dilution in refolding buffer consisting of 1 M arginine, 100 mM Tris-HCl, 2 mM EDTA, 200 µM PMSF, 5 mM reduced glutathione, and 500 µM oxidized glutathione at a final pH of 8.3. After 24 hr, the soluble-refolded protein was collected over YM10 membrane in a stirred cell concentrator, passed through a 0.45 μm filter, and subjected to sizing on Superdex 200 using an AKTA-FPLC. The original cDNA clone differed by a single nucleotide from the published sequence (C→A at position 27,360 as numbered in NCBI Accession No. AY278741.1 ). All of our constructs maintain the resulting Leu15 to Ile15 replacement. The final recombinant fragment of orf7a spanned amino acid residues M(−3)SC/ELY···EEVQQE81* and contained no extraneous tags.
Crystal Growth and Preparation
Purified orf7a protein (8 mg/ml in 20 mM HEPES [pH 7.4], 20 mM NaCl) was mixed with an equal volume of reservoir solution containing 16% polypropylene glycol 400 and 100 mM NaOAc/HCl at pH 5.35, then left to equilibrate in hanging drops. Hexagonal crystals belonging to space group P3 1 (a = b = 37.10 Å, c = 55.33 Å) grew as triangular rods. These crystals were prepared for flash cooling at 100 K by transfer into reservoir solution containing 20% ethylene glycol for about 20 s. Heavy-atom Pt derivatives were used to determine the initial phasing by multiple isomorphous replacement (MIR). Fresh 10 mM stock solutions of potassium tetracyanoplatinate (II) [K 2 Pt(CN) 4 ], potassium tetrachloroplatinate (II) (K 2 PtCl 4 ), and potassium tetranitroplatinate (II) [K 2 Pt(NO 2 ) 4 ] were prepared in well solution. Hanging drops containing crystals were supplemented with one-tenth volume of heavy-atom stock solution and held at room temperature for various times.
Data Collection and Model Refinement
Single-wavelength diffraction data were collected on our home source and at the Advance Photon Source Beamline ID-14BM (Argonne National Laboratory) ( Table 1 ). Data were integrated and scaled with DENZO, SCALEPACK, and HKL2000 ( Otwinowski and Minor, 1997 ). Heavy-atom sites were located in CNS ( Brunger et al., 1998 ) and refined with SOLVE ( Terwilliger and Berendzen, 1999 ). A random set of reflections containing 5% of the data was excluded from the refinement for calculation of R free . The experimental electron density map was subjected to density modification with DM ( Cowtan, 1994 ). The experimental phase maps are of exceptional quality at 2.2 Å. There is no electron density for the first 2 and the last 14 amino acid residues of the 84 encoded by the construct. Solvent accessibilities were calculated with NACCESS (probe radius 1.4 Å) ( Hubbard et al., 1991 ). Molecular diagrams were drawn using the programs GRASP ( Nicholls et al., 1993 ) and RIBBONS ( Carson, 1991 ).
Antibody Generation
BALB/c mice were immunized intraperitoneally with 25 μg of recombinant orf7a protein in 0.2 ml of Ribi adjuvant (Corixa) and boosted twice at 21 day intervals using the same formulation. Test bleeds were used to select a single mouse for fusion. This mouse was boosted intravenously with 5 μg protein diluted in PBS 14 days after its last injection. Three days later, the animal was sacrificed and the spleen was removed. The murine nonsecreting myeloma cell line P3x63Ag8.653 was used as the partner in a standard PEG 1500 fusion. Hybridomas were seeded directly into 96-well plates containing peritoneal macrophages as feeder cells. After 10 days of selection in hypoxanthine, aminopterin, and thymidine solutions (HAT), supernatants were screened by ELISA for anti-orf7a mAbs using solid-phase orf7a protein. Positive hybridomas were expanded in Iscove’s modified Dulbecco’s medium containing HT, 20% FBS (low IgG fetal bovine serum, Hyclone), 3% hybridoma cloning growth factor (IGEN), 4 mM L-glutamine, and antibiotics, then cloned by limiting dilution.
Immunoprecipitations and N-Terminal Sequencing
Vero cells were infected with SARS-CoV (Urbani) at an moi of 0.01. At 48 hr postinfection, the cells were washed in 50 mM HEPES (pH 7.5), 1 mM EGTA, 1500 µM MgCl 2 , 150 mM NaCl, and 1× complete protease inhibitors (Roche), then suspended at 1 × 10 7 cells/ml in the same buffer. The cells were lysed with an equal volume of 2.0% Triton X-100 in 150 mM NaCl. After centrifugation, supernatants were precleared with protein A Sepharose. The anti-orf7a mAb 2E11 was added to 10 μg/ml and held 60 min at 4°C. Immune complexes were recovered on protein A Sepharose and washed in cold lysis buffer without protease inhibitors before being heated to 90°C in loading buffer (62.5 mM Tris-HCl [pH 6.0], 2% SDS, 5% 2-mercaptoethanol, 500 mM sucrose) for 5 min. After separation on SDS-PAGE, the proteins were transferred to polyvinylidene difluoride membrane. The blot was rinsed in distilled water and then methanol before soaking 2 min in 1.1% w/v Coomassie blue, 40% v/v methanol/water, and 1% acetic acid. Several changes of 50% methanol were required to destain the blot. The orf7a region was excised for N-terminal sequencing ( Table 2 B). Orf7a and CD4 Fusion Constructs ORF 7a was also cloned into the mammalian expression vector pEGFP-N1 (BD Biosciences) downstream of the CMV promoter and in-frame with the GFP fusion tag. NheI and BamHI restriction sites were engineered to flank the insert. The resulting orf7a/linker/GFP fusion gene encodes M A IILF···IKRKTE/DPPVAT/MVSKG···DELYK*. Similarly, a full-length cDNA encoding human CD4 (nucleotides 153–1529 in accession number NM_000616 ) was inserted in pEGFP-N1 in-frame with the GFP tag. The resulting CD4/linker/GFP fusion protein spanned M A RGVP···CSPI/EDPPVAT/MVSKG···DELYK*. Two chimeric fusion genes were made from these constructs, a CD4/orf7a tail-GFP fusion having the amino acid sequence MARGVP···IFFCV/KRKTE/DPPVAT/MVSKG···DELYK* and a CD4/orf7a TM tail-GFP fusion having the sequence MARGVP···TWSTPVD/LYSPL···KRKTE/ DPPVAT/MVSKG···DELYK*. Orf7aAA-GFP was made by changing the orf7a cytoplasmic tail sequence from KRKTE to A R A TE. Immunofluorescence Localizations Vero E6 (ATCC CRL-1586) and 293T/17 (CRL-11268) cells were cultured in DMEM supplemented with 10% heat-inactivated fetal bovine serum, 1 mM glutamine, and 100 U/ml penicillin/streptomycin. The cells were incubated in a 95% air, 5% CO 2 humidified incubator at 37°C. Vero cells were plated onto glass cover slips in 3.5 cm diameter tissue culture dishes and incubated overnight at 37°C. The cells were transfected using the LT-1 (Mirrus) transfection reagent (1 μg plasmid DNA and 4 μl of transfection reagent per dish) as previously described ( Pekosz and Lamb, 1999 ). Eighteen hours posttransfection, the cells were washed in PBS and fixed in 1% methanol-free formaldehyde for 10 min at room temperature. After extensive washing in PBS, the cells were incubated with antibody diluted in PBS containing 3% normal goat sera for 1 hr. The cells were washed three times with PBS and then incubated with a secondary antibody for 30 min as appropriate. The cover slips were mounted onto microscope slides using Prolong (Molecular Probes) and visualized on a Zeiss LSM 510 confocal microscope. Primary antibodies used were 2E11 (anti-orf7a, 1:100 dilution mouse mono clonal), anti Golgin 97 (Sigma, 1:500 dilution, mouse monoclonal), or anti-calnexin (Sigma, 1:500 dilution, rabbit polyclonal). Secondary antibodies include goat anti-mouse IgG or goat anti-rabbit IgG conjugated to Alexafluor 594 (Molecular Probes; 1:500 dilution). When appropriate, cells were permeabilized by the addition of 0.1% saponin to all buffers postfixation. Nuclei were counter stained with Topro included with the secondary antibody. Fluorescence-Activated Cell Sorting 293T or Vero cells were plated overnight onto 3.5 cm dishes. The cells were transfected with the indicated plasmids (1 μg plasmid per dish, 2 or 4 μl of transfection reagent for 293T or Vero cells, respectively) and stained for flow cytometry as previously described ( Pekosz and Lamb, 1999 ). Primary antibody 2E11 (dilution 1:100 of 2.4 mg/ml stock) was followed by goat anti-mouse IgG conjugated to Alexafluor 647 (Molecular Probes; 1:1000 dilution) or anti-human CD4 conjugated to Tri-color (Caltag; 1:500 dilution). The cells were analyzed on a FACSCalibur flow cytometer using CellQuest software.
Mass Spectrometry
The sequence of the orf7a luminal domain construct (MSCEL.... EVQQE*) predicts a molecular weight of 9412.55 Amu without the N-terminal Met (usually removed by endogenous amino-peptidase activity). To prepare a sample for electrospray mass spectrometry (ESMS), 10 μg of protein was brought to a volume of 100 μl in water and mixed with 100 μl of 20% trichloroacetic acid. This mixture was held on ice for 30 min. The sample was spun in a microfuge at 16,000 × g at 4°C for 20 min. The precipitate was washed with 300 μl of cold acetone and spun again at 16,000 × g at 4°C for 5 min. The protein pellet was air dried and resuspended in 20 μl of 60% acetonitrile with 0.1% formic acid for analysis. ESMS yielded the expected molecular weight but also a smaller fragment corresponding to a loss of nine amino acids from the stalk at the C terminus. The protein used for the crystallization trials contained a mixture of the full-length and truncated forms. The observed weights also indicate two disulfide bonds per monomer, with the extra cysteine capped by glutathione (briefly, 9713.81 Amu = 9412.55 fragment − 5.04 Amu for 5 Hs + 306.3 Amu for oxidized glutathione, and similarly 8573.59 Amu = 8272.33 Amu fragment − 5.04 Amu for 5 Hs + 306.3 Amu for oxidized glutathione).
📊 Figures
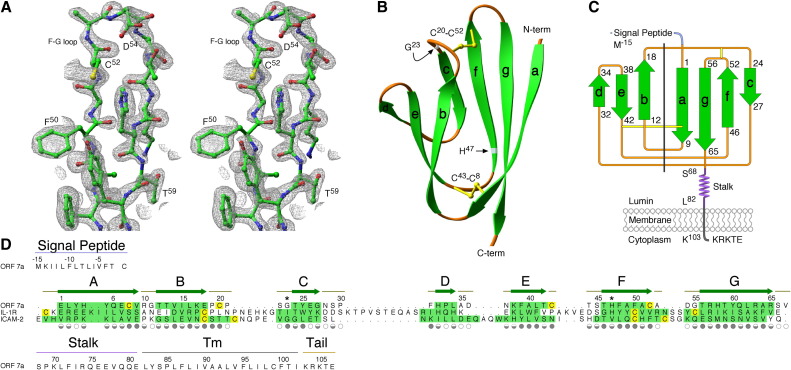
Figure 1
Three-Dimensional Structure of the Orf7a Luminal Domain (A) Stereoview of the 2F o u2212 F c electron density composite omit map shown as gray mesh with orf7a residues depicted as a ball-and-stick mod...
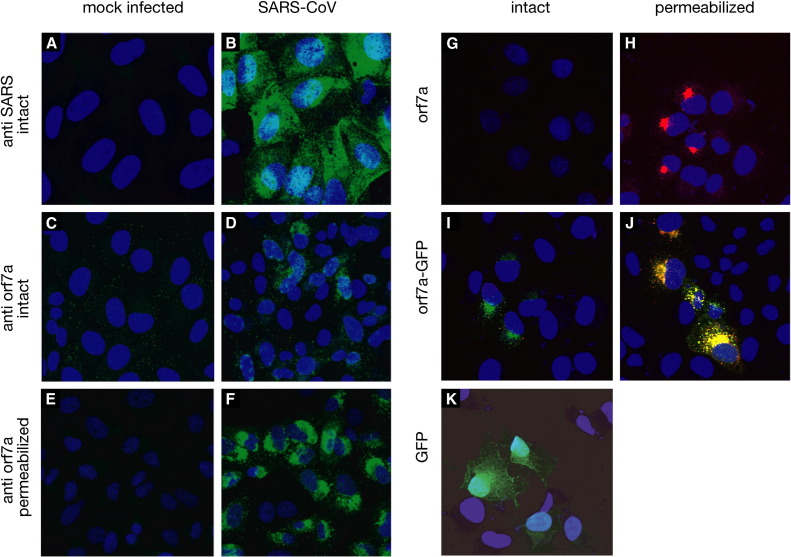
Figure 2
Intracellular Retention of Orf7a Vero cells were either mock infected ([A], [C], and [E]) or infected with SARS-CoV ([B], [D], and [F]) for 18 hr at an moi of 5. As expected, the spike protein was cle...
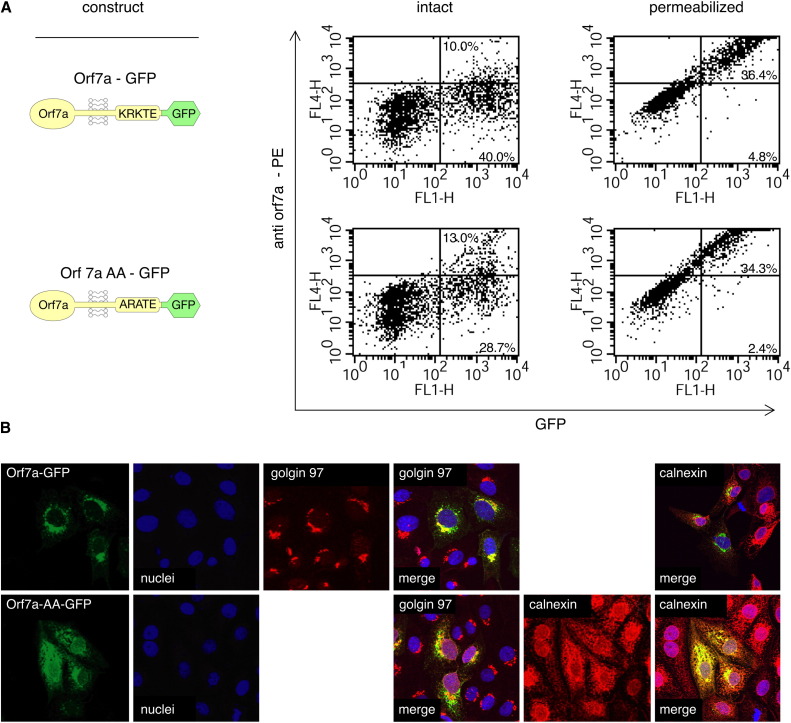
Figure 3
Intracellular Localization of Orf7a (A) Flow cytometry analysis of protein expression levels on 293T cell transfectants. Direct comparison of orf7a-GFP with its cytoplasmic tail mutant, orf7aAA-GFP, i...
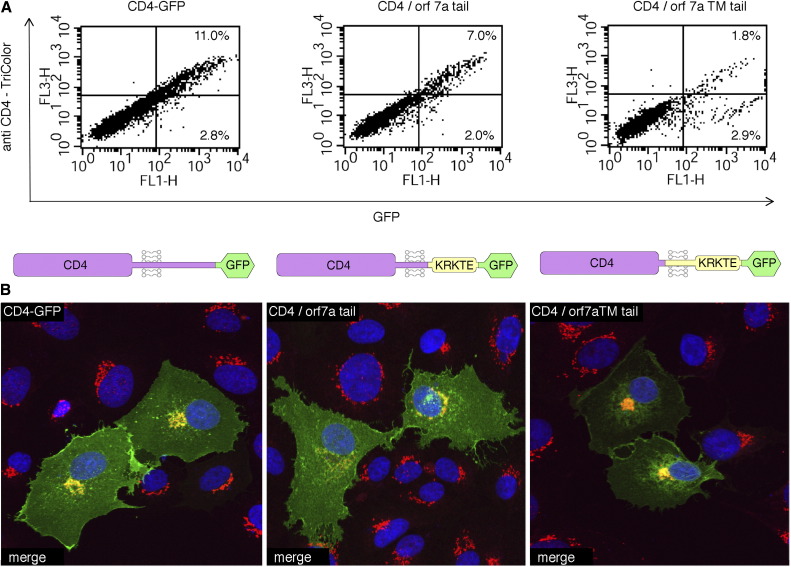
Figure 4
The Intracellular Retention Signal of Orf7a (A) The majority of the CD4-GFP control protein is seen at the plasma membrane by FACS analysis using intact 293T cells (left). This distribution did not ch...
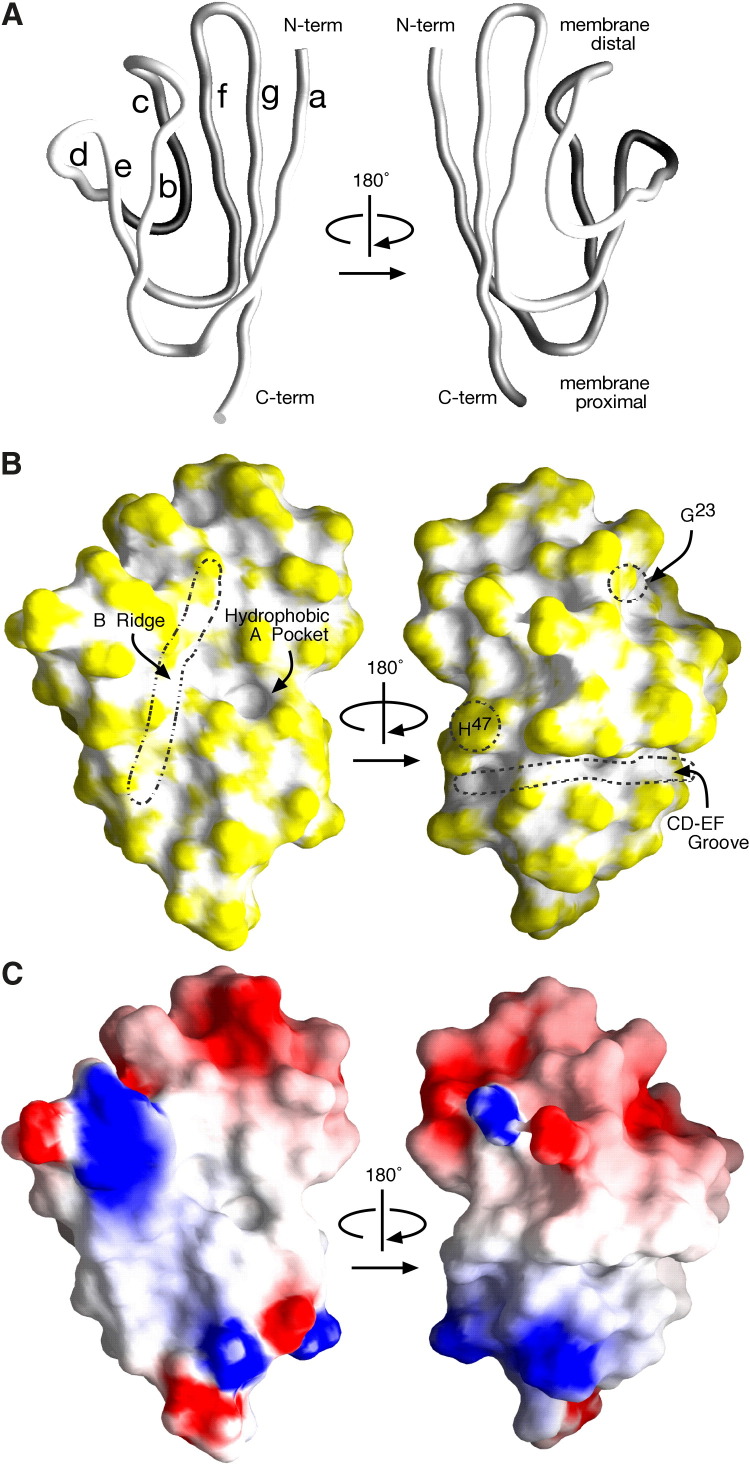
Figure 5
Surface Features of the Orf7a Luminal Domain (A) Backbone worm shown in the same orientation as Figure 1 B (right), and also the reverse orientation (left). (B) The molecular surface is shown color co...
Figure images are served from the NIH/NLM PubMed Central Open Access Subset or Europe PMC; copyright remains with the publishers and authors.
💬 Discussion
0 commentsNo comments yet. Be the first to start a discussion!
Leave a Comment