Abstract
AbstractPhotosystem I (PSI) functions to harvest light energy for conversion into chemical energy. The organisation of PSI is variable depending on the species of organism. Here we report the structure of a tetrameric PSI core isolated from a cyanobacterium, Anabaena sp. PCC 7120, analysed by single-particle cryo-electron microscopy (cryo-EM) at 3.3 Å resolution. The PSI tetramer has a C2 symmetry and is organised in a dimer of dimers form. The structure reveals interactions at the dimer-dimer interface and the existence of characteristic pigment orientations and inter-pigment distances within the dimer units that are important for unique excitation energy transfer. In particular, characteristic residues of PsaL are identified to be responsible for the formation of the tetramer. Time-resolved fluorescence analyses showed that the PSI tetramer has an enhanced excitation-energy quenching. These structural and spectroscopic findings provide insights into the physiological significance of the PSI tetramer and evolutionary changes of the PSI organisations.
🔬 Techniques
🏭 Microscope Brands
🧪 Reagent Suppliers
💻 Software Details
🏛️ Research Organizations (ROR)
Affiliated research institutions:
📋 Methods
Purification and characterisation of the PSI oligomers
The cyanobacterium Anabaena sp. PCC 7120 was grown in BG11 medium supplemented with 10 mM HEPES-KOH (pH 8.0) at a PPFD of 30 µmol photons m −2 s −1 at 30 °C with bubbling of air containing 3% (v/v) CO 2 . Thylakoid membranes were prepared after disruption of the cells by agitation with glass beads on ice in the dark 22 and suspended in a buffer containing 0.2 M trehalose, 20 mM MES-NaOH (pH 6.5), 5 mM CaCl 2 and 10 mM MgCl 2 (buffer A). The thylakoids were solubilised with 1% (w/v) n -dodecyl- β -D-maltoside ( β -DDM) at a Chl concentration of 1 mg mL −1 for 30 min on ice in the dark with gentle stirring. After centrifugation at 20,000 × g for 20 min at 4 °C, the resultant supernatant was loaded onto a Q-sepharose anion-exchange column (2.5 cm of inner diameter and 10 cm of length) equilibrated with buffer A containing 0.01% β -DDM (buffer B). The column was washed with a buffer containing 100 mM NaCl until the eluate became colourless, followed by elution with a 100–300 mM NaCl linear gradient at a flow rate of 2.0 mL min −1 (total volume 400 mL). Three distinct peaks were eluted by the NaCl gradient in which, the first, second and third peaks were enriched in the PSI monomers, dimers and tetramers, respectively. Each PSI fraction was loaded onto a linear trehalose gradient of 10–40% (w/v) in a medium containing 20 mM MES-NaOH (pH 6.5), 5 mM CaCl 2 , 10 mM MgCl 2 and 0.01% β -DDM. After centrifugation at 152,000 × g for 18 h at 4 °C (P40ST rotor; Hitachi, Japan), fractions of the PSI tetramer, dimer and monomer were obtained and then concentrated using a 100 kDa cut-off filter (Amicon Ultra; Millipore, USA) at 4000 × g . The concentrated PSI core complexes were stored in liquid nitrogen until use. The three PSI cores were characterised biochemically and spectroscopically. Subunit composition of the PSI was analysed by a 16% SDS-PAGE containing 7.5 M urea according to the method reported previously 23 (Supplementary Fig. 1a ). The samples (2 µg of Chl) were incubated for 10 min at 60 °C after the addition of 3% lithium lauryl sulfate and 75 mM dithiothreitol. A standard molecular weight marker (Precision Plus Protein Standards Dual Color, BioRad) was used. The subunit bands separated were assigned based on a previous study 14 . Clear native (CN)-PAGE was performed using a 3–8% polyacrylamide gel as described previously 24 , and 2 µg Chl of each PSI sample was loaded in each lane (Supplementary Fig. 1b ) together with a molecular marker (NativeMark Unstained Protein Standard; Invitrogen). Absorption spectra of the PSI cores were measured at 77 K using a spectrometer equipped with an integrating sphere unit (V-650/ISVC-747, JASCO, Japan) 25 (Supplementary Fig. 1c ), and their steady-state fluorescence spectra were recorded at 77 K using a spectrofluorometer equipped with an integrating sphere unit (FP-6600/ILFC-543L, JASCO) 26 (Supplementary Fig. 1d ). The TRF spectra were recorded at 77 K by a time-correlated single-photon counting system with a wavelength interval of 1 nm/channel and a time interval of 2.44 ps/channel 27 . A picosecond pulse diode laser (PiL044X; Advanced Laser Diode Systems, Germany) operated at 445 nm with a repetition rate of 3 MHz was used as the excitation source. Pigment compositions were analysed using a Shimadzu HPLC comprising LC-20AD pumps and a SPD-M20A detector equipped with a reversed phase Inertsil C8 column (GL Sciences, Japan) 28 , and the elution profile was monitored at 440 nm (Supplementary Fig. 1e ).
Show full methods section
Purification and characterisation of the PSI oligomers
The cyanobacterium Anabaena sp. PCC 7120 was grown in BG11 medium supplemented with 10 mM HEPES-KOH (pH 8.0) at a PPFD of 30 µmol photons m −2 s −1 at 30 °C with bubbling of air containing 3% (v/v) CO 2 . Thylakoid membranes were prepared after disruption of the cells by agitation with glass beads on ice in the dark 22 and suspended in a buffer containing 0.2 M trehalose, 20 mM MES-NaOH (pH 6.5), 5 mM CaCl 2 and 10 mM MgCl 2 (buffer A). The thylakoids were solubilised with 1% (w/v) n -dodecyl- β -D-maltoside ( β -DDM) at a Chl concentration of 1 mg mL −1 for 30 min on ice in the dark with gentle stirring. After centrifugation at 20,000 × g for 20 min at 4 °C, the resultant supernatant was loaded onto a Q-sepharose anion-exchange column (2.5 cm of inner diameter and 10 cm of length) equilibrated with buffer A containing 0.01% β -DDM (buffer B). The column was washed with a buffer containing 100 mM NaCl until the eluate became colourless, followed by elution with a 100–300 mM NaCl linear gradient at a flow rate of 2.0 mL min −1 (total volume 400 mL). Three distinct peaks were eluted by the NaCl gradient in which, the first, second and third peaks were enriched in the PSI monomers, dimers and tetramers, respectively. Each PSI fraction was loaded onto a linear trehalose gradient of 10–40% (w/v) in a medium containing 20 mM MES-NaOH (pH 6.5), 5 mM CaCl 2 , 10 mM MgCl 2 and 0.01% β -DDM. After centrifugation at 152,000 × g for 18 h at 4 °C (P40ST rotor; Hitachi, Japan), fractions of the PSI tetramer, dimer and monomer were obtained and then concentrated using a 100 kDa cut-off filter (Amicon Ultra; Millipore, USA) at 4000 × g . The concentrated PSI core complexes were stored in liquid nitrogen until use. The three PSI cores were characterised biochemically and spectroscopically. Subunit composition of the PSI was analysed by a 16% SDS-PAGE containing 7.5 M urea according to the method reported previously 23 (Supplementary Fig. 1a ). The samples (2 µg of Chl) were incubated for 10 min at 60 °C after the addition of 3% lithium lauryl sulfate and 75 mM dithiothreitol. A standard molecular weight marker (Precision Plus Protein Standards Dual Color, BioRad) was used. The subunit bands separated were assigned based on a previous study 14 . Clear native (CN)-PAGE was performed using a 3–8% polyacrylamide gel as described previously 24 , and 2 µg Chl of each PSI sample was loaded in each lane (Supplementary Fig. 1b ) together with a molecular marker (NativeMark Unstained Protein Standard; Invitrogen). Absorption spectra of the PSI cores were measured at 77 K using a spectrometer equipped with an integrating sphere unit (V-650/ISVC-747, JASCO, Japan) 25 (Supplementary Fig. 1c ), and their steady-state fluorescence spectra were recorded at 77 K using a spectrofluorometer equipped with an integrating sphere unit (FP-6600/ILFC-543L, JASCO) 26 (Supplementary Fig. 1d ). The TRF spectra were recorded at 77 K by a time-correlated single-photon counting system with a wavelength interval of 1 nm/channel and a time interval of 2.44 ps/channel 27 . A picosecond pulse diode laser (PiL044X; Advanced Laser Diode Systems, Germany) operated at 445 nm with a repetition rate of 3 MHz was used as the excitation source. Pigment compositions were analysed using a Shimadzu HPLC comprising LC-20AD pumps and a SPD-M20A detector equipped with a reversed phase Inertsil C8 column (GL Sciences, Japan) 28 , and the elution profile was monitored at 440 nm (Supplementary Fig. 1e ).
Cryo-EM data collection
For cryo-EM experiments, 3-μL aliquots of the tetrameric PSI supercomplexes (14 μg Chl mL −1 ) in a buffer containing 20 mM MES-NaOH (pH 6.5), 5 mM MgCl 2 , 5 mM CaCl 2 and 0.04% (w/v) β-DDM were applied to Quantifoil R2/1, Mo 300 mesh grids covered with 5–10 nm amorphous carbon film. The grids were incubated for 30 s and then washed once with a washing buffer without treharose [20 mM HEPES (pH 7.0) and 0.04% (w/v) β-DDM] in a chamber of an FEI Vitrobot Mark IV at 4 °C and 100% humidity. The washed grids were immediately plunged into liquid ethane cooled by liquid nitrogen and then transferred into a cryo-electron microscope (Titan Krios, Thermo Fischer Scientific) equipped with a field emission gun, a Cs corrector (CEOS GmbH), a Volta phase plate, and a direct electron detection camera (Falcon 3EC, Thermo Fischer Scientific). The microscope was operated at 300 kV and a nominal magnification of 59,000. Approximately 5,000 Volta phase contrast movies were recorded using the Falcon 3EC detector in a linear mode with a pixel size of 1.12 Å and a total electron dose of 40 electrons Å −2 . Each exposure of 2.0 s was dose-fractionated into 26 movie frames. The nominal defocus range was −0.6 to −0.8 μm.
Cryo-EM image processing
The movie frames obtained were aligned and summed using the MotionCor2 software 29 to obtain a dose weighted image.
Estimation of the contrast transfer function
(CTF) including additional phase shift by the Volta phase plate was performed using the GCTF program 30 . All of the following processes were performed using the program RELION 31 . For structural analyses of the PSI tetramer, 1,853,015 particles were automatically picked from 5,060 micrographs and then used for reference-free 2D classification. For structural analysis of the PSI tetramer, in total, 405,731 particles were selected from good 2D classes and subsequently subjected to 3D classification without imposing any symmetry. The initial model for the first 3D classification was generated de novo from 2D classification. As shown in the Supplementary Fig. 8d , the PSI tetramer structure was reconstructed from 111,400 particles at an overall resolution of 3.3 Å. Some particles from the cryo-EM images were found to be in a dimeric form, so they were subjected to 2D classifications separately. In total 164,700 particles of such PSI dimers were selected from good 2D classes and subsequently subjected to 3D classification without imposing any symmetry. The initial model for the first 3D classification was generated de novo from the 2D classification, and the final PSI dimer structure was reconstructed from 117,137 particles at an overall resolution of 4.0 Å (Supplementary Fig. 8d ). All of the resolution was estimated by the golden FSC curve with a cut-off value of 0.143 (Supplementary Fig. 2 ) 32 . Local resolutions were estimated using Resmap 33 (Supplementary Fig. 2 ). Model building and refinement The 3.3-Å cryo-EM map was used for model building of the PSI tetramer. First, the crystal structure of T. elongatus PSI (TePSI, PDB codes: 1JB0) was manually fitted into the 3.3-Å cryo-EM map using UCSF Chimera 34 , and then inspected and adjusted individually with Coot 35 . The amino acid sequences of the T. elongatus PSI structural model was then mutated to its counterparts from Anabaena sp . PCC 7120. The complete PSI tetramer structure was then refined with phenix.real_space_refine 36 with geometric restraints for the protein–cofactor coordination. For structural analysis of the PSI dimer, PSI A/B-dimer within the tetramer was manually fitted into the 4.0-Å cryo-EM map using UCSF Chimera. The final model was further validated with MolProbity 37 and EMringer 38 . The structure of the PSI dimer was identical with the PSI A/B-dimer in the tetramer. The statistics for all data collection and structure refinement are summarised in Supplementary Table 1 . Reporting summary Further information on research design is available in the Nature Research Reporting Summary linked to this article.
Supplementary information Supplementary Information Peer Review File Reporting Summary
📊 Figures
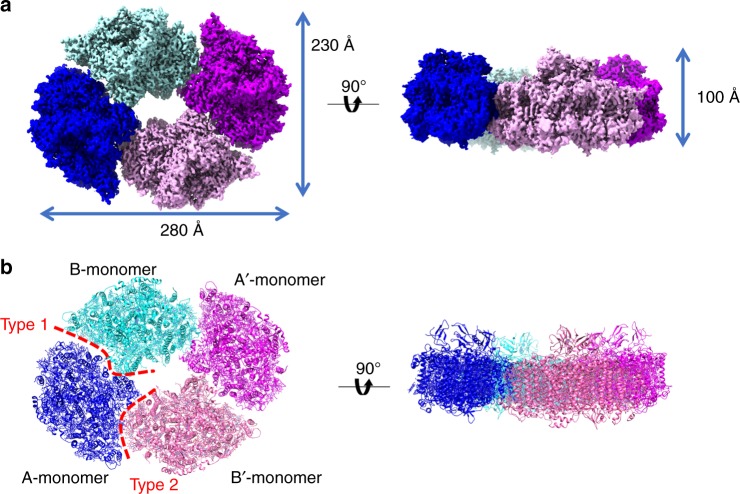
Fig. 1
Overall structure of the PSI tetramer. a The 3D cryo-EM density map of the PSI tetramer viewed along the membrane normal from the stromal side (Left) and its side view (Right). b The structure of the ...
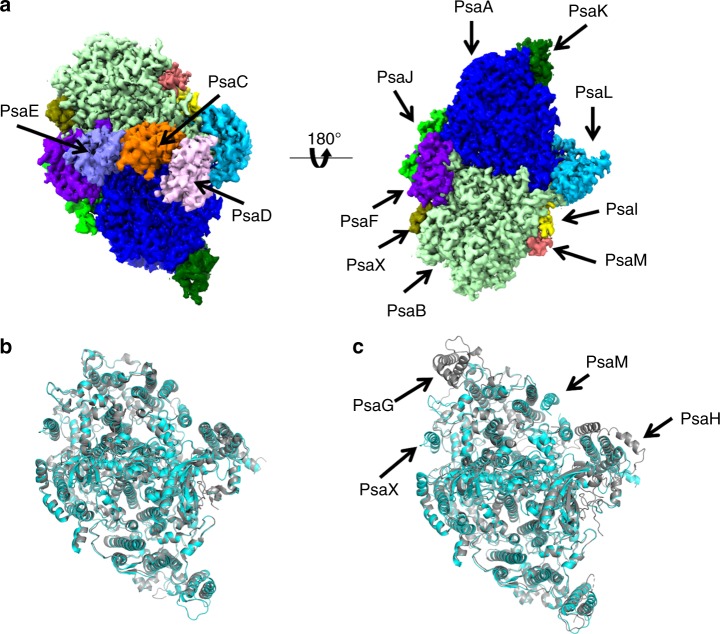
Fig. 2
Structure of a PSI monomer. a The 3D map of a PSI monomer viewed along the membrane normal from the stromal (Left) and lumenal sides (Right). b Superposition of an Anabaena PSI monomer (cyan) with a T...
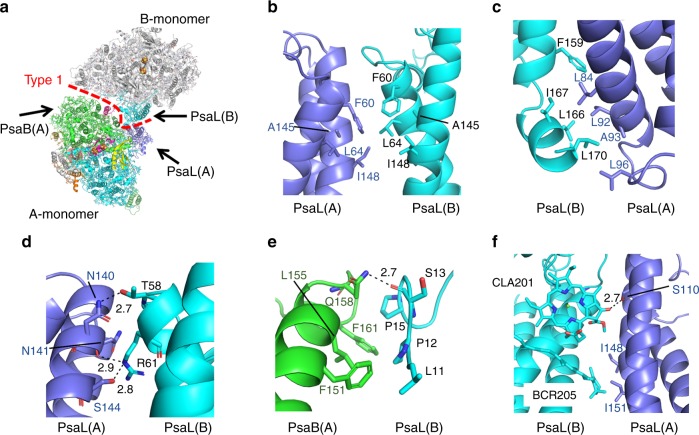
Fig. 3
Interactions at the Type 1 interface. a Structure of a dimer unit (dimer A-B) from a PSI tetramer viewed along the membrane normal from the stromal side. b u2013 d Interactions between PsaL (A) and Ps...
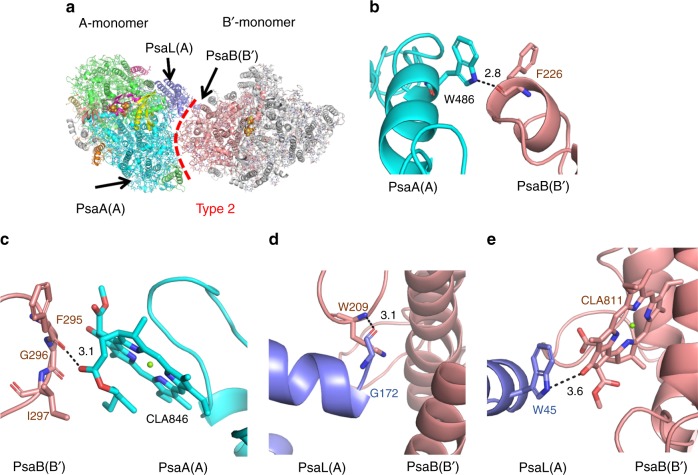
Fig. 4
Interactions at the Type 2 interface. a Structure of a dimer unit (dimer A-Bu2032) from a PSI tetramer viewed along the membrane normal from the stromal side. b , c Interactions between PsaA (A) and P...
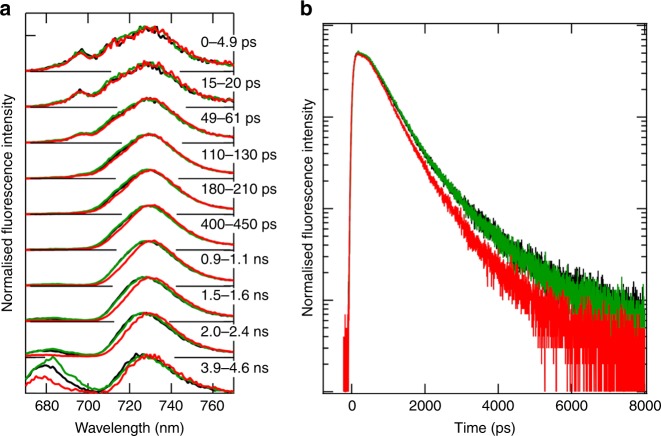
Fig. 5
TRF analyses of the PSI cores. a TRF spectra measured at 77u2009K excited at 445u2009nm. The spectra of the PSI tetramer, dimer and monomer are depicted in red, green and black, respectively, and were...
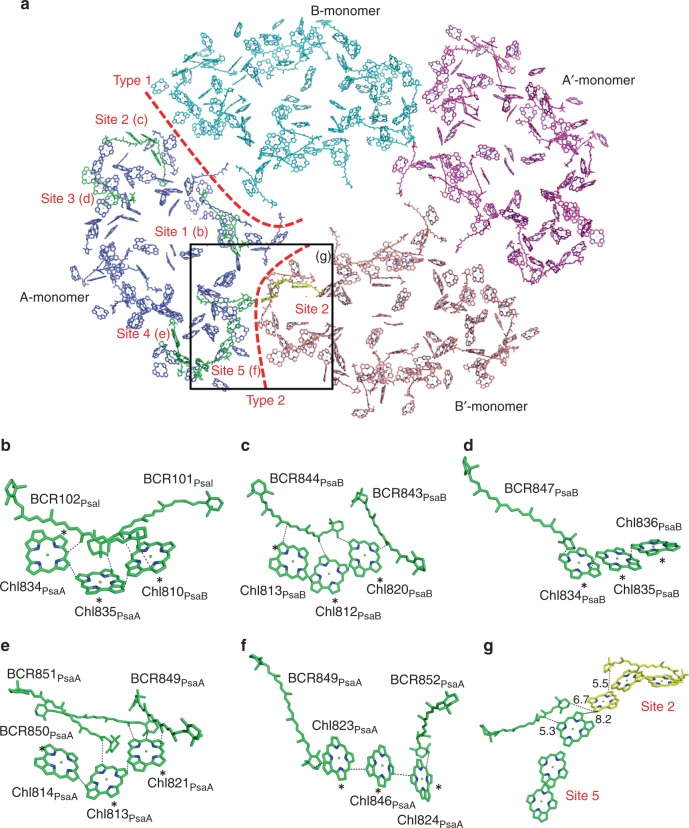
Fig. 6
Arrangement of pigments in the PSI tetramer and their interactions. a Arrangement of the pigments in the PSI tetramer viewed along the membrane normal from the stromal side. Pigments of the A-monomer,...
Figure images are served from the NIH/NLM PubMed Central Open Access Subset or Europe PMC; copyright remains with the publishers and authors.
💬 Discussion
0 commentsNo comments yet. Be the first to start a discussion!
Leave a Comment