Abstract
Cytochrome c oxidase (complex IV, CIV) is known in mammals to exist independently or in association with other respiratory proteins to form supercomplexes (SCs). In Saccharomyces cerevisiae, CIV is found solely in an SC with cytochrome bc1 (complex III, CIII). Here, we present the cryogenic electron microscopy (cryo-EM) structure of S. cerevisiae CIV in a III2IV2 SC at 3.3 Å resolution. While overall similarity to mammalian homologs is high, we found notable differences in the supernumerary subunits Cox26 and Cox13; the latter exhibits a unique arrangement that precludes CIV dimerization as seen in bovine. A conformational shift in the matrix domain of Cox5A-involved in allosteric inhibition by ATP-may arise from its association with CIII. The CIII-CIV arrangement highlights a conserved interaction interface of CIII, albeit one occupied by complex I in mammalian respirasomes. We discuss our findings in the context of the potential impact of SC formation on CIV regulation.
🔬 Techniques
🔭 Microscopes
🧬 Organisms
💻 Software
🧪 Sample Preparation
🏭 Microscope Brands
🧪 Reagent Suppliers
💻 Software Details
💾 Data Repositories
🏛️ Research Organizations (ROR)
Affiliated research institutions:
📋 Methods
Yeast strain and cell growth A Δ COX5B
S. cerevisiae strain only expressing the Cox5A isoform of CIV (α ade2 leu2 trp1 ura3 cox5B::KanMx4 ) with a six-histidine-tag at the C-terminus of COX13 was constructed from W303-1B 43 , 44 . Yeast cells were grown in YPGal (1% yeast extract, 2% peptone and 2% galactose) medium at 28°C in 2 L baffled flasks with shaking at 200 rpm as described in Meunier et al. 43 . Cells were harvested in late log phase by centrifugation at 6500 rpm for 5 minutes at 4°C. Cells were washed by resuspension in 50 mM KPi, pH 7.0, and centrifuged again. Cell pellets were stored at -80°C until use.
Preparation of mitochondrial membranes
Mitochondrial membranes were prepared essentially as described previously 43 . Briefly, thawed yeast cells were resuspended in 30 mL 650 mM D-mannitol, 50 mM KPi, 5 mM EDTA, pH 7.4 containing 0.1 mM PMSF. Glass beads (425-600 μm diameter) were added and cells were broken by mechanical lysis using a bead-beater cell disruptor. Cell debris was removed by centrifugation at 5600 × g for 20 minutes at 4°C, and the supernatant was centrifuged at 120,000 × g for 50 minutes at 4°C to harvest the mitochondrial membranes. The membranes were then resuspended and homogenised in 50 mM KPi, 100 mM KCl, 10 mM MgCl 2 , 150 μM CaCl 2 , 0.1 mM PMSF, pH 7.4, and centrifuged as in the previous step. The pellet was then washed by cycles of resuspension/centrifugation in 50 mM KPi, 2 mM EDTA, 0.1 mM PMSF, pH 7.4, until the measure of the absorbance of the supernatant at 260 nm was below 1. Finally, the membranes were resuspended in a minimal volume of 50 mM HEPES, pH 8.0, and stored at -80°C until use.
Show full methods section
Yeast strain and cell growth A Δ COX5B
S. cerevisiae strain only expressing the Cox5A isoform of CIV (α ade2 leu2 trp1 ura3 cox5B::KanMx4 ) with a six-histidine-tag at the C-terminus of COX13 was constructed from W303-1B 43 , 44 . Yeast cells were grown in YPGal (1% yeast extract, 2% peptone and 2% galactose) medium at 28°C in 2 L baffled flasks with shaking at 200 rpm as described in Meunier et al. 43 . Cells were harvested in late log phase by centrifugation at 6500 rpm for 5 minutes at 4°C. Cells were washed by resuspension in 50 mM KPi, pH 7.0, and centrifuged again. Cell pellets were stored at -80°C until use.
Preparation of mitochondrial membranes
Mitochondrial membranes were prepared essentially as described previously 43 . Briefly, thawed yeast cells were resuspended in 30 mL 650 mM D-mannitol, 50 mM KPi, 5 mM EDTA, pH 7.4 containing 0.1 mM PMSF. Glass beads (425-600 μm diameter) were added and cells were broken by mechanical lysis using a bead-beater cell disruptor. Cell debris was removed by centrifugation at 5600 × g for 20 minutes at 4°C, and the supernatant was centrifuged at 120,000 × g for 50 minutes at 4°C to harvest the mitochondrial membranes. The membranes were then resuspended and homogenised in 50 mM KPi, 100 mM KCl, 10 mM MgCl 2 , 150 μM CaCl 2 , 0.1 mM PMSF, pH 7.4, and centrifuged as in the previous step. The pellet was then washed by cycles of resuspension/centrifugation in 50 mM KPi, 2 mM EDTA, 0.1 mM PMSF, pH 7.4, until the measure of the absorbance of the supernatant at 260 nm was below 1. Finally, the membranes were resuspended in a minimal volume of 50 mM HEPES, pH 8.0, and stored at -80°C until use.
Membrane solubilisation and SC purification
Membranes were diluted in 50 mM HEPES, 150 mM NaCl, 1 mM PMSF, pH 8.0 to a CIII concentration of 45 nM and protein complexes were solubilised for 1 hour on ice by the addition of 1% GDN (glyco-diosgenin, Anatrace). After solubilisation, 350 mM NaCl (to make 500 mM final) and 5 mM imidazole are added. Insoluble material was removed by centrifugation at 120,000 × g for 30 minutes at 4°C. Solubilised proteins were then loaded overnight in a cold room at a flow rate of approx. 0.6 mL/min using a peristaltic pump onto a 5 mL HisTrap HP column (GE Healthcare) previously equilibrated with 2 column volumes (CV) of 50 mM HEPES, 500 mM NaCl, 5 mM imidazole, 0.05% GDN, pH 8.0. After loading, the column was washed with 3 CV of 50 mM HEPES, 500 mM NaCl, 5 mM imidazole, 0.05% GDN, pH 8.0, and then with 5 CV of 50 mM HEPES, 150 mM NaCl, 0.05% GDN, 5 mM imidazole, pH 7.2. Bound proteins were eluted with 50 mM HEPES, 150 mM NaCl, 0.05% GDN, 100 mM imidazole, pH 7.2. The eluted proteins were concentrated by centrifugation using 100 kDa MWCO centrifugal concentrators (GE Healthcare). The resulting sample was then further purified by gel filtration, using an Äkta Pure 25 (GE Healthcare) operated at 4°C with UV detection at 280 nm and automated fraction collection, by loading on a Superose 6 Increase column (GE Healthcare) equilibrated with 50 mM HEPES, 150 mM KCl, 0.05% GDN, pH 7.2. Fractions containing SCs were pooled and concentrated as above, and reapplied once to the same column.
Analytical methods
Resulting fractions were then concentrated and analysed for haem content and purity using UV-visible difference spectroscopy and BN-PAGE. Final protein concentration was determined by the Pierce BCA protein assay (Thermo Scientific) as per the manufacturer’s protocol.
UV-visible difference spectroscopy
UV-visible difference spectra were recorded between 400 and 700 nm using a home built spectrophotometer. Protein samples were diluted as necessary in 50 mM HEPES, 0.1% UDM, pH 8.0. Spectra were measured from sodium dithionite reduced minus oxidised spectra, using absorption coefficients (Δ Ɛ ) of 26 mM -1 cm -1 (604-621 nm) and 28 mM -1 cm -1 (562-578 nm) for CIV and CIII respectively.
Gel electrophoresis
Protein samples for BN-PAGE analysis were mixed with BN-PAGE sample buffer (final concentration, 50 mM BisTris, 50 mM NaCl, 10% (w/v) glycerol, 0.001% Ponceau S, pH 7.2) as per the manufacturer’s instruction (Invitrogen). Pre-cast 3-12% BisTris gels (Novex) were used throughout, and run at 150 V for 90-120 minutes. The running buffer contained 50 mM BisTris, 50 mM Tricine, pH 6.8, and the cathode buffer was made by addition of 0.002% Coomassie G-250 to the running buffer. Gels were destained overnight using 10% (v/v) acetic acid, followed by multiple exchanges of water. Mass spectroscopy 50 µg protein of purified III 2 IV 2 SC sample were diluted 1:4 in reducing sample buffer consisting of 12% (w/v) SDS, 6% (v/v) β-mercaptoethanol, 30% (w/v) glycerol, 0.05% Coomassie blue G-250 (Serva), 150 mM Tris-HCl pH 7.0 and incubated for 15 min at 37°C. Samples were loaded onto a 10% Tricine-SDS polyacrylamide gel and the electrophoresis was performed according to Schägger 45 until the entire amount of protein entered into the gel (~30 min; 50 V). A molecular mass marker (Precision plus protein standards, dual colour, BioRad) was used to monitor the correct loading of proteins into the gel. Gel-spots containing SC III 2 IV 2 were cut and prepared for MS identification, following the in-gel trypsin digestion protocol described previously 46 . Tryptic peptides were separated by liquid chromatography and analysed by tandem mass spectrometry (LC-MS/MS) in a Q-Exactive 2.0 Orbitrap Mass Spectrometer equipped with an Easy nLC1000 nano-flow ultra-high pressure liquid chromatography system (Thermo Fisher Scientific). MS was run twice for each sample. MS raw data files were analysed using the MaxQuant software (v1.5.0.25) using the settings detailed in Guerrero-Castillo et al. 47 , except for the search against a compiled version of the S. cerevisiae protein database including the pig trypsin and other protein contaminants, such as human keratins.
Activity measurements
Steady-state oxygen consumption rates were measured using a Clark-type oxygen electrode (Oxygraph, Hansatech), operated at 25°C. Assays were conducted with purified protein at 15 nM, in 10 mM KPi, 50 mM KCl, pH 6.6, supplemented with 0.05% GDN, 500 units/mL SOD and 250 units/mL catalase. SC activity was measured in the presence and absence of 50 μM equine heart cytochrome c . The reaction was initiated by addition of 40 μM decylubiquinol. The reaction was stopped by addition of 1 mM KCN and the resulting rate was used as a baseline. Turnover numbers were calculated from linear fitting of the oxygen consumption rate using Origin (OriginLab, Northampton, MA) following the formula T.N. (e s -1 ) = O 2 consumption gradient (M.s -1 ) x 4 / [C c O] (M). The result presented is the average of four independent experiments (± standard deviation) from two independent protein preparations for cryo-EM. Cryo-electron microscopy Purified III 2 IV 2 SC (9 mg/mL total protein) was diluted 1:3 in 50 mM HEPES, 150 mM NaCl, 0.05 % GDN, pH 7.2 and applied to glow discharged UltrAuFoil R1.2/1.3 grids (Quantifoil). Grids were blotted for 8.5 seconds at 4°C and 100% humidity, and then rapidly frozen in liquid ethane using a Vitrobot Mark IV (Thermo Fisher) and stored in liquid nitrogen. Preliminary imaging was done using a Polara microscope operated at 300 kV and equipped with a Quantum energy filter (Gatan) with a post-GIF K2 Summit direct electron detector (Gatan) operating in counting mode. The primary data were collected using a Titan Krios microscope (Thermo Fisher) operated at 300 kV and equipped with a Quantum energy filter (Gatan) (electron Bio-Imaging Centre, Diamond Light Source, Oxfordshire, UK). The images were collected with a post-GIF K2 Summit direct electron detector (Gatan) operating in counting mode at a nominal magnification of 130,000x, corresponding to the pixel size of 1.048 Å. An energy slit with a width of 20 eV was used during data collection. The dose rate on the specimen was set to 6.58 electrons per Å 2 per s and a total dose of 52.64 e/Å 2 was fractionated over 32 frames. Data were collected using EPU software (Thermo Fisher) with a nominal defocus range set from -1.6 μm to -3.6 μm. A total of 2740 micrographs were collected.
Image processing
Frame alignment and exposure weighting were performed with MOTIONCOR2 48 . Contrast transfer function parameters of the motion-corrected micrographs were estimated with CTFFIND4.1 49 . Micrographs were screened manually to remove those with excessive specimen drift, overfocus or ice defects. 98,968 particles were selected from the 2634 remaining micrographs using reference-free particle picking with Gautomatch v0.53 (written by Dr Kai Zhang, https://www.mrc-lmb.cam.ac.uk/kzhang/Gautomatch/ ), using a 360×360 Å 2 box size. Particles were sorted using several iterations of reference-free 2D classification in cryoSPARC 50 , resulting in a final particle number of 52,257. An initial model was build using ab-initio reconstruction in cryoSPARC, which was refined using heterogeneous refinement in RELION v3.0 51 . The III 2 IV 2 SC accounted for 44,915 (86%) of the particles present (14% represented the III 2 IV 1 supercomplex), and these particles were then used for homogeneous refinement in RELION v3.0 resulting in a 3.31 Å resolution map, based on the FSC-gold standard. Local resolution was calculated using ResMap 52 , revealing a range of resolutions in the map, with the core of CIII resolved to 2.9-3.2 Å, whereas the peripheral edges of the two CIV proteins were resolved to 5-8 Å. To increase the resolution of the two CIV monomers, we used a particle subtraction approach 20 . In short, a soft mask was generated around III 2 IV b and used to subtract density from the particles, resulting in a new set of particles which was used for focussed 3D refinement of CIVa. This process was repeated with a soft mask around III 2 IV a to refine CIVb. This resulted in an increased resolution of the two CIV monomers to 3.31 Å and 3.38 Å, with a homogeneous distribution of resolution throughout the protein ( Supplementary Fig. 2 ). The two CIV maps were then aligned to the original map of the SC and a merged map was generated using UCSF Chimera 53 . Model building The three individual maps described above were used for all model building using real space refinement ( Table 1 ) in Coot 54 . A high resolution crystal structure of dimeric CIII (PDB 1KYO) 55 , and a yeast homology model 22 were used as starting references for model building. All maps displayed clearly interpretable features such as bulky side chains, metal clusters, haem ligands, cardiolipin and ubiquinone. These features enabled unambiguous assignment of amino-acids in all chains, except some flexible N- and C-termini. Notably, the C-terminus of Rip1 of CIII has weak density (residues 95-215), and this is attributed to its characteristic flexibility. Its Fe-S cluster is clearly visible in the map. Finally, the N-terminal residues of Qcr6 (1-73) in CIII, are not resolved, a feature common to all yeast CIII crystal structures, possibly due to the high composition of charged residues in this region. Additional densities in the map indicated the presence of long carbon chains which were modelled as di-palmitoyl-phosphatidylethanolamine (PEF), diacyl-glycero-phosphocholine (PCF) and cardiolipin (CDL) molecules based on map interpretation and similarities with previous structures where these ligands were found. Lipid tails were truncated according to the density maps. The three models (dimeric CIII, and two CIV monomers) where then individually refined using the real space refine tool in Phenix 56 , using secondary structure restraints. Geometry definitions for the ligands were defined from values in the CCP 4 ligand library 57 . Additional bond and distance restraints were implemented on specific molecules based on previously published high resolution structures. For initial refinement in Phenix, Ramachandran and rotamer constraints were also used. The models were then visually inspected in Coot for additional corrections. A final real space refinement was performed in Phenix by disabling rotamer constrains resulting in an increase of the model-to-map fit. To confirm the validity of the map, a final real space refinement was performed to the complete III 2 IV 2 SC using the merged map described above. The final model contains 7,636 protein residues and 69 ligands. For the CIII dimer we modelled four B-haems and one ubiquinone molecule in the two cytochrome b subunits, one C-haem for each cytochrome c 1 subunit, one [2Fe-2S] iron-sulphur cluster for each Rip1 subunit, eight cardiolipin molecules, twelve PEF and six PCF molecules. For each CIV we modelled a haem a , haem a 3 and Cu B in Cox1 as well as one calcium and one magnesium ions. In Cox2 we modelled a dinuclear Cu A centre and in Cox4 one zinc ion. Each CIV contains additionally eight PEF molecules and one PCF molecule. Refinement and model statistics are summarized in Table 1 . Map and molecule representations in the figures were prepared by PyMOL ( https://pymol.org/ ) and UCSF Chimera.
Analytical methods
Resulting fractions were then concentrated and analysed for haem content and purity using UV-visible difference spectroscopy and BN-PAGE. Final protein concentration was determined by the Pierce BCA protein assay (Thermo Scientific) as per the manufacturer’s protocol.
UV-visible difference spectroscopy
UV-visible difference spectra were recorded between 400 and 700 nm using a home built spectrophotometer. Protein samples were diluted as necessary in 50 mM HEPES, 0.1% UDM, pH 8.0. Spectra were measured from sodium dithionite reduced minus oxidised spectra, using absorption coefficients (Δ Ɛ ) of 26 mM -1 cm -1 (604-621 nm) and 28 mM -1 cm -1 (562-578 nm) for CIV and CIII respectively.
Gel electrophoresis
Protein samples for BN-PAGE analysis were mixed with BN-PAGE sample buffer (final concentration, 50 mM BisTris, 50 mM NaCl, 10% (w/v) glycerol, 0.001% Ponceau S, pH 7.2) as per the manufacturer’s instruction (Invitrogen). Pre-cast 3-12% BisTris gels (Novex) were used throughout, and run at 150 V for 90-120 minutes. The running buffer contained 50 mM BisTris, 50 mM Tricine, pH 6.8, and the cathode buffer was made by addition of 0.002% Coomassie G-250 to the running buffer. Gels were destained overnight using 10% (v/v) acetic acid, followed by multiple exchanges of water.
Supplementary Material Supplementary Figures Supplementary Table 1
📊 Figures
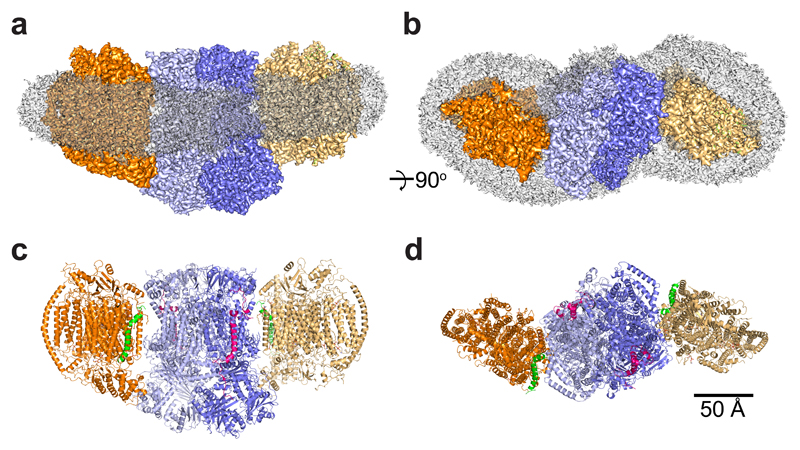
Fig. 1
Overall structure of the S. cerevisiae III 2 IV 2 supercomplex.
a , Side and top view of the III 2 IV 2 supercomplex (SC) merged cryo-EM map with overall SC dimensions of 289x157x114 u00c5. CIII and CIV are represented in blue and orange, each monomer being repres...
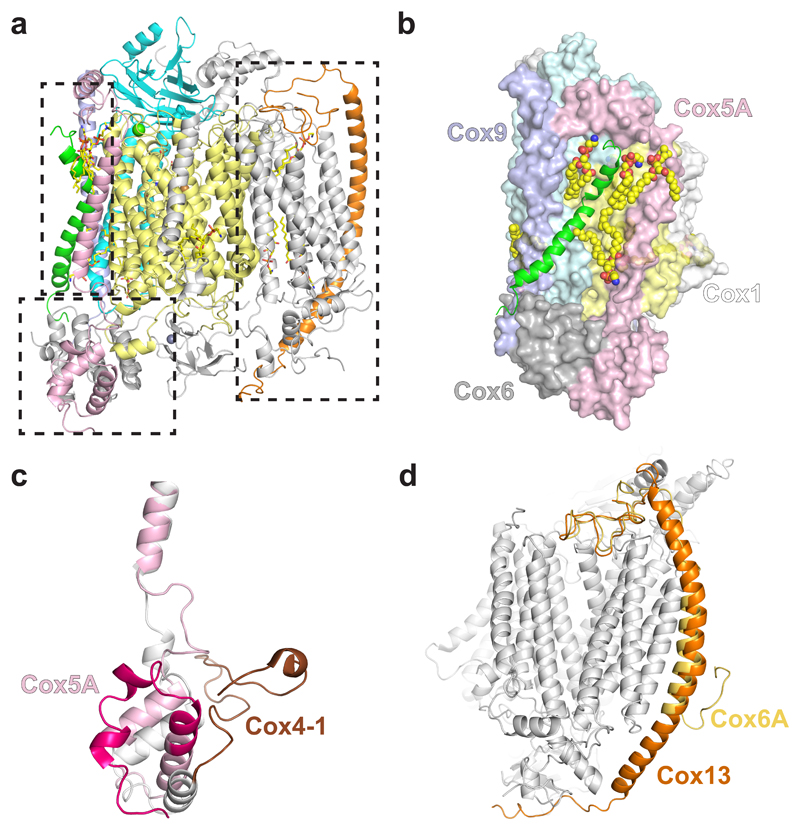
Fig. 2
Structure of S. cerevisiae CIV.
a , Atomic model of CIV showing all 12 subunits. Cox1 is shown in yellow, Cox2 in cyan, Cox5A in pink, Cox26 in green, Cox9 in purple and Cox13 in orange. b , Interactions of Cox26 with Cox1, Cox2, Co...
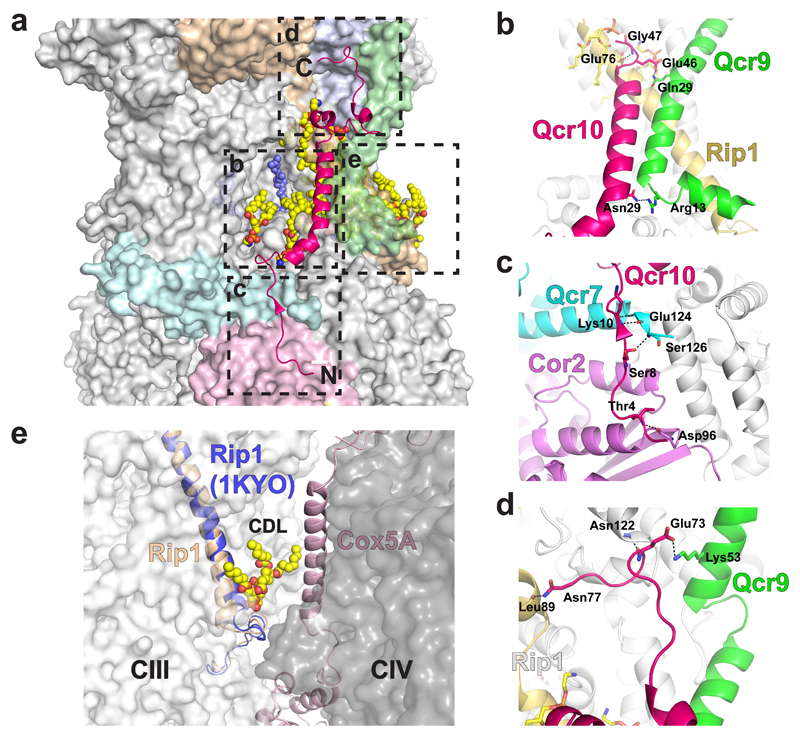
Fig. 3
Interactions of Qcr10 with other subunits of CIII, and that of Rip1 with a lipid at the interface with CIV.
a , Position of Qcr10 (pink ribbon) in the CIII structure with its N- and C-termini highlighted. Other subunits of CIII that interact with Qcr10 are highlighted in colours. A molecule of ubiquinone at...
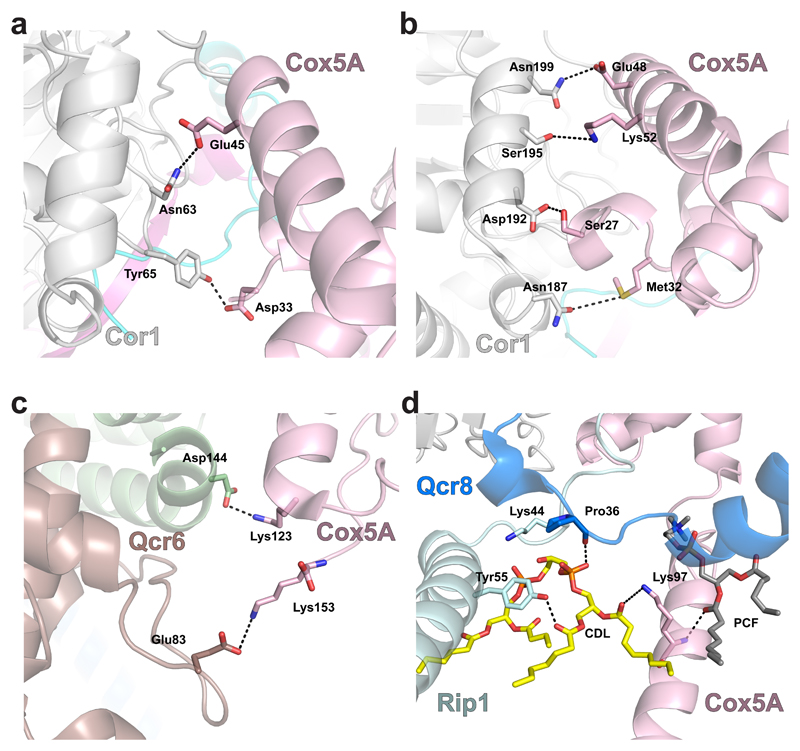
Fig. 4
Protein-protein interactions between CIV and CIII.
a and b , View from the matrix side of protein-protein interactions involving Cor1 (white) and Cox5A (pink). Residues that make inter-subunit interactions are indicated and their interactions are show...
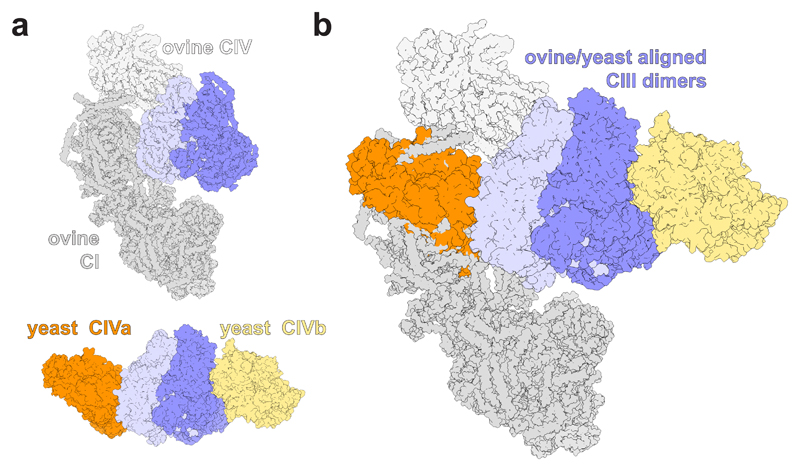
Fig. 5
Alignment of the mammalian I 1 III 2 IV 1 respirasome with the III 2 IV 2 SC from S. cerevisiae .
a , The structures of the tight ovine I 1 III 2 IV 1 respirasome 11 (PDB 5J4Z, displayed in shades of grey) and the yeast III 2 IV 2 SC (coloured as in Figure 1 ). b , These structures were aligned on...
Figure images are served from the NIH/NLM PubMed Central Open Access Subset or Europe PMC; copyright remains with the publishers and authors.
💬 Discussion
0 commentsNo comments yet. Be the first to start a discussion!
Leave a Comment