Abstract
AbstractPhotoacoustic microscopy (PAM) has become a premier microscopy tool that can provide the anatomical, functional, and molecular information of animals and humans in vivo. However, conventional PAM systems suffer from limited temporal and/or spatial resolution. Here, we present a fast PAM system and an agent-free localization method based on a stable and commercial galvanometer scanner with a custom-made scanning mirror (L-PAM-GS). This novel hardware implementation enhances the temporal resolution significantly while maintaining a high signal-to-noise ratio (SNR). These improvements allow us to photoacoustically and noninvasively observe the microvasculatures of small animals and humans in vivo. Furthermore, the functional hemodynamics, namely, the blood flow rate in the microvasculature, is successfully monitored and quantified in vivo. More importantly, thanks to the high SNR and fast B-mode rate (500 Hz), by localizing photoacoustic signals from captured red blood cells without any contrast agent, unresolved microvessels are clearly distinguished, and the spatial resolution is improved by a factor of 2.5 in vivo. L-PAM-GS has great potential in various fields, such as neurology, oncology, and pathology.
🔬 Techniques
💻 Software
🧪 Sample Preparation
🏭 Microscope Brands
💻 Software Details
🏛️ Research Organizations (ROR)
Affiliated research institutions:
📋 Methods
Fast agent-free localization photoacoustic microscopy with a galvanometer scanner (L-PAM-GS) Our L-PAM-GS system mainly consists of an illumination laser, trigger modules, signal acquisition parts, and scanning parts (Fig. 1a–c , and Supplementary Fig. S1 ). A 532-nm laser source with a PRR of 800 kHz (VPFL-G-10, Spectra-Physics, USA) is used to generate the PA signals. A multifunctional data acquisition board (DAQ, NI PCIe-6321, National Instruments, USA) sends trigger signals to the laser system to fire optical beams. The DAQ sends analog trigonal signals to a galvanometer scanner (GVS001, Thorlabs, USA) and a digital pulse train to a mechanical linear stage (L-406, Physik Instrumente LTD, UK) simultaneously to synchronize the scanning modules. The fired laser pulse is split into two beams by a beam splitter (CM1-BP108, Thorlabs, USA). One split beam strikes a photodiode (PDA36A-EC, Thorlabs, USA), and the other split beam proceeds to illuminate the sample. The current signal generated by the photodiode triggers a digitizer (ATS-9350, Alarzatech, USA), enabling the synchronization of signal acquisition after each laser pulse excitation. The sample beam is focused by an objective lens (LA1131-A, Thorlabs, USA) with a focal length of 50 mm. The objective lens is mounted in a zoom housing (SM1NR1, Thorlabs, USA), which adjusts the optical focal plane along the z-axis. The focused beam passes through an opto-acoustic combiner consisting of a correction lens (NT67-147, Edmund, USA), an aluminum-coated prism (MRA10-G01, Thorlabs, USA), an uncoated prism (PS910, Thorlabs, USA), and an acoustic lens (NT45-382, Edmund, USA) with an acoustic NA of 0.25. In the opto-acoustic combiner, the focused optical beam goes through the correction lens, which corrects optical aberration caused by the acoustic lens. The optical beam is reflected by the aluminum film placed between the two right-angle prisms, and the beam exits the combiner through the acoustic lens. Then, the beam is reflected by the galvanometer scanner mirror in a water tank and illuminates the sample. The mirror module and the acoustic lens of the opto-acoustic combiner are immersed in a water tank, and a window for light and acoustic transmission is sealed with a polyethylene membrane. The generated PA waves are focused by the acoustic lens, allowing the SNR to be further maximized. The focused wave is reflected by the mirror of the galvanometer scanner, travels through the combiner, and is detected by an ultrasound transducer (v214-BC-RM, 50-MHz center frequency, Olympus NDT, USA) with a −6 dB bandwidth of 82%. The signals are amplified by two serially connected amplifiers (ZX60-3018G-S+, Mini-Circuits, 26-dB gain, USA) and then converted into digital signals. The scanning components are made up of one galvanometer scanner, one motorized linear stage, and two manual translation stages (PT1/M, Thorlabs, USA) to achieve wide-FOV 3D volume imaging (Fig. 1a–c and Supplementary Fig. S1 ). Each 1D depth-resolved A-scan signal in this system is created by one laser pulse. The fast angular scanning of the galvanometer scanner along the x-axis and the slow linear scanning of the motorized stage along the y-axis accomplish raster scanning. A custom-made sample stage is attached to the motorized stage. Two manual translation stages, fixed below the motorized stage, move the position of the sample stage to take wide-FOV images and adjust the acoustic focus. The position of the sample stage can be moved along the x-axis by the manual stage to obtain the multiple segmented images. Simulation and fabrication of a mirror part of a galvanometer scanner First, we simulated the pressures applied to the mirror parts under oscillation in water according to their geometries (e.g., flat and half-cylindrical) using CFD simulation software (CFD 2019, Autodesk, USA) (Supplementary Fig. S3 and Supplementary Movie 1 ). The silver mirror part of the flat structure was designed with a width of 10 mm, a height of 8 mm, and a thickness of 1 mm, which mimics the original shape of the mirror in the galvanometer scanner. The half-cylindrical mirror part was designed with a diameter of 8.5 mm and a height of 8 mm and was made from acrylonitrile butadiene styrene copolymer material. Both mirror parts were set to oscillate at an angle of ±8.63° at a speed of 500 Hz. We specifically fabricated a new mirror part of the galvanometer scanner, which consists of an additional shaft and mirror (Supplementary Fig. S2 ). The new shaft was designed in the form of a half cylinder to minimize the drag in water. The mirror was made with a silicon wafer with a diameter of 10.2 cm. The wafer was coated with 100-nm-thick aluminum layer using an evaporator and then sliced with a grid pattern of 8.5 mm × 6 mm using a dicing saw. One piece of the sliced wafer was attached to the flat surface of the fabricated shaft with an instant adhesive. We replaced the built-in mirror part with the custom-made mirror. Photoacoustic imaging of animals in vivo All animal procedures in all experiments were permitted by the Institutional Animal Care and Use Committee of Pohang University of Science and Technology (POSTECH). All animal experiments were conducted according to the National Institutes of Health Guide for the Care and Use of Experimental Animals. Normal female Balb/c mice (16–30 g, 3–8 weeks old) were prepared for in vivo PA imaging. The mice were initially anesthetized with a 4% isoflurane gas vaporized by inhalation gas (1.0 L/min flow rate), and during imaging, anesthesia was maintained with 1% isoflurane. The mice were placed on a silicon-heating pad on the sample stage to maintain their body temperature during the experiment. To image an ear and eye of a mouse, the hair was removed with a depilatory. We applied ultrasound gel to match the acoustic impedance between animals and the polyethylene membrane. The laser pulse energy of 10 mJ/cm 2 used for the ear is within the American National Standards Institute (ANSI) safety limit of 20 mJ/cm 2 for visible light. We calculated the maximum permissible exposure (MPE) for ocular exposure with the ANSI safety standards ( Supplementary Materials and Methods ) 43 . The maximum permissible single laser pulse energy for a human pupil is 1.0 μJ and 365 nJ for single and multiple imaging, respectively, which are higher than the experimentally used pulse energy of 152 nJ. In imaging a mouse brain, the mouse’s scalp was removed, but the skull was left intact. After the scalp was removed, the vessels on the skull were carefully cleaned with saline solution to acquire the PA signals from only the brain vessels. Ultrasound gel was applied to the skull to prevent the brain tissue and skull from drying out and to match the acoustic impedance between the skull and the water tank. After the mouse was laid sideways on the sample stage, the head was fixed by the support to reduce the motion artifact. The laser energy used was 8.3 mJ/cm 2 . Photoacoustic imaging of a human finger in vivo Imaging of humans was conducted according to protocols approved by the Institutional Review Board of POSTECH. We recruited a subject and provided the subject with complete information regarding the study. The recruited subject signed consent documents to participate in the experiments. Although the used pulsed laser illumination energy of 2.4 mJ/cm 2 was less than the ANSI safety limit of 20 mJ/cm 2 , the participant wore protective equipment, protective glasses and heatproof clothes to protect their eyes and body against laser light beams. Before imaging a digitus annularis (ring finger), mineral oil was applied to moisten the fingertip, and then an ultrasonic gel was applied. The hand was fixed to the sample stage, and the finger coupled with the ultrasound gel was stuck onto the side of the sample stage. Other motions were prohibited during imaging to reduce motion artifacts. The scan-conversion algorithm was applied to all PA volume data, followed by a skin-removing algorithm to the converted data, to image the vasculature 40 . Localization photoacoustic microscopy in vivo Our localization process is divided into four main steps: (1) the fast acquisition of a sequence of PA volume data, (2) the precise alignment of the PA volume data, (3) the determinant of local maximum points in the volume data, and (4) the rendering of localization 2D or 3D models. In the in vivo localization imaging experiments, the same area of the mouse ear was imaged consecutively. First, a sequence of 3D volume data was aligned via the intensity-based image registration algorithm. The volume data were interpolated to a size of 4x by bicubic interpolation, and the interpolated data were then normalized. The 3D averaging filter was applied to the normalized data in the 3D volume to emphasize local maximum points, and the local maximum positions were then determined in MATLAB. By superimposing multiple positions in the 3D data, localization MAP and localization 3D volume images were reconstructed.
Show full methods section
Fast agent-free localization photoacoustic microscopy with a galvanometer scanner (L-PAM-GS) Our L-PAM-GS system mainly consists of an illumination laser, trigger modules, signal acquisition parts, and scanning parts (Fig. 1a–c , and Supplementary Fig. S1 ). A 532-nm laser source with a PRR of 800 kHz (VPFL-G-10, Spectra-Physics, USA) is used to generate the PA signals. A multifunctional data acquisition board (DAQ, NI PCIe-6321, National Instruments, USA) sends trigger signals to the laser system to fire optical beams. The DAQ sends analog trigonal signals to a galvanometer scanner (GVS001, Thorlabs, USA) and a digital pulse train to a mechanical linear stage (L-406, Physik Instrumente LTD, UK) simultaneously to synchronize the scanning modules. The fired laser pulse is split into two beams by a beam splitter (CM1-BP108, Thorlabs, USA). One split beam strikes a photodiode (PDA36A-EC, Thorlabs, USA), and the other split beam proceeds to illuminate the sample. The current signal generated by the photodiode triggers a digitizer (ATS-9350, Alarzatech, USA), enabling the synchronization of signal acquisition after each laser pulse excitation. The sample beam is focused by an objective lens (LA1131-A, Thorlabs, USA) with a focal length of 50 mm. The objective lens is mounted in a zoom housing (SM1NR1, Thorlabs, USA), which adjusts the optical focal plane along the z-axis. The focused beam passes through an opto-acoustic combiner consisting of a correction lens (NT67-147, Edmund, USA), an aluminum-coated prism (MRA10-G01, Thorlabs, USA), an uncoated prism (PS910, Thorlabs, USA), and an acoustic lens (NT45-382, Edmund, USA) with an acoustic NA of 0.25. In the opto-acoustic combiner, the focused optical beam goes through the correction lens, which corrects optical aberration caused by the acoustic lens. The optical beam is reflected by the aluminum film placed between the two right-angle prisms, and the beam exits the combiner through the acoustic lens. Then, the beam is reflected by the galvanometer scanner mirror in a water tank and illuminates the sample. The mirror module and the acoustic lens of the opto-acoustic combiner are immersed in a water tank, and a window for light and acoustic transmission is sealed with a polyethylene membrane. The generated PA waves are focused by the acoustic lens, allowing the SNR to be further maximized. The focused wave is reflected by the mirror of the galvanometer scanner, travels through the combiner, and is detected by an ultrasound transducer (v214-BC-RM, 50-MHz center frequency, Olympus NDT, USA) with a −6 dB bandwidth of 82%. The signals are amplified by two serially connected amplifiers (ZX60-3018G-S+, Mini-Circuits, 26-dB gain, USA) and then converted into digital signals. The scanning components are made up of one galvanometer scanner, one motorized linear stage, and two manual translation stages (PT1/M, Thorlabs, USA) to achieve wide-FOV 3D volume imaging (Fig. 1a–c and Supplementary Fig. S1 ). Each 1D depth-resolved A-scan signal in this system is created by one laser pulse. The fast angular scanning of the galvanometer scanner along the x-axis and the slow linear scanning of the motorized stage along the y-axis accomplish raster scanning. A custom-made sample stage is attached to the motorized stage. Two manual translation stages, fixed below the motorized stage, move the position of the sample stage to take wide-FOV images and adjust the acoustic focus. The position of the sample stage can be moved along the x-axis by the manual stage to obtain the multiple segmented images. Simulation and fabrication of a mirror part of a galvanometer scanner First, we simulated the pressures applied to the mirror parts under oscillation in water according to their geometries (e.g., flat and half-cylindrical) using CFD simulation software (CFD 2019, Autodesk, USA) (Supplementary Fig. S3 and Supplementary Movie 1 ). The silver mirror part of the flat structure was designed with a width of 10 mm, a height of 8 mm, and a thickness of 1 mm, which mimics the original shape of the mirror in the galvanometer scanner. The half-cylindrical mirror part was designed with a diameter of 8.5 mm and a height of 8 mm and was made from acrylonitrile butadiene styrene copolymer material. Both mirror parts were set to oscillate at an angle of ±8.63° at a speed of 500 Hz. We specifically fabricated a new mirror part of the galvanometer scanner, which consists of an additional shaft and mirror (Supplementary Fig. S2 ). The new shaft was designed in the form of a half cylinder to minimize the drag in water. The mirror was made with a silicon wafer with a diameter of 10.2 cm. The wafer was coated with 100-nm-thick aluminum layer using an evaporator and then sliced with a grid pattern of 8.5 mm × 6 mm using a dicing saw. One piece of the sliced wafer was attached to the flat surface of the fabricated shaft with an instant adhesive. We replaced the built-in mirror part with the custom-made mirror. Photoacoustic imaging of animals in vivo All animal procedures in all experiments were permitted by the Institutional Animal Care and Use Committee of Pohang University of Science and Technology (POSTECH). All animal experiments were conducted according to the National Institutes of Health Guide for the Care and Use of Experimental Animals. Normal female Balb/c mice (16–30 g, 3–8 weeks old) were prepared for in vivo PA imaging. The mice were initially anesthetized with a 4% isoflurane gas vaporized by inhalation gas (1.0 L/min flow rate), and during imaging, anesthesia was maintained with 1% isoflurane. The mice were placed on a silicon-heating pad on the sample stage to maintain their body temperature during the experiment. To image an ear and eye of a mouse, the hair was removed with a depilatory. We applied ultrasound gel to match the acoustic impedance between animals and the polyethylene membrane. The laser pulse energy of 10 mJ/cm 2 used for the ear is within the American National Standards Institute (ANSI) safety limit of 20 mJ/cm 2 for visible light. We calculated the maximum permissible exposure (MPE) for ocular exposure with the ANSI safety standards ( Supplementary Materials and Methods ) 43 . The maximum permissible single laser pulse energy for a human pupil is 1.0 μJ and 365 nJ for single and multiple imaging, respectively, which are higher than the experimentally used pulse energy of 152 nJ. In imaging a mouse brain, the mouse’s scalp was removed, but the skull was left intact. After the scalp was removed, the vessels on the skull were carefully cleaned with saline solution to acquire the PA signals from only the brain vessels. Ultrasound gel was applied to the skull to prevent the brain tissue and skull from drying out and to match the acoustic impedance between the skull and the water tank. After the mouse was laid sideways on the sample stage, the head was fixed by the support to reduce the motion artifact. The laser energy used was 8.3 mJ/cm 2 . Photoacoustic imaging of a human finger in vivo Imaging of humans was conducted according to protocols approved by the Institutional Review Board of POSTECH. We recruited a subject and provided the subject with complete information regarding the study. The recruited subject signed consent documents to participate in the experiments. Although the used pulsed laser illumination energy of 2.4 mJ/cm 2 was less than the ANSI safety limit of 20 mJ/cm 2 , the participant wore protective equipment, protective glasses and heatproof clothes to protect their eyes and body against laser light beams. Before imaging a digitus annularis (ring finger), mineral oil was applied to moisten the fingertip, and then an ultrasonic gel was applied. The hand was fixed to the sample stage, and the finger coupled with the ultrasound gel was stuck onto the side of the sample stage. Other motions were prohibited during imaging to reduce motion artifacts. The scan-conversion algorithm was applied to all PA volume data, followed by a skin-removing algorithm to the converted data, to image the vasculature 40 . Localization photoacoustic microscopy in vivo Our localization process is divided into four main steps: (1) the fast acquisition of a sequence of PA volume data, (2) the precise alignment of the PA volume data, (3) the determinant of local maximum points in the volume data, and (4) the rendering of localization 2D or 3D models. In the in vivo localization imaging experiments, the same area of the mouse ear was imaged consecutively. First, a sequence of 3D volume data was aligned via the intensity-based image registration algorithm. The volume data were interpolated to a size of 4x by bicubic interpolation, and the interpolated data were then normalized. The 3D averaging filter was applied to the normalized data in the 3D volume to emphasize local maximum points, and the local maximum positions were then determined in MATLAB. By superimposing multiple positions in the 3D data, localization MAP and localization 3D volume images were reconstructed.
Supplementary information Supplementary Information for Super-resolution Localization Photoacoustic Microscopy using Intrinsic Red Blood Cells as Contrast Absorbers Simulation video of pressures applied to the mirrors with flat and half cylindrical structures. Slow motion video of scanner movement in water. 3D PA images of human cuticles with and without skin signals. Hemodynamics in the mouse ear. Actual formation of the 2D localization PA MAP image. Actual formation of the 3D localization PA volume image. Rotation video of the 3D localization PA volume image.
📊 Figures
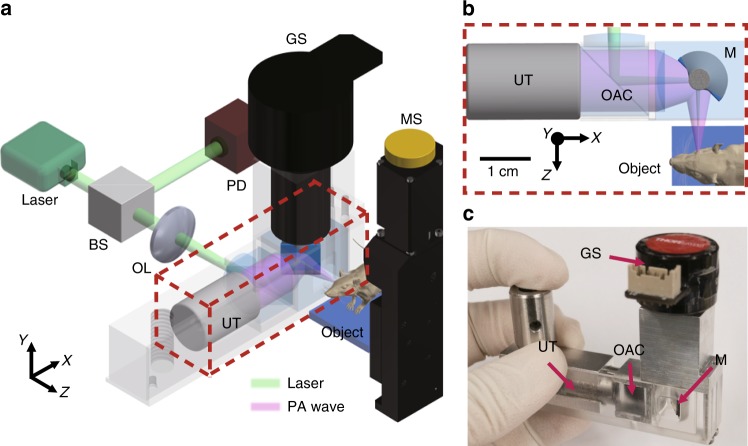
Fig. 1
Localization photoacoustic microscopy using a galvanometer scanner (L-PAM-GS).
a Configuration of the L-PAM-GS system. b Close-up view of the scanning part outlined by the red dashed box in a . c Photograph of the scanning part. BS, beam splitter; OL, objective lens; PD, photodi...
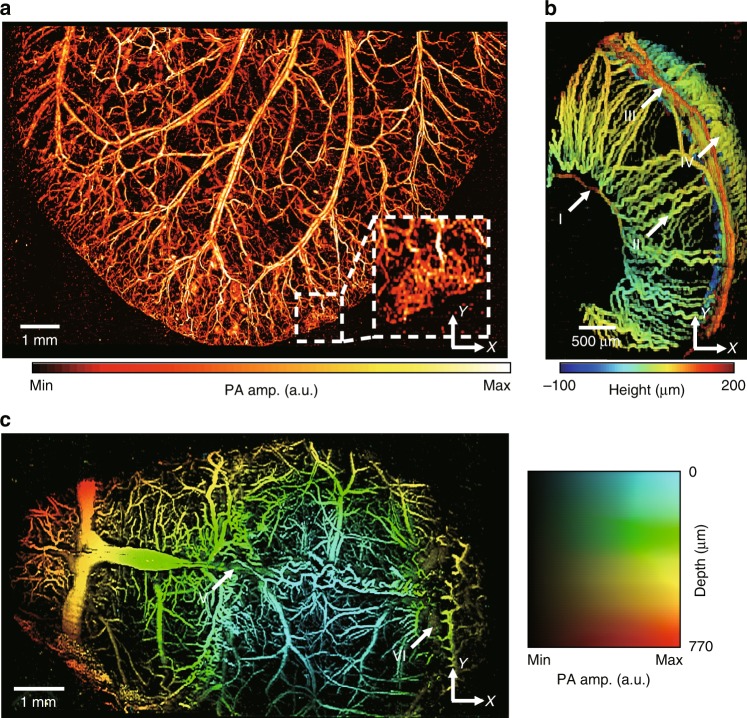
Fig. 2
Photoacoustic (PA) images of microvasculatures in small animals in vivo.
a Wide-FOV PA MAP image of a mouse ear. The region including a capillary bed is outlined by the white dashed box. b Depth-encoded PA image of a mouse eye. Circulus arteriosus major (I), iris (II), cir...
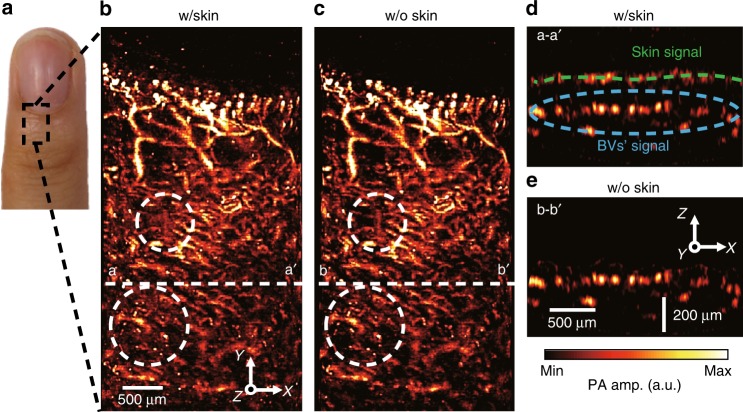
Fig. 3
Photoacoustic (PA) images of microvasculatures in humans in vivo.
a Photograph of a little finger of a volunteer. b PA MAP image of the region outlined by the black dashed box in a . c Skin-removed PA MAP image of b . After application to the skin-remover processing...
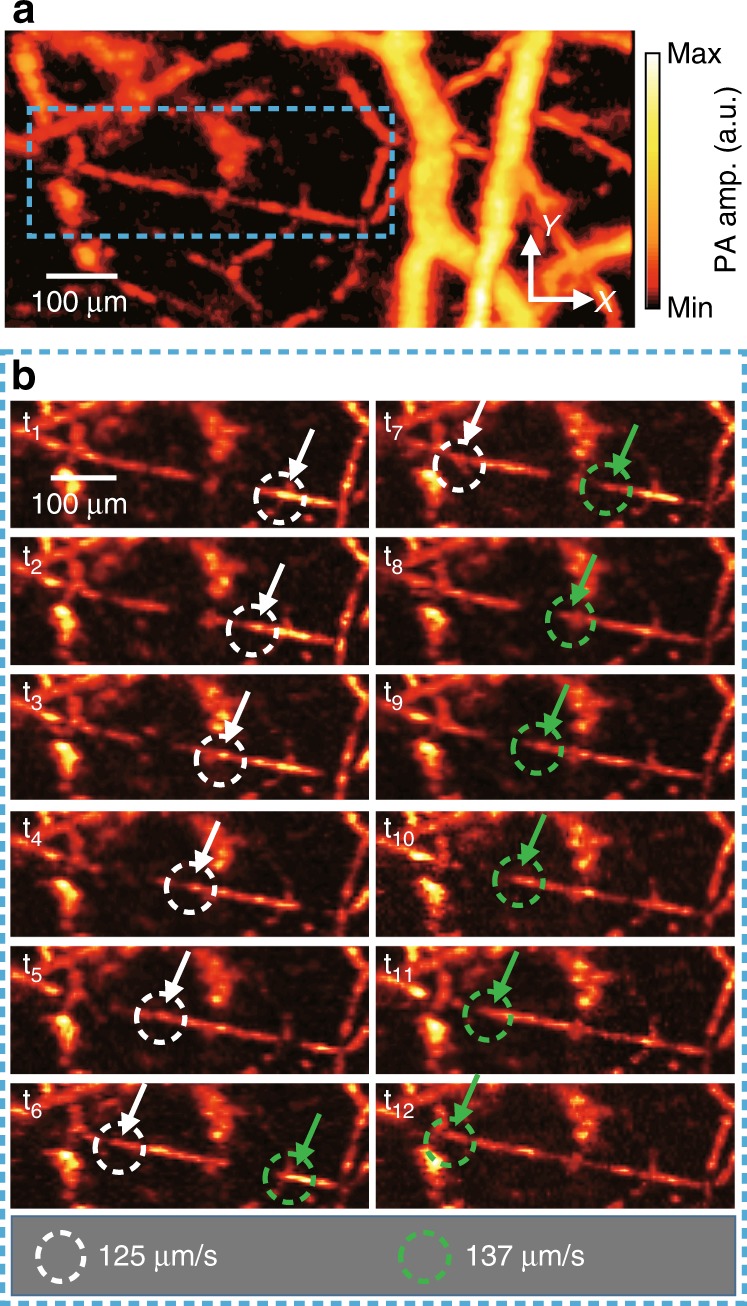
Fig. 4
Photoacoustic (PA) monitoring of hemodynamics in a mouse ear.
a Representative single-shot PA MAP image of the mouse ear. b Series of PA images over a time period showing the flow of RBCs (also see Supplementary Movie 4 ). Close-up views of the region are outlin...
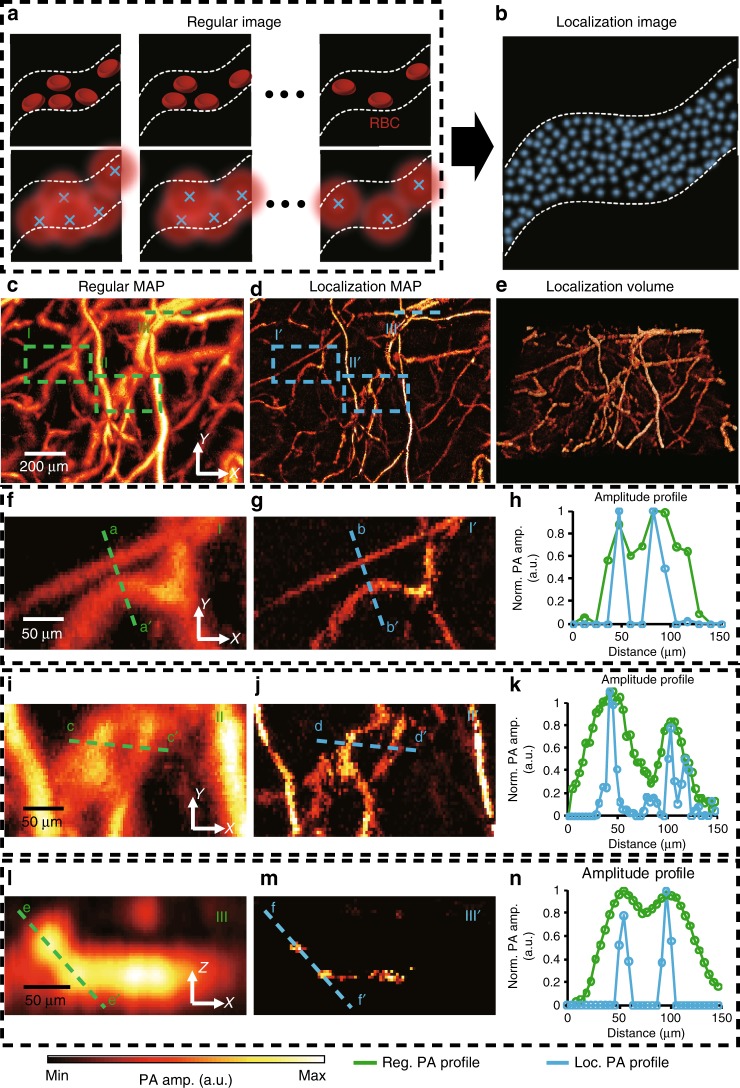
Fig. 5
Localization photoacoustic microscopy (PAM) of small animals in vivo.
a , b Principle of agent-free localization PAM. The PA signal from red blood cells is induced by imaging the same microvasculature multiple times. After the PA signals are localized, the localization ...
Figure images are served from the NIH/NLM PubMed Central Open Access Subset or Europe PMC; copyright remains with the publishers and authors.
💬 Discussion
0 commentsNo comments yet. Be the first to start a discussion!
Leave a Comment