Abstract
AbstractCeO2 nanoparticles have been proven to be competent photocatalysts for environmental applications because of their strong redox ability, nontoxicity, long‐term stability, and low cost. We have synthesized CeO2 nanoparticles via solution combustion method using ceric ammonium nitrate as an oxidizer and ethylenediaminetetraacetic acid (EDTA) as fuel at 450 °C. These nanoparticles exhibit good photocatalytic degradation and antibacterial activity. The obtained product was characterized by various techniques. X‐ray diffraction data confirms a cerianite structure: a cubic phase CeO2 having crystallite size of 35 nm. The infrared spectrum shows a strong band below 700 cm−1 due to the Ce−O−Ce stretching vibrations. The UV/Vis spectrum shows maximum absorption at 302 nm. The photoluminescence spectrum shows characteristic peaks of CeO2 nanoparticles. Scanning electron microscopy (SEM) images clearly show the presence of a porous network with a lot of voids. From transmission electron microscopy (TEM) images, it is clear that the particles are almost spherical, and the average size of the nanoparticles is found to be 42 nm. CeO2 nanoparticles exhibit photocatalytic activity against trypan blue at pH 10 in UV light, and the reaction follows pseudo first‐order kinetics. Finally, CeO2 nanoparticles also reduce CrVI to CrIII and show antibacterial activity against Pseudomonas aeruginosa.
🔬 Techniques
✨ Fluorophores
🏭 Microscope Brands
🧪 Reagent Suppliers
🏛️ Research Organizations (ROR)
Affiliated research institutions:
📋 Methods
Agar well diffusion method
The stock solution of CeO 2 nanoparticles was prepared by dispersing 2000 μg L −1 in sterile water and making further dilutions. Ciprofloxacin (500 μg L −1 in sterile water) was used as positive control and only sterile water was used as negative control. CeO 2 nanoparticles were screened using the agar well diffusion method on two different bacterial pathogens: Pseudomonas aeruginosa and Staphylococcus aureus . We maintained the positive standards concentration at 10 μg/50 mL, while varying that of CeO 2 nanoparticles from 500 μg/50 mL to 1000 μg/50 mL for both bacterial pathogens. The obtained experimental data (Table 2 ) clearly show that, as the concentration of CeO 2 nanoparticles increases, the zone of inhibition also increases in the case of P . aeruginosa . The other bacterial pathogen, S . aureus , did not show a zone of inhibition due to the incomplete dissolution of the compound (Figure 10 ). Table 2 Antibacterial activity of CeO 2 nanoparticles towards P. aeruginosa and S. aureus . Zone of inhibition (diameter) [mm] Group Treatment P. aeruginosa S. aureus I Ciprofloxacin (10 μg/50 μL) 14.17±0.17 13.17±0.44 II CeO 2 (500 μg/50 μL) 3.33±0.33 [ * * ] Not seen III CeO 2 (750 μg/50 μL) 3.57±0.17 [ * ] Not seen IV CeO 2 (1000 μg/50 μL) 4.50±0.29 [ * * ] Not seen Values represent the mean ±S.E. for n =3 replicates. [ * ] p
📊 Figures
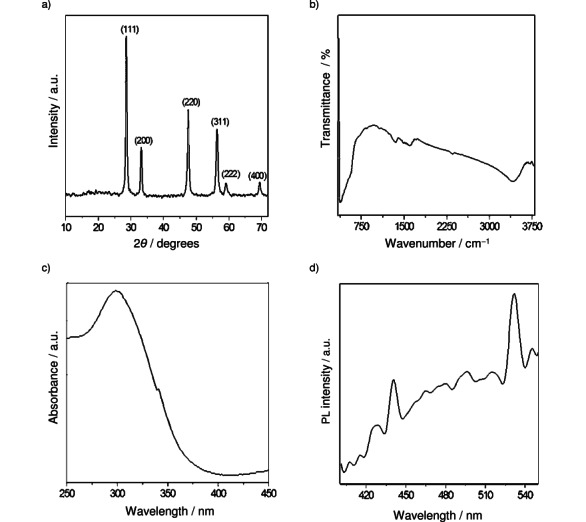
Figure 1
Characterization of CeO 2 nanoparticles prepared via solution combustion method. a)u2005 Powder XRD pattern; b)u2005 FTIR spectrum; c)u2005UV/Vis spectrum; d)u2005Phospholuminescence (PL) spectrum.
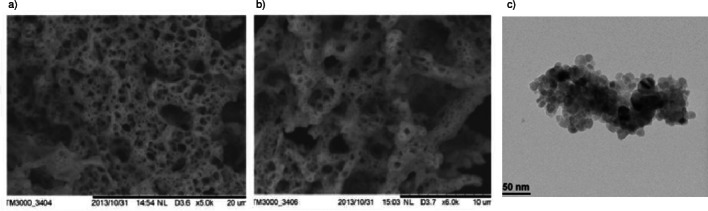
Figure 2
Microscopy images of CeO 2 nanoparticles prepared via solution combustion method. a)u2005SEM image (Scale bar: 20u2005u03bcm); b)u2005SEM image (Scale bar: 10u2005u03bcm.); c)u2005TEM image.
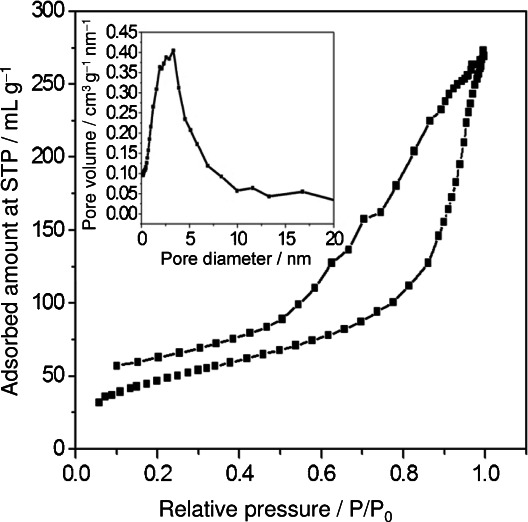
Figure 3
N 2 gas adsorptionu2013desorption isotherm of CeO 2 nanoparticles. Figure insert: pore diameter of CeO 2 nanoparticles prepared via solution combustion method.
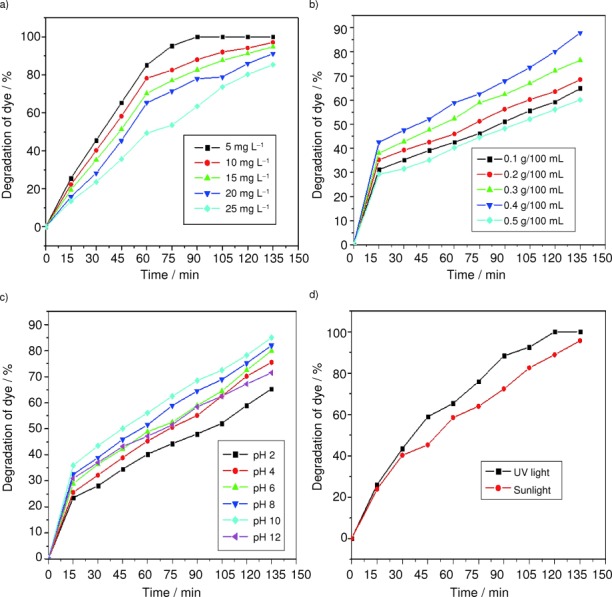
Figure 4
Effect of a)u2005dye concentration, b)u2005 catalytic load, c)u2005 pH, and d)u2005light source on the photocatalytic activity of CeO 2 nanoparticles.
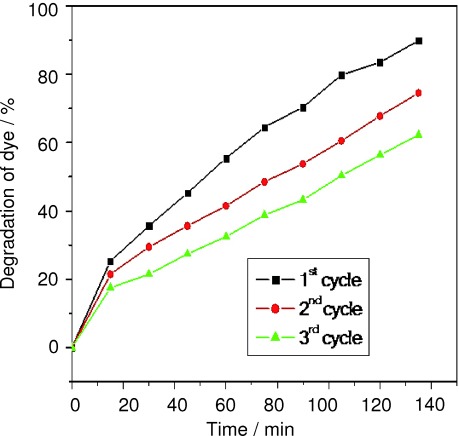
Figure 5
Effect of recyclability of CeO 2 on photocatalytic activity.
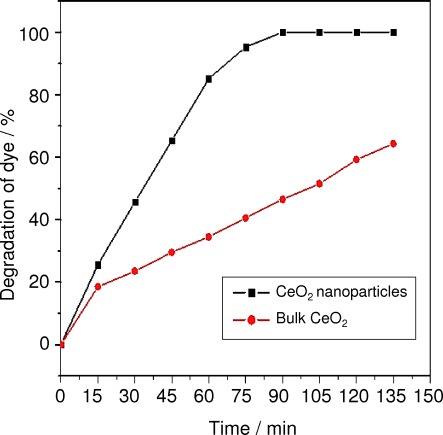
Figure 6
Comparison of the photocatalytic degradation of trypan blue by CeO 2 nanoparticles and bulk CeO 2 .
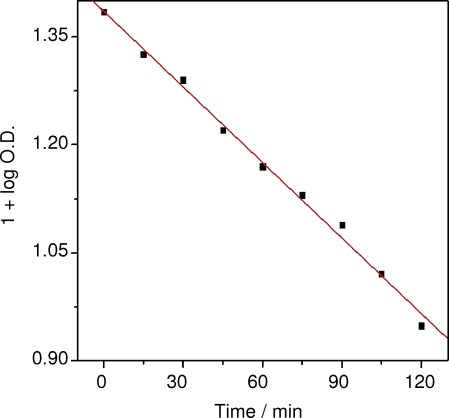
Figure 7
Kinetics of the photocatalytic degradation of trypan blue by CeO 2 nanoparticles.
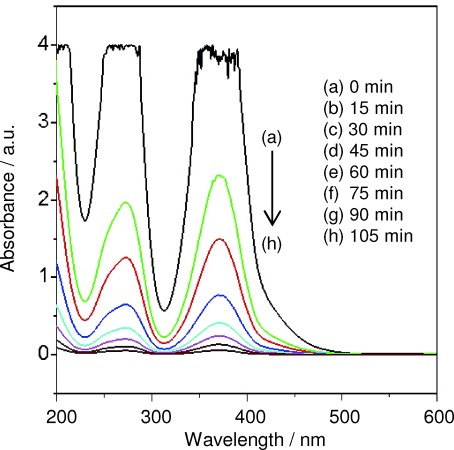
Figure 8
Photochemical reduction of Cr VI to Cr III using CeO 2 nanoparticles.
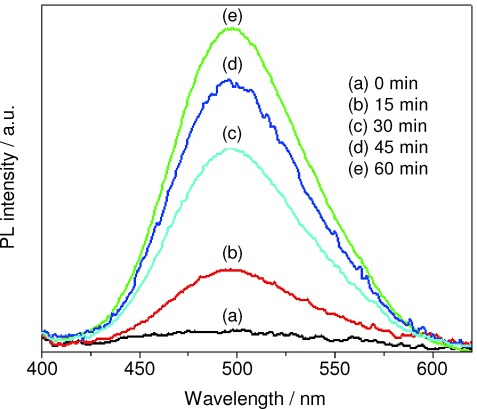
Figure 9
Phospholuminescence (PL) spectra for the detection of hydroxyl radicals.
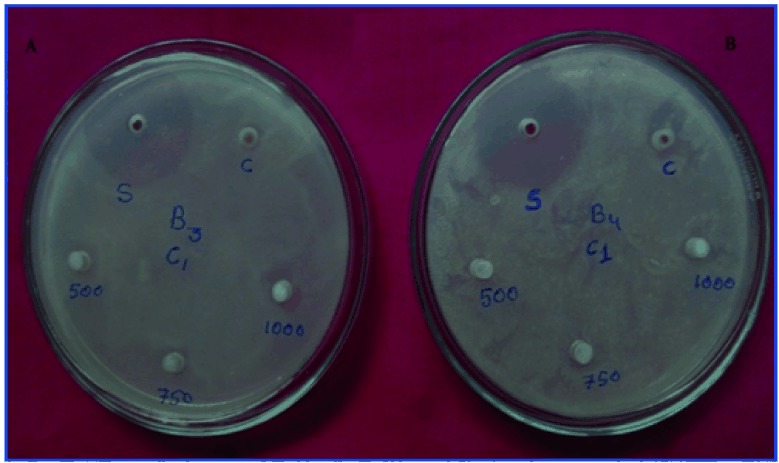
Figure 10
Antibacterial activity of CeO 2 nanoparticles using the agar well diffusion method. A) P.u2005aeruginosa with CeO 2 (500, 750, and 1000u2005u03bcg per 50u2005u03bcL in well), s: Ciprofloxacin (standar...
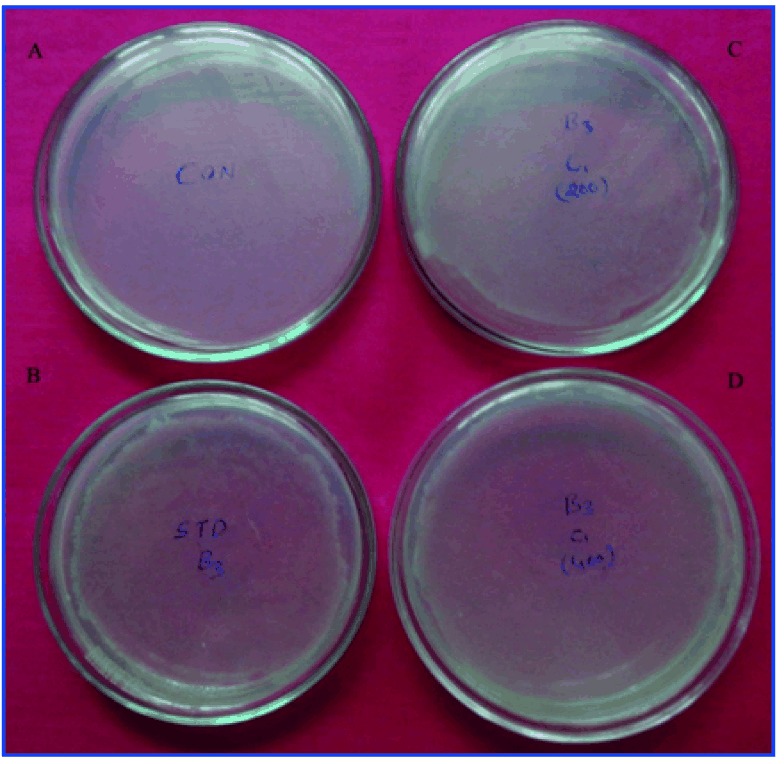
Figure 11
Antibacterial activity of CeO 2 nanoparticles using the broth dilution method. P.u2005aeruginosa treated with A)u2005 water (negative control); B)u2005Ciprofloxacin (positive control); C)u2005200u2005...
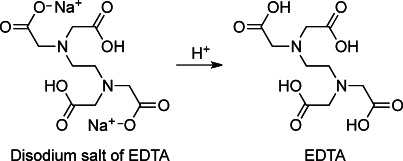
Scheme 1
Conversion of disodium salt of EDTA to pure EDTA.
Figure images are served from the NIH/NLM PubMed Central Open Access Subset or Europe PMC; copyright remains with the publishers and authors.
💬 Discussion
0 commentsNo comments yet. Be the first to start a discussion!
Leave a Comment