Abstract
AbstractWe used live cell imaging to compare the fate of human nontransformed (RPE‐1) and cancer (HeLa, U2OS) cells as they entered mitosis in nocodazole or taxol. In the same field, and in either drug, a cell in all lines could die in mitosis, exit mitosis and die within 10 h, or exit mitosis and survive ≥10 h. Relative to RPE‐1 cells, significantly fewer HeLa or U2OS cells survived mitosis or remained viable after mitosis: in nocodazole concentrations that inhibit spindle microtubule assembly, or in 500 nM taxol, 30% and 27% of RPE‐1 cells, respectively, died in or within 10 h of exiting mitosis while 90% and 49% of U2OS and 78% and 81% of HeLa died. This was even true for clinically relevant taxol concentrations (5 nM) which killed 93% and 46%, respectively, of HeLa and U2OS cells in mitosis or within 10 h of escaping mitosis, compared to 1% of RPE‐1 cells. Together these data imply that studies using HeLa or U2OS cells, harvested after a prolonged block in mitosis with nocodazole or taxol, are significantly contaminated with dead or dying cells. We also found that the relationship between the duration of mitosis and survival is drug and cell type specific and that lethality is related to the cell type and drug used to prevent satisfaction of the kinetochore attachment checkpoint. Finally, work with a pan‐caspase inhibitor suggests that the primary apoptotic pathway triggered by nocodazole during mitosis in RPE‐1 cells is not active in U2OS cells. Cell Motil. Cytoskeleton 2008. © 2008 Wiley‐Liss, Inc.
🔬 Techniques
✨ Fluorophores
🧪 Sample Preparation
🔬 Cell Lines
🏭 Microscope Brands
🧪 Reagent Suppliers
🔎 Objectives
💻 Software Details
🏛️ Research Organizations (ROR)
Affiliated research institutions:
📋 Methods
Cell Culture and Drug Treatment
HeLa (cervical carcinoma), U2OS (osteosarcoma) and hTERT-RPE-1 (RPE-1; retinal pigment epithelial) cell lines were cultured as monolayers in DMEM supplemented with 10% fetal bovine serum (FBS). All cells were maintained in a humidified incubator at 37°C in a 5% CO 2 environment. Prior to experiments cells were subcultured onto 25 mm 2 glass coverslips and grown as above for at least 16 h. For filming, coverslip cultures were mounted in Rose chambers and recordings were made at 37°C as previously described [ Khodjakov and Rieder, 2006 ]. Before imaging, nocodazole or taxol (Calbiochem, La Jolla, CA) was added to the medium at the concentrations noted in the text. The general caspase inhibitor (20 μM), Q-VD-OPh (R&D Systems, Minneapolis, MN; Cat # OPH001), was added to the medium 1 h before adding nocodazole.
Live-Cell Microscopy
Time-lapse recordings of RPE-1, HeLa and U2OS cells were captured every 2 (untreated controls) to 10 (experimental) minutes at 37°C with a low magnification (10X 0.3NA) PlanFluor phase-contrast objective lens mounted on a Nikon Diaphot microscope equipped with a Spot Insight QE video camera and fast UniBlitz shutters (Vincent Associates, Rochester, NY). The hardware was driven by Image-Pro Plus 5.1.020 (Media Cybernetics, Silver Spring, MD). Image sequences were compiled with ImageJ 1.35c (NIH), and contrast-adjustment was conducted using Photoshop CS2 (Adobe Systems). In our graphs N refers to the total numbers of cells pooled from ≥2 separate long-term recordings obtained on different days, with the exception of those experiments using the pancaspase inhibitor, Q-VD-OPh, which were from single experiments. In some cases the number of cells noted in the lanes of our timing graph ( Fig. 2 ) is different from that of our survival graph ( Fig. 4 ) because clustering of adjacent cells sometimes prohibited determining an accurate duration of mitosis for a particular cell but not its ultimate fate.
Show full methods section
Cell Culture and Drug Treatment
HeLa (cervical carcinoma), U2OS (osteosarcoma) and hTERT-RPE-1 (RPE-1; retinal pigment epithelial) cell lines were cultured as monolayers in DMEM supplemented with 10% fetal bovine serum (FBS). All cells were maintained in a humidified incubator at 37°C in a 5% CO 2 environment. Prior to experiments cells were subcultured onto 25 mm 2 glass coverslips and grown as above for at least 16 h. For filming, coverslip cultures were mounted in Rose chambers and recordings were made at 37°C as previously described [ Khodjakov and Rieder, 2006 ]. Before imaging, nocodazole or taxol (Calbiochem, La Jolla, CA) was added to the medium at the concentrations noted in the text. The general caspase inhibitor (20 μM), Q-VD-OPh (R&D Systems, Minneapolis, MN; Cat # OPH001), was added to the medium 1 h before adding nocodazole.
Live-Cell Microscopy
Time-lapse recordings of RPE-1, HeLa and U2OS cells were captured every 2 (untreated controls) to 10 (experimental) minutes at 37°C with a low magnification (10X 0.3NA) PlanFluor phase-contrast objective lens mounted on a Nikon Diaphot microscope equipped with a Spot Insight QE video camera and fast UniBlitz shutters (Vincent Associates, Rochester, NY). The hardware was driven by Image-Pro Plus 5.1.020 (Media Cybernetics, Silver Spring, MD). Image sequences were compiled with ImageJ 1.35c (NIH), and contrast-adjustment was conducted using Photoshop CS2 (Adobe Systems). In our graphs N refers to the total numbers of cells pooled from ≥2 separate long-term recordings obtained on different days, with the exception of those experiments using the pancaspase inhibitor, Q-VD-OPh, which were from single experiments. In some cases the number of cells noted in the lanes of our timing graph ( Fig. 2 ) is different from that of our survival graph ( Fig. 4 ) because clustering of adjacent cells sometimes prohibited determining an accurate duration of mitosis for a particular cell but not its ultimate fate.
Immunofluorescence
Microtubule staining was performed as previously described [ Brito and Rieder, 2006 ]. As primary and secondary antibodies we used mouse anti-α-tubulin (DM1α, Sigma) and AlexaFluor 594 (Molecular Probes), respectively. DNA was counterstained with Hoechst 33342 (Molecular Probes). After staining, cells were imaged as a Z-series (200 nm apart) on an Olympus IX70 inverted microscope equipped with a CM350 camera (Photometrics). The images were deblurred using the SoftWorx 2.5 deconvolution algorithm (Applied Precision, Issaquah, WA), and presented as maximal intensity projections.
📊 Figures
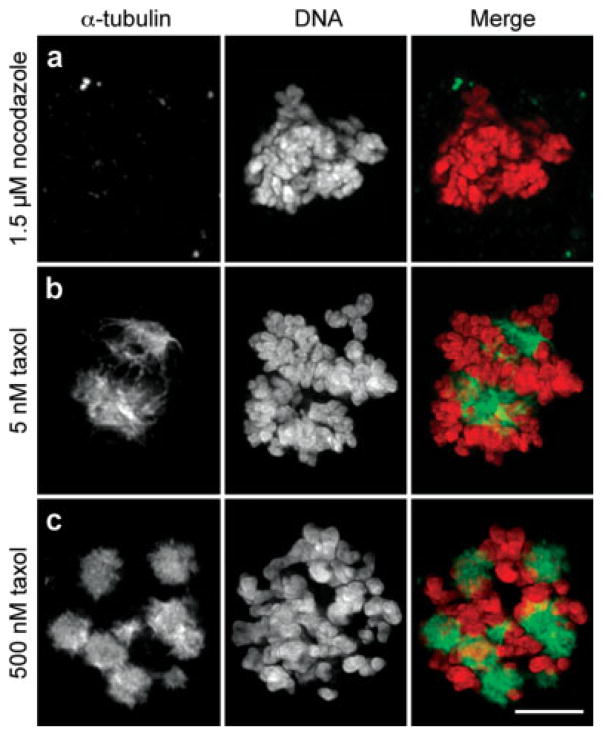
Fig. 1
Nocodazole inhibits spindle microtubule formation whereas taxol promotes microtubule stability. HeLa cells were incubated overnight with 1.5 u03bcM nocodazole ( a ), 5 nM ( b ) taxol, or 500 nM ( c ) ...
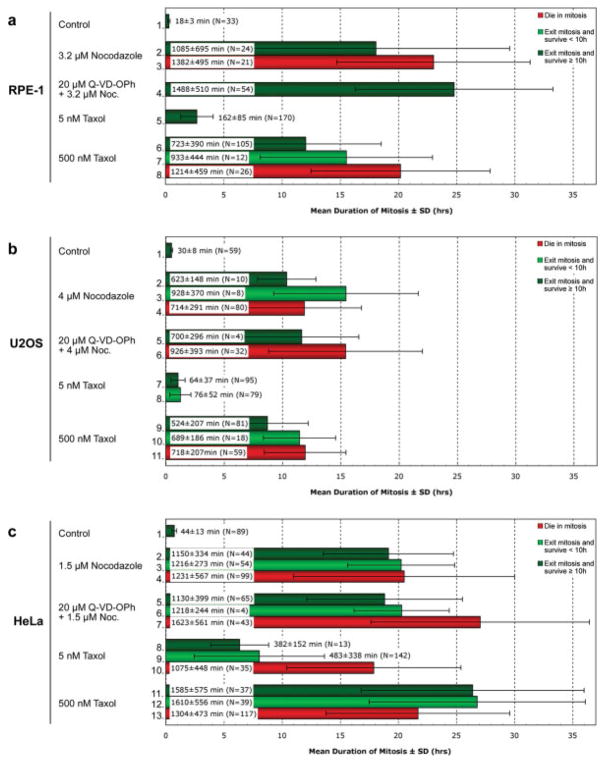
Fig. 2
In the presence of nocodazole or taxol, U2OS cells spend significantly less time in mitosis than RPE-1 or HeLa cells. Phase-contrast recordings of RPE-1 ( a ), U2OS ( b ) and HeLa ( c ) cultures conti...
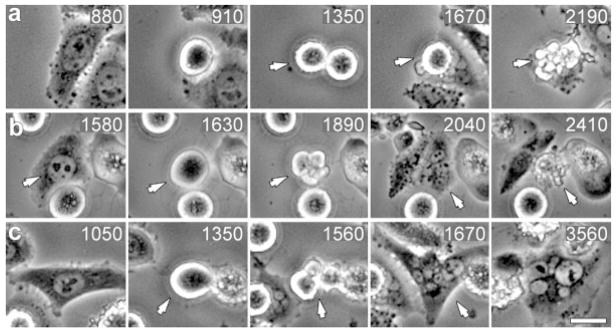
Fig. 3
Human cells in the same population that enter mitosis in the presence of microtubule poisons exhibit one of three fates. Selected frames from the same phase-contrast video recording of HeLa cells ente...
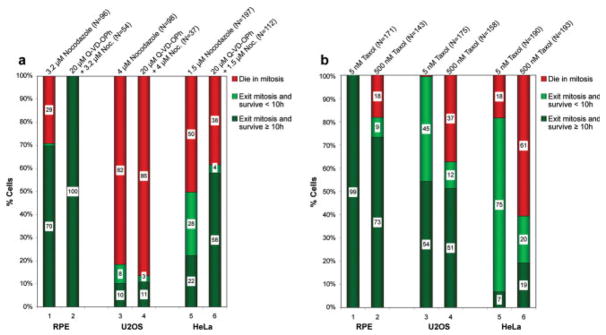
Fig. 4
Nontransformed RPE-1 cells show higher survival rates when dividing in the presence of nocodazole or taxol than U2OS or HeLa cells. Phase-contrast recordings of RPE-1, U2OS and HeLa cultures incubated...
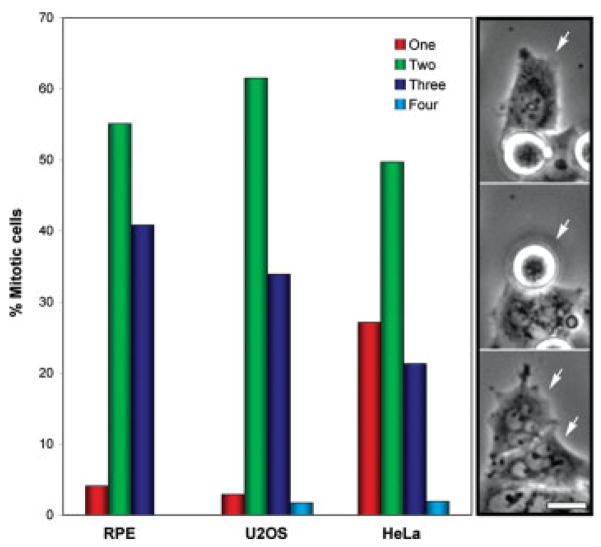
Fig. 5
Low magnification time-lapse recordings of RPE-1, U2OS and HeLa cells dividing in the presence of 5 nM taxol were analyzed for cells that exited mitosis without dividing (red bars), or that exited mit...
Figure images are served from the NIH/NLM PubMed Central Open Access Subset or Europe PMC; copyright remains with the publishers and authors.
💬 Discussion
0 commentsNo comments yet. Be the first to start a discussion!
Leave a Comment