Abstract
AbstractDepression is a common mental disorder. The standard medical treatment is the selective serotonin reuptake inhibitors (SSRIs). All characterized SSRIs are competitive inhibitors of the serotonin transporter (SERT). A non-competitive inhibitor may produce a more favorable therapeutic profile. Vilazodone is an antidepressant with limited information on its molecular interactions with SERT. Here we use molecular pharmacology and cryo-EM structural elucidation to characterize vilazodone binding to SERT. We find that it exhibits non-competitive inhibition of serotonin uptake and impedes dissociation of [3H]imipramine at low nanomolar concentrations. Our SERT structure with bound imipramine and vilazodone reveals a unique binding pocket for vilazodone, expanding the boundaries of the extracellular vestibule. Characterization of the binding site is substantiated with molecular dynamics simulations and systematic mutagenesis of interacting residues resulting in decreased vilazodone binding to the allosteric site. Our findings underline the versatility of SERT allosteric ligands and describe the unique binding characteristics of vilazodone.
🔬 Techniques
✨ Fluorophores
🧪 Sample Preparation
🔬 Cell Lines
🏭 Microscope Brands
🧪 Reagent Suppliers
📷 Detectors
💻 Software Details
💻 Code & Software
💾 Data Repositories
🏛️ Research Organizations (ROR)
Affiliated research institutions:
📋 Methods
Site-directed mutagenesis Human SERT was cloned into the pUbi1z vector using the NotI and XbaI. Mutations herein were generated using the two-step PCR method or, for R104K, F335L, E493N, E494Q, Y495A, F556A, P561G, and Y579A, ordered at GeneArt, Thermo Fisher (Waltham, MA). All mutations were confirmed by DNA sequencing. For mutants generated by PCR, the sense primers were (antisense primers were complementary): Y95F: cagtgattggctttgcagtggacctgggc; I172M: gcatcattgccttttacatggcttcctactacaac; Q332N: gatgcagccgctaacatcttcttctctc; S438T: caagcctgcaaacgttgtgtccaagcc.
Membrane preparation
COS-7 cells were transiently transfected with SERT WT or mutants using the Lipo2000 transfection protocol (Invitrogen): 2.6 µg SERT plasmid and 7.6 µL Lipofectamine were mixed each with 200 µL Opti-Mem R (1X) and incubated for 20 minutes for complex formation. The mixture was added to 10 ml DMEM 1885 medium (in house) containing 7.2 million COS-7 cells and seeded in a 150 cm 2 flask. After 5 h, 20 ml DMEM1885 with Penicillin, Streptomycin, and l -glutamine was added. After 72 h, the cells were harvested for membranes by adding 10 mL PBS + 5 mM EDTA, washed with 2 mL sucrose buffer (SB: 0.3 M sucrose, 120 mM NaCl, 5 mM KCl, 1.2 mM MgSO 4 , 1.2 mM CaCl 2 , 25 mM HEPES, pH 7.4), and lysed with one ultrasonic burst (Branson Sonifier with microtip) in 1 mL SB. Membranes were pelleted at 4500xG for 20 min, resuspended in 1 mL SB, and stored at −20 °C. [ 3 H]S-CIT equilibrium binding experiments COS-7 cells were transiently transfected as for membrane preparations, with 0.018 µg SERT plasmid, 0.055 µL Lipofectamine per 50,000 cells. 0.3 ml (containing 25.000 cells) were added to each well in 24-well plates coated with poly-ornithine. After 5 h, 0.6 ml of DMEM1885 with antibiotic was added to each well, and incubated for 2 days at 37 °C, 10% CO 2, and 100% humidity. The binding assays were carried in Binding Buffer (BB) (25 mM HEPES, 130 mM NaCl, 5.4 mM KCl, 1.2 mM CaCl 2 , 1.2 mM MgSO 4 , 1 mM L ascorbic acid, 5 mM D glucose, pH 7.4). Prior to the experiment, the cells were washed once in 400 µl of BB and the non-labeled compound (S-CIT or VLZ) was added to the cells in the indicated concentrations in a total volume of 450 µl. The assay was initiated by the addition of 50 uL 3 nM [ 3 H]S-CIT (81 Ci/mmol). Non-specific binding was determined with 1 µM paroxetine (Sigma-Aldrich). After 60 min of incubation at room temperature, the cells were washed twice with 500 µl of ice-cold BB, lysed in 250 µl 1% SDS and left for >60 min at 37 °C. All samples were transferred to 24-well counting plates (Perkin Elmer, Waltham, MA), 500 µl (of Opti-phase Hi Safe 3 scintillation fluid (Perkin Elmer) was added followed by counting of the plates in a Wallac Tri-Lux β-scintillation counter (Perkin Elmer). All experiments were carried out using 10 different ligand concentrations and performed in triplicate. [ 3 H]5-HT uptake Uptake experiments were performed at RT using 5-[1,2- 3 H]hydroxytryptamine ([ 3 H]5-HT, 43,1 Ci/mmol, Perkin Elmer) on COS-7 cells transfected and seeded as described for [ 3 H]S-CIT equilibrium binding experiments. The seeded cell number was adjusted to achieve an uptake level of maximally 10% of the total added [ 3 H]5-HT. The uptake assays were carried out 2 days after transfection. Just prior to the experiment, the cells were washed once in 400 µL BB at room temperature. 50 µL of the tested inhibitors were added to cells in the indicated concentrations, 30 min prior to the addition of 50 µL 8–12 nM [ 3 H]5-HT. After 3 min of incubation, the uptake reaction was stopped by washing twice with 500 µL ice-cold BB. For saturation uptake experiments, the indicated concentrations of [3H]5-HT were added and incubated for either 3 (1 and 1.9 nM), 6 (3, 3.8 and 6 nM), or 10 (7.5, 10, and 15 nM) min. Cells were lysed and transferred to counting plates as described above. Non-specific uptake was determined in the presence of 1 µM paroxetine. All determinations were performed in triplicate. [ 3 H]IMI and [ 3 H]S-CIT dissociation rate assay [ 3 H]IMI (81 Ci/mmol) or [ 3 H]S-CIT (81 Ci/mmol) were added to a membrane suspension of 1 mL transfected membranes and 3 mL membrane buffer (MB, 120 mM NaCl, 5 mM KCl, 1.2 mM MgSO 4 , 1.2 mM CaCl 2 , 25 mM HEPES, pH 7.4) to a concentration for [ 3 H]IMI and [ 3 H]S-CIT on 0.95 nM and 2.8 nM, respectively. Binding was incubated for 30 minutes at room temperature to reach equilibrium. Dissociation was initiated by 12x dilution of the membrane suspension with MB containing 1 µM paroxetine and the indicated concentrations of allosteric inhibitor (VLZ or S-CIT). Note: 1 µM paroxetine has no allosteric effect on the dissociation of [ 3 H]IMI and [ 3 H]S-CIT. The dissociation was stopped at seven time points (5–10–15–20–30–50–70 min) by rapid filtration of the samples through GF/B filters using a Tomtec cell harvester and washed for 20 s with ice-cold 20 mM HEPES, 0.2 M NaCl, pH 7.4. Non-specific binding was determined by incubating 50 µL membrane suspension in 600 µL MB with 1 µM paroxetine at 37 o C for 1 h. Experiments were performed in a water bath at a temperature where t ½ for control dissociation (i.e., dissociation without allosteric inhibitor) were set to approximately 15 min. All data are collected from at least three independent experiments. The allosteric potency was calculated from dissociation rate constants ( k [VLZ] ) for [ 3 H]IMI or [ 3 H]S-CIT at different VLZ concentrations and expressed relative to the dissociation rate constant without VLZ ( k buf ). IC 50 values were calculated from concentration–effect curves of normalized dissociation ratio ( k [VLZ] / k buf ) versus log[drug] and are shown as mean values calculated from means of pIC50 and the SE interval from the pIC50 ± S.E. All data were analyzed using Prism 9 (GraphPad Software Inc., San Diego, CA).
Show full methods section
Site-directed mutagenesis Human SERT was cloned into the pUbi1z vector using the NotI and XbaI. Mutations herein were generated using the two-step PCR method or, for R104K, F335L, E493N, E494Q, Y495A, F556A, P561G, and Y579A, ordered at GeneArt, Thermo Fisher (Waltham, MA). All mutations were confirmed by DNA sequencing. For mutants generated by PCR, the sense primers were (antisense primers were complementary): Y95F: cagtgattggctttgcagtggacctgggc; I172M: gcatcattgccttttacatggcttcctactacaac; Q332N: gatgcagccgctaacatcttcttctctc; S438T: caagcctgcaaacgttgtgtccaagcc.
Membrane preparation
COS-7 cells were transiently transfected with SERT WT or mutants using the Lipo2000 transfection protocol (Invitrogen): 2.6 µg SERT plasmid and 7.6 µL Lipofectamine were mixed each with 200 µL Opti-Mem R (1X) and incubated for 20 minutes for complex formation. The mixture was added to 10 ml DMEM 1885 medium (in house) containing 7.2 million COS-7 cells and seeded in a 150 cm 2 flask. After 5 h, 20 ml DMEM1885 with Penicillin, Streptomycin, and l -glutamine was added. After 72 h, the cells were harvested for membranes by adding 10 mL PBS + 5 mM EDTA, washed with 2 mL sucrose buffer (SB: 0.3 M sucrose, 120 mM NaCl, 5 mM KCl, 1.2 mM MgSO 4 , 1.2 mM CaCl 2 , 25 mM HEPES, pH 7.4), and lysed with one ultrasonic burst (Branson Sonifier with microtip) in 1 mL SB. Membranes were pelleted at 4500xG for 20 min, resuspended in 1 mL SB, and stored at −20 °C. [ 3 H]S-CIT equilibrium binding experiments COS-7 cells were transiently transfected as for membrane preparations, with 0.018 µg SERT plasmid, 0.055 µL Lipofectamine per 50,000 cells. 0.3 ml (containing 25.000 cells) were added to each well in 24-well plates coated with poly-ornithine. After 5 h, 0.6 ml of DMEM1885 with antibiotic was added to each well, and incubated for 2 days at 37 °C, 10% CO 2, and 100% humidity. The binding assays were carried in Binding Buffer (BB) (25 mM HEPES, 130 mM NaCl, 5.4 mM KCl, 1.2 mM CaCl 2 , 1.2 mM MgSO 4 , 1 mM L ascorbic acid, 5 mM D glucose, pH 7.4). Prior to the experiment, the cells were washed once in 400 µl of BB and the non-labeled compound (S-CIT or VLZ) was added to the cells in the indicated concentrations in a total volume of 450 µl. The assay was initiated by the addition of 50 uL 3 nM [ 3 H]S-CIT (81 Ci/mmol). Non-specific binding was determined with 1 µM paroxetine (Sigma-Aldrich). After 60 min of incubation at room temperature, the cells were washed twice with 500 µl of ice-cold BB, lysed in 250 µl 1% SDS and left for >60 min at 37 °C. All samples were transferred to 24-well counting plates (Perkin Elmer, Waltham, MA), 500 µl (of Opti-phase Hi Safe 3 scintillation fluid (Perkin Elmer) was added followed by counting of the plates in a Wallac Tri-Lux β-scintillation counter (Perkin Elmer). All experiments were carried out using 10 different ligand concentrations and performed in triplicate. [ 3 H]5-HT uptake Uptake experiments were performed at RT using 5-[1,2- 3 H]hydroxytryptamine ([ 3 H]5-HT, 43,1 Ci/mmol, Perkin Elmer) on COS-7 cells transfected and seeded as described for [ 3 H]S-CIT equilibrium binding experiments. The seeded cell number was adjusted to achieve an uptake level of maximally 10% of the total added [ 3 H]5-HT. The uptake assays were carried out 2 days after transfection. Just prior to the experiment, the cells were washed once in 400 µL BB at room temperature. 50 µL of the tested inhibitors were added to cells in the indicated concentrations, 30 min prior to the addition of 50 µL 8–12 nM [ 3 H]5-HT. After 3 min of incubation, the uptake reaction was stopped by washing twice with 500 µL ice-cold BB. For saturation uptake experiments, the indicated concentrations of [3H]5-HT were added and incubated for either 3 (1 and 1.9 nM), 6 (3, 3.8 and 6 nM), or 10 (7.5, 10, and 15 nM) min. Cells were lysed and transferred to counting plates as described above. Non-specific uptake was determined in the presence of 1 µM paroxetine. All determinations were performed in triplicate. [ 3 H]IMI and [ 3 H]S-CIT dissociation rate assay [ 3 H]IMI (81 Ci/mmol) or [ 3 H]S-CIT (81 Ci/mmol) were added to a membrane suspension of 1 mL transfected membranes and 3 mL membrane buffer (MB, 120 mM NaCl, 5 mM KCl, 1.2 mM MgSO 4 , 1.2 mM CaCl 2 , 25 mM HEPES, pH 7.4) to a concentration for [ 3 H]IMI and [ 3 H]S-CIT on 0.95 nM and 2.8 nM, respectively. Binding was incubated for 30 minutes at room temperature to reach equilibrium. Dissociation was initiated by 12x dilution of the membrane suspension with MB containing 1 µM paroxetine and the indicated concentrations of allosteric inhibitor (VLZ or S-CIT). Note: 1 µM paroxetine has no allosteric effect on the dissociation of [ 3 H]IMI and [ 3 H]S-CIT. The dissociation was stopped at seven time points (5–10–15–20–30–50–70 min) by rapid filtration of the samples through GF/B filters using a Tomtec cell harvester and washed for 20 s with ice-cold 20 mM HEPES, 0.2 M NaCl, pH 7.4. Non-specific binding was determined by incubating 50 µL membrane suspension in 600 µL MB with 1 µM paroxetine at 37 o C for 1 h. Experiments were performed in a water bath at a temperature where t ½ for control dissociation (i.e., dissociation without allosteric inhibitor) were set to approximately 15 min. All data are collected from at least three independent experiments. The allosteric potency was calculated from dissociation rate constants ( k [VLZ] ) for [ 3 H]IMI or [ 3 H]S-CIT at different VLZ concentrations and expressed relative to the dissociation rate constant without VLZ ( k buf ). IC 50 values were calculated from concentration–effect curves of normalized dissociation ratio ( k [VLZ] / k buf ) versus log[drug] and are shown as mean values calculated from means of pIC50 and the SE interval from the pIC50 ± S.E. All data were analyzed using Prism 9 (GraphPad Software Inc., San Diego, CA).
SERT expression and purification
The human SERT construct used for the cryo-EM studies was the N- and C-terminally truncated WT transporter (ΔN72, ΔC13) 44 , 79 . Cells were solubilized in 20 mM Tris-HCl, pH 8, 100 mM NaCl containing 20 mM DDM, 2.5 mM CHS in the presence of 10 μM VLZ and 10 μM IMI and were then purified into buffer A containing 20 mM Tris-HCl, pH 8.0, 100 mM NaCl, 1 mM DDM, 0.2 mM CHS, 10 μM VLZ, and 10 μM IMI by Strep-Tactin affinity chromatography. The N- and C-termini containing GFP and purification tags were removed by thrombin digestion. SERT was mixed with 15B8 Fab at a 1:1.2 molar ratio. The resulting complexes were further purified by size-exclusion chromatography into buffer A. The peak fraction containing the SERT-15B8 Fab was concentrated to 4 mg/ml and then 100 μM VLZ and 100 μM IMI were added before cryo-EM grid preparation.
Cryo-EM sample preparation and data acquisition
For cryo-EM samples, 2.5 μl purified SERT-15B8 Fab complex was applied to glow-discharged Quantifoil holey carbon grids (gold, 2.0/2.0 µm size/hole space, 200 mesh). 100 µM fluorinated n -octyl-β-d-maltoside (final concentration) was added to the sample before freezing. After applying protein, the grids were blotted for 2 s at 100% humidity at 4 °C and plunge frozen in liquid ethane cooled by liquid nitrogen using a Vitrobot Mark IV system. Cryo-EM data were collected on a Titan Krios electron microscope equipped with a K3 direct electron detector, a BioQuantum energy filter, and operating at 300 kV. A total of 5,228 micrographs were automatically collected with SerialEM 80 at a nominal magnification of 77,160x in super-resolution counting mode with a binned pixel size of 0.648 Å/pixel. The typical defocus values ranged from −0.6 μm to −2.2 μm. The total dose was 43 e − /Å 2 for each stack.
Cryo-EM data processing
Drift correction of micrographs was performed using MotionCor2 81 and the defocus values were estimated with Gctf 82 . A total of 1,146,802 particles picked using Dog-Picker ( https://github.com/craigyk/emtools ) 83 were subjected to reference-free 2D classification followed by heterogenous refinement in cryoSPARC v3.2 84 . Homogeneous refinement local contrast transfer function (CTF) refinement and then non-uniform refinement was performed in cryoSPARC after recentering particles 85 (Supplementary Fig. 4 ). The maximum fit resolution for local CTF refinement was 3.6 Å. The 185,019 selected particles yielded a reconstruction at 3.65 Å. The resolution was estimated with the gold-standard Fourier shell correlation (FSC) 0.143 criterion 85 in cryoSPARC. The local resolution was also calculated in cryoSPARC.
Model building and refinement
A previous cryo-EM structure of the ts2-active SERT in complex with 15B8 Fab and 8B6 ScFv bound to ibogaine (6DZY) 20 was used as initial model; the 8B6 ScFv was removed before docking the PDB into the sharpened map in ChimeraX v0.9 86 . Manual adjustment was then performed in Coot v0.8.9.1 87 and VLZ and IMI were placed into the electron densities in Coot to generate a model. Model refinement of the coordinates was carried out in PHENIX v1.15.2-3472 88 using the real space refinement package. This iterative refinement process was repeated until the model reached optimal stereochemistry and geometric statistics as evaluated by MolProbity 89 . For cross-validation, the FSC curve between the refined model and half maps was calculated and compared to avoid overfitting. Atomistic MD simulations The SERT:IMI:VLZ complexes were prepared using the Maestro software tool (Schrödinger Release 2021-2: Schrödinger, LLC, New York, NY, 2021); antibody fragments were removed, and missing hydrogens atoms and side chains were added. Amino acid p K a was calculated using Epik 90 . Two Na + ions and one Cl − ion were modeled on the basis of PDB ID: 5I71 and 5I6X 44 by protein backbone superposition of the cryo-EM structures to the X-ray crystallography protein structure and deleting the latter ones. Final models were processed through the Orientations of Proteins in Membrane (OPM) tool 91 . The force field parameters of protonated VLZ and IMI were parameterized according to the CHARMM General Force Field (CGenFF) 92 . The insertion of the OPM-protein complexes into a bilayer was performed with CHARMM-GUI 93 . Each hSERT:IMI:VLZ complex was inserted in a lipid bilayer consisting of 249 1-palmitoyl-2-oleoyl-sn-glycero-3-phosphocholine (POPC) and 83 cholesterol molecules, followed by hydration and NaCl (150 mM). Approximate box dimensions: 110 × 110 x 115 Å 3 (~128000 atoms). All simulations were performed with GROMACS version 2020.3 using CHARMM36m force fields 94 for SERT, CHARMM36 force fields 95 for lipids, and the TIP3P model 96 for water. To maintain the temperature, a Nosé-Hoover temperature coupling method 97 with a tau-t of 1 ps was used, and for pressure coupling, a semi-isotropic Parrinello − Rahman method 98 with a tau-p of 5 ps and a compressibility of 4.5 × 10 −5 bar −1 was used. The temperature was maintained at 310 K and pressure at 1 bar. Non-bonded interactions were calculated in a pairwise manner within the 12 Å cutoff, with a switching function applied between 10–12 Å. Long-range non-bonded interactions were calculated with the particle mesh Ewald (PME) method 99 . The LINCS 100 method was applied to hydrogen bonds. Periodic boundary conditions were used. 5000 steps of steepest descent minimization were performed. Next, systems were equilibrated with two sets of NPT and NVT of simulations to smoothly relax the system with overall duration of 500 ps and 6 ns respectively, during which lipids, Cα atoms, protein side chains, ligand heavy atoms and the bound ions were restrained individually by harmonic potentials with decreasing force constants (from 4 kcal/mol/Å 2 to 0 kcal/mol/Å 2 ) to allow for relaxation of protein side chains and hydration of the protein. The equilibrated structures were subjected to 200 ns NPT MD simulations, integrated into 2-fs time steps, and trajectories recorded every 10 ps. VMD 101 was used for visualization. The RMSD was calculated using GROMACS version 2020.3 software tools. MMPBSA calculation The MMPBSA (Molecular Mechanics Poisson–Boltzmann Surface Area) method was used to calculate the protein-ligand binding free energy of each VLZ pose. For each system, in total, the final 750 frames were extracted from the trajectories and the free energy of binding was determined using the g_mmpbsa 102 tool developed for GROMACS. Reporting summary Further information on research design is available in the Nature Research Reporting Summary linked to this article.
Supplementary information Supplementary Information Peer Review File Description of Additional Supplementary Files Supplementary Movie 1 Supplementary Movie 2 Reporting summary
📊 Figures
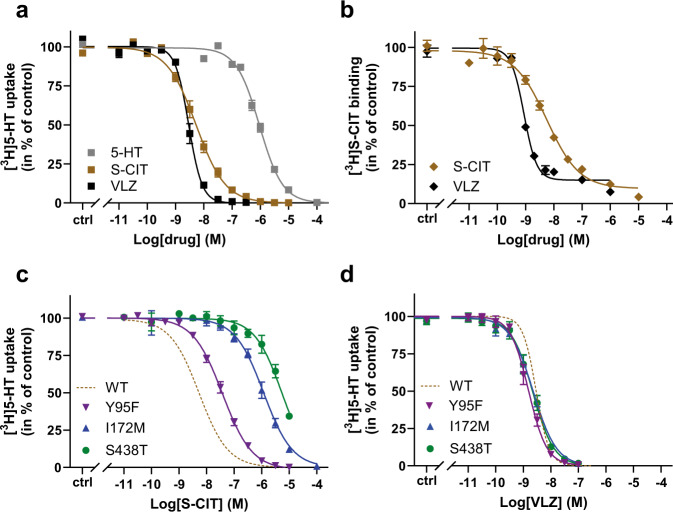
Fig. 1
Characterization of VLZ binding to SERT WT and S1 mutants.
a Inhibition potency of VLZ (black) and S-CIT (brown) compared to 5-HT (gray). The affinity for VLZ is 5-fold higher than for S-CIT in inhibiting [ 3 H]5-HT transport with K i values of 1.06 [0.90; 1....
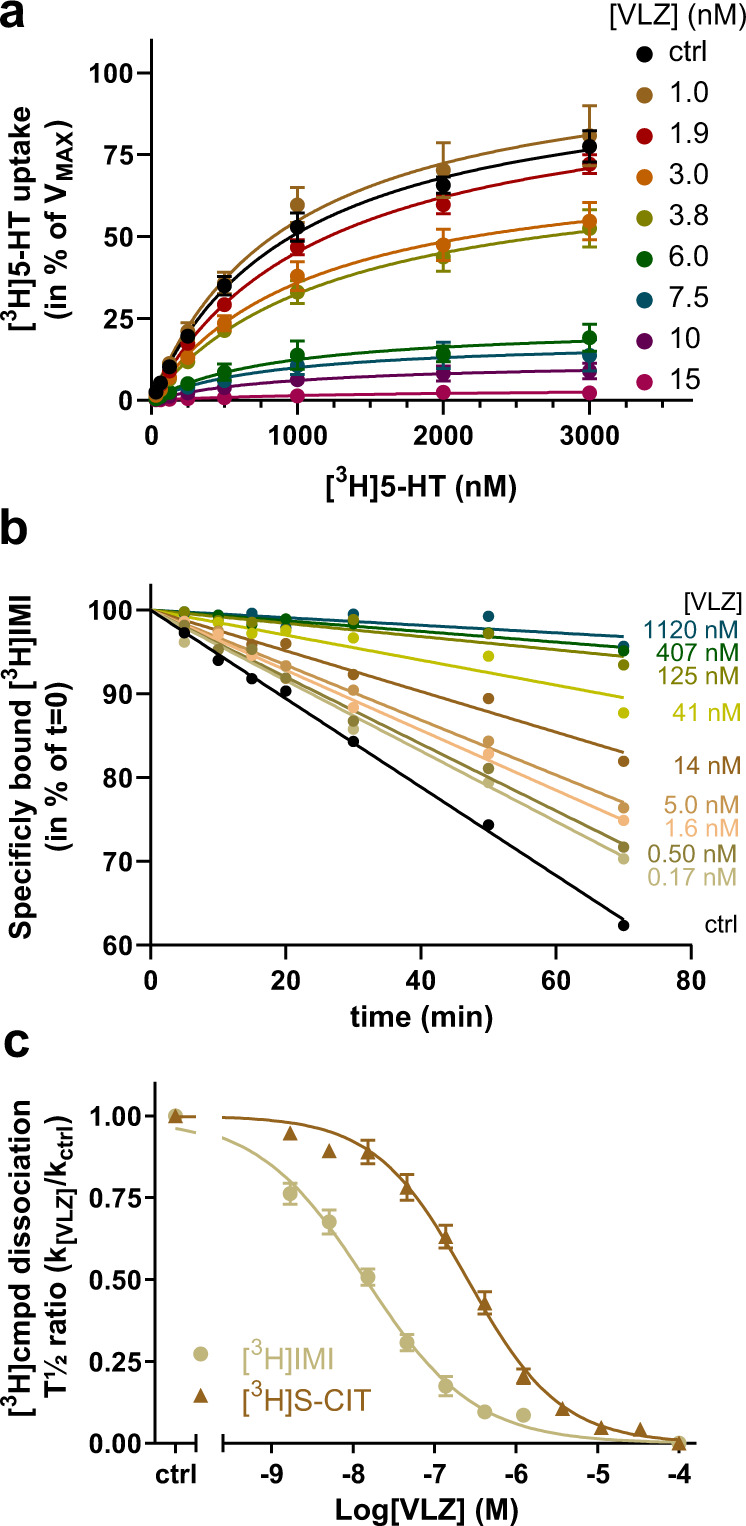
Fig. 2
Indications of VLZ as an allosteric inhibitor of SERT WT.
a Saturation uptake experiments for [ 3 H]5-HT transport as a function of increasing VLZ concentrations (0u201315u2009nM) are compatible with a non-competitive inhibition for VLZ. Colors of lines and ...
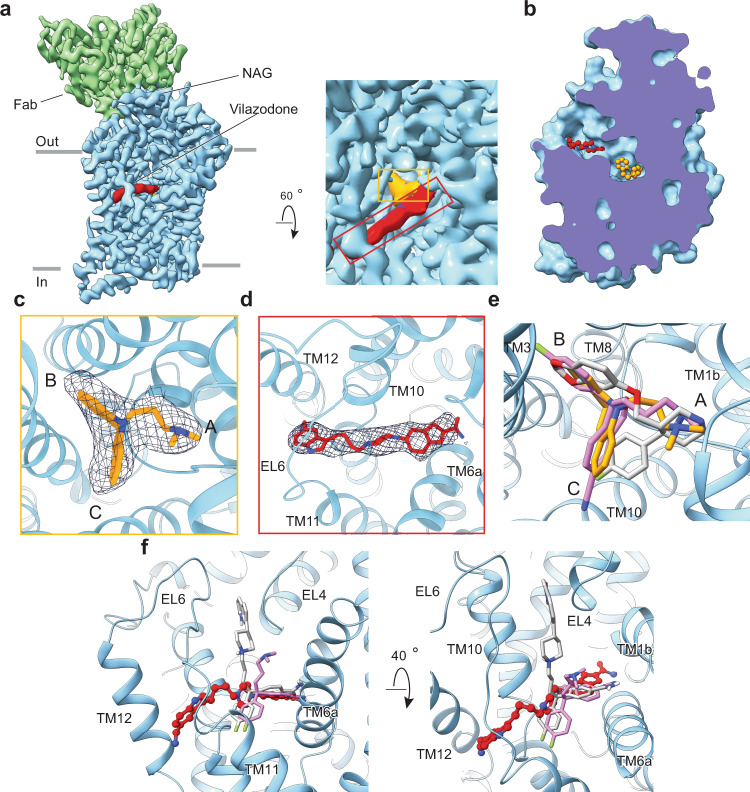
Fig. 3
Cryo-EM structure of SERT:IMI:VLZ complex.
a The overall reconstruction of the SERT:15B8-Fab:IMI:VLZ complex at 3.65u2009u00c5u00a0(PDB: 7LWD). Right panel shows the zoomed allosteric and central sites. SERT is colored in light blue and the 15...
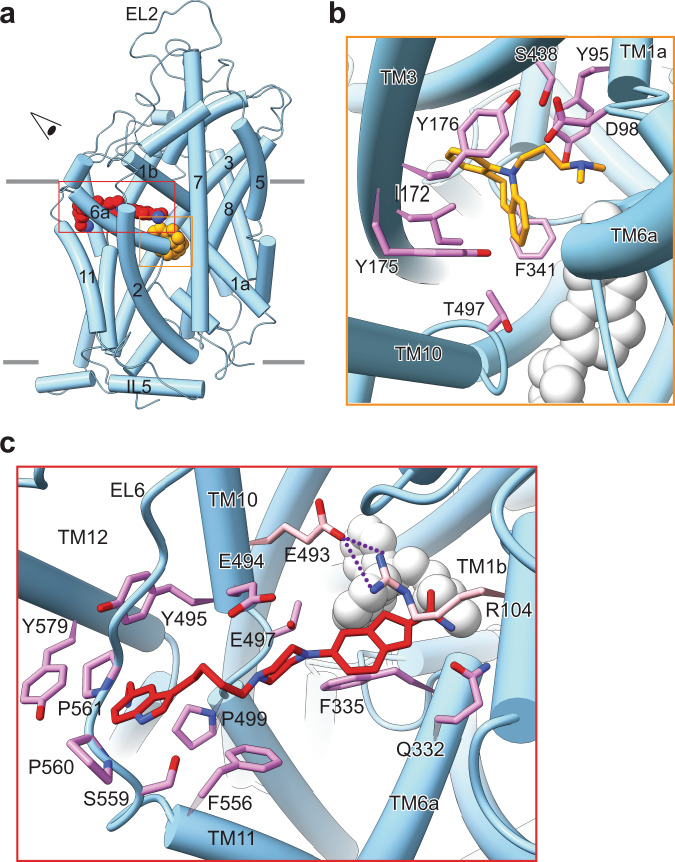
Fig. 4
Detailed representation of the binding sites for IMI and VLZ in SERT.
a Overall view of SERT:IMI:VLZ complex in cartoon representation; IMI (yellow) and VLZ (red) are depicted as spheres. The u201ceyeu201d represents the angle view depicted in ( b ) and ( c ). b Detaile...
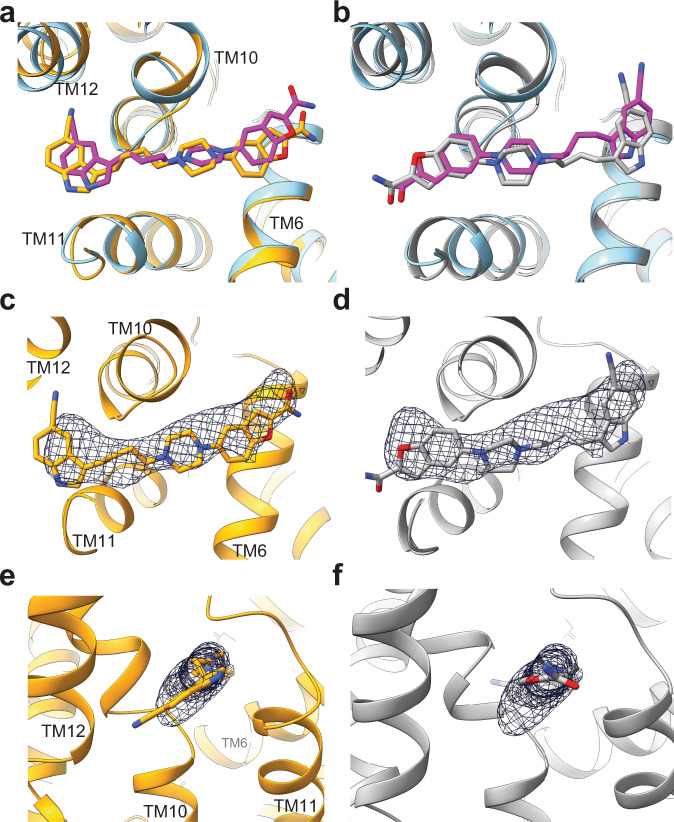
Fig. 5
MD simulations of possible VLZ binding poses.
Zoomed view of VLZ modeled into the allosteric binding site of SERT. Parts of SERT TMs and bound IMI are removed for clarity. a The refined cryo-EM SERT structure (blue ribbons) with VLZ (magenta) sup...
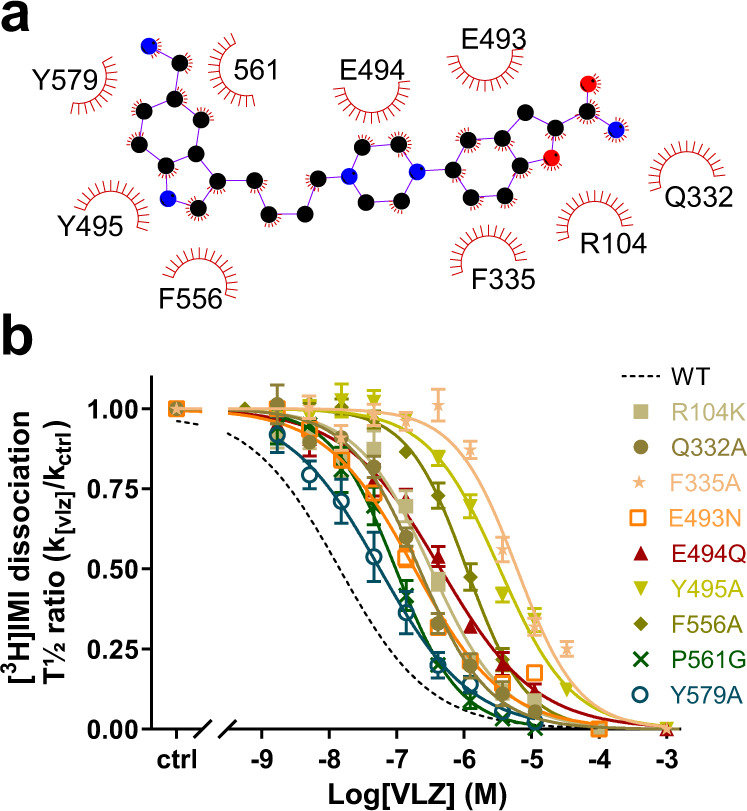
Fig. 6
Effect of SERT S2 mutants on VLZ allosteric potency.
a Zoomed interactions between VLZ and SERT. Schematics are generated by LIGPLOTu2009+u20091.4. Each eyelash motif indicates a hydrophobic contact. b Effect of mutating residues in the S2 site on allos...
Figure images are served from the NIH/NLM PubMed Central Open Access Subset or Europe PMC; copyright remains with the publishers and authors.
💬 Discussion
0 commentsNo comments yet. Be the first to start a discussion!
Leave a Comment