Abstract
Background: Clinical studies of osteoarthritis (OA) suggest central sensitization may contribute to the chronic pain experienced. This preclinical study used the monosodium iodoacetate (MIA) model of OA joint pain to investigate the potential contribution of spinal sensitization, in particular spinal glial cell activation, to pain behaviour in this model. Experimental OA was induced in the rat by the intra-articular injection of MIA and pain behaviour (change in weight bearing and distal allodynia) was assessed. Spinal cord microglia (Iba1 staining) and astrocyte (GFAP immunofluorescence) activation were measured at 7, 14 and 28 days post MIA-treatment. The effects of two known inhibitors of glial activation, nimesulide and minocycline, on pain behaviour and activation of microglia and astrocytes were assessed. Results: Seven days following intra-articular injection of MIA, microglia in the ipsilateral spinal cord were activated (p < 0. 05, compared to contralateral levels and compared to saline controls). Levels of activated microglia were significantly elevated at day 14 and 21 post MIA-injection. At day 28, microglia activation was significantly correlated with distal allodynia (p < 0.05). Ipsilateral spinal GFAP immunofluorescence was significantly (p < 0.01) increased at day 28, but not at earlier timepoints, in the MIA model, compared to saline controls. Repeated oral dosing (days 14-20) with nimesulide attenuated pain behaviour and the activation of microglia in the ipsilateral spinal cord at day 21. This dosing regimen also significantly attenuated distal allodynia (p < 0.001) and numbers of activated microglia (p < 0.05) and GFAP immunofluorescence (p < 0.001) one week later in MIA-treated rats, compared to vehicle-treated rats. Repeated administration of minocycline also significantly attenuated pain behaviour and reduced the number of activated microglia and decreased GFAP immunofluorescence in ipsilateral spinal cord of MIA treated rats. Conclusions: Here we provide evidence for a contribution of spinal glial cells to pain behaviour, in particular distal allodynia, in this model of osteoarthritic pain. Our data suggest there is a potential role of glial cells in the central sensitization associated with OA, which may provide a novel analgesic target for the treatment of OA pain.
🔬 Techniques
💻 Software
✨ Fluorophores
🧪 Sample Preparation
🔬 Cell Lines
🏭 Microscope Brands
🧪 Reagent Suppliers
📷 Detectors
🔎 Objectives
💻 Software Details
🏛️ Research Organizations (ROR)
Affiliated research institutions:
📋 Methods
Rats were purchased from Charles River U.K. All studies were carried out in accordance with UK Home Office Animals (Scientific Procedures) Act (1986) and follow the guidelines of the International Association for the Study of Pain. A total of 91 male Sprague Dawley rats weighing 160-190 g were used for these studies (n = 32 rats for behavioural pharmacology studies, n = 59 rats for immunohistochemical studies).
Intra-articular injections and behavioural testing
Adult male Sprague Dawley rats (160-190 g) were anesthetised with isoflurane (1.5-2% in 50% N 2 O-50% O 2 ) and received a single intra-articular injection of monosodium iodoacetate (MIA; 1 mg/50 μl; Sigma U.K.) in saline through the infra-patellar ligament of the left knee. The dose of MIA was based on the previous literature [ 5 , 41 , 42 ]. Control animals received a single intra-articular injection of saline (50 μl). Baseline behavioural measurements were taken prior to intra-articular injection (postoperative day (PO) 0) and then from PO day 7 onwards. Effects of MIA or saline injection on weight-distribution through the left (ipsilateral) and right (contralateral) knee were assessed using an incapacitance tester (Linton Instrumentation, U.K.) between post-operative days 7-28. Hind-paws were placed on separate sensors and the force (in grams) exerted by each hind limb was calculated and averaged over a period of 3 seconds as previously described [ 43 , 44 ]. Each data point was taken as the mean of three 3 sec readings. The development of mechanical allodynia was assessed using von Frey monofilaments (Semmes-Weinstein monofilaments of bending forces 1, 1.4, 2, 4, 6, 8, 10 and 15 g) as previously described [ 10 ]. Von Frey monofilaments were applied to the plantar surface of both hind-paws for a 3 sec period. Once a withdrawal reflex was established, the paw was retested with the next descending von Frey monofilament until no response occurred. The lowest weight of monofilament which elicited a withdrawal reflex was noted as the paw withdrawal threshold (PWT).
Show full methods section
Rats were purchased from Charles River U.K. All studies were carried out in accordance with UK Home Office Animals (Scientific Procedures) Act (1986) and follow the guidelines of the International Association for the Study of Pain. A total of 91 male Sprague Dawley rats weighing 160-190 g were used for these studies (n = 32 rats for behavioural pharmacology studies, n = 59 rats for immunohistochemical studies).
Intra-articular injections and behavioural testing
Adult male Sprague Dawley rats (160-190 g) were anesthetised with isoflurane (1.5-2% in 50% N 2 O-50% O 2 ) and received a single intra-articular injection of monosodium iodoacetate (MIA; 1 mg/50 μl; Sigma U.K.) in saline through the infra-patellar ligament of the left knee. The dose of MIA was based on the previous literature [ 5 , 41 , 42 ]. Control animals received a single intra-articular injection of saline (50 μl). Baseline behavioural measurements were taken prior to intra-articular injection (postoperative day (PO) 0) and then from PO day 7 onwards. Effects of MIA or saline injection on weight-distribution through the left (ipsilateral) and right (contralateral) knee were assessed using an incapacitance tester (Linton Instrumentation, U.K.) between post-operative days 7-28. Hind-paws were placed on separate sensors and the force (in grams) exerted by each hind limb was calculated and averaged over a period of 3 seconds as previously described [ 43 , 44 ]. Each data point was taken as the mean of three 3 sec readings. The development of mechanical allodynia was assessed using von Frey monofilaments (Semmes-Weinstein monofilaments of bending forces 1, 1.4, 2, 4, 6, 8, 10 and 15 g) as previously described [ 10 ]. Von Frey monofilaments were applied to the plantar surface of both hind-paws for a 3 sec period. Once a withdrawal reflex was established, the paw was retested with the next descending von Frey monofilament until no response occurred. The lowest weight of monofilament which elicited a withdrawal reflex was noted as the paw withdrawal threshold (PWT).
Drug treatment
The effects of repeated (day 14-21 post MIA-injection) oral administration of nimesulide (10 mg.kg- 1 ; Tocris, U.K.; n = 8 rats per group), or vehicle (2% methylcellulose in distilled water; n = 8 rats per group), on changes in weight bearing and mechanical allodynia were assessed for 7 days in MIA and saline-treated rats. Weight bearing and mechanical allodynia were assessed before nimesulide administration and at 40 min intervals post-drug administration. To determine whether there were any longer-term effects of repeated dosing with nimesulide on pain behaviour, which outlast the dosing schedule, behavioural testing was continued from days 21-28. At day 28 rats were killed and spinal cord and joints were collected for gene expression studies and joint histology, respectively. In a separate group of rats, the effects of the nimesulide treatment on the numbers of activated microglia and astrocytic activation in the spinal cord of MIA- and saline-treated rats were determined (n = 5 rats per group). Rats were perfused at days 21 or day 28 post-MIA injection and spinal cords were removed and prepared for immunohistochemistry (see below). In a final series of experiments, the effects of another glial cell inhibitor minocycline (30 mg.kg- 1 daily treatment from day 14-28) on pain behaviour (as described above) was determined in MIA-treated rats. At day 28 post MIA-injection, rats were perfused and spinal cords were collected for immunohistochemical analysis.
Immunohistochemistry
Rats were overdosed with sodium pentobarbital and transcardially perfused with saline (0.9%) followed by 4% paraformaldehyde (PFA; Sigma, U.K). The lumbar spinal cord was removed, post-fixed (4% PFA for 4 h) and stored in 30% sucrose in 0.1 M phosphate buffer/0.02% sodium azide solution at 4 C. Immunohistochemical staining was performed on 40 μm free-floating cryosections of L3/L4/L5 spinal cord (n = 4-6 rats per group, 5-6 individual spinal sections per animal). Microglial cells were stained using Iba-1 [ 45 ] and astrocytes were stained using GFAP [ 46 ]. Sections were blocked for 1 hr in 0.1 M phosphate buffer saline containing 3% normal goat serum and 0.3% Triton X-100 at room temperature. Sections were then incubated at 4°C for 72 h with rabbit α-Iba-1 (Wako, Japan) diluted 1:1000 in Trizma Triton X-100 buffered saline (TTBS) or incubated at room temperature 20-22°C for 18 h with mouse anti-GFAP (Thermo-Fisher, Leicestershire, UK) diluted 1:100 in TTBS Five 10 min washes in 0.1 M phosphate buffer (PB) were carried out between all subsequent steps. Sections were incubated for 2 h at room temperature with Alexafluor 488 conjugated goat α-rabbit secondary antibody (Molecular probes, Oregon) diluted 1:300 in TTBS (for Iba-1) or with Alexafluor 568 conjugated goat α-mouse secondary antibody (Molecular probes, Oregon) diluted 1:300 in TTBS (for GFAP). Sections were then mounted on gelatinized microscope slides, air-dried overnight at room temperature in the dark and coverslipped using Fluromount (Sigma).
Quantification of glial activation
Iba-1 immunostaining was visualised using a 20 × 0.4 NA objective lens on a Leica DMIRE2 fluorescence microscope, running Volocity 5.5 (PerkinElmer) equipped with a Hamamatsu Orca C4642-95 camera. Images were acquired using a typical exposure time of 750 ms. Total numbers of positively identified activated microglia expressing Iba-1 were counted manually in both ipsi- and contralateral quadrants of individual sections (Additional file 4 , Figure S4). Microglia were defined as activated if they displayed a clearly swollen cell body with reduced processes, these differ from normal or resting microglia where cell bodies are largely absent and large ramified processes are displayed. Assessment was performed by two independent blinded investigators, who quantified total number of activated microglia. For further analysis (Figure 1 ), numbers of activated microglia on the ipsilateral side were expressed as a percentage of the number on the contralateral side. Images for astrocyte (GFAP) grey intensity calculation were produced via capture on a Leica DMRB fluorescence microscope using a 40X 1.25NA oil immersion objective lens Images were acquired using Openlab (PerkinElmer) to control a Hamamamtsu Orca C4642-95 camera. For quantification of GFAP, single-plane images of the superficial dorsal horn of the spinal cord were acquired on the pre-described system using an identical exposure time of 100 ms. Background fluorescence was measured by taking an image of an area within the sample, using the parameters described above, which contained no labelled structures that was then subtracted from all images using IMAGE J (NIH open software with Macbiophotonics plugins). Following background subtraction, mean fluorescence grey intensity was determined for each image using IMAGE J. All image analysis, cell counts and fluorescence measurements were performed "off-line" on captured images taken from stained sections. All and counts were independently verified by a second experimentor.
RNA extraction and cDNA synthesis
Ipsilateral and contralateral spinal cord samples were dissected from MIA and saline-treated rats (n = 8 rats per group) and were frozen. Samples were homogenized in 2 ml of ice cold Tri reagent (Sigma-Aldrich, UK) and RNA purified according to the manufacturers' instructions. For cDNA synthesis, 100 ng of total RNA was reverse transcribed using M-MLV reverse transcriptase (Invitrogen) in a total reaction volume of 20 μl, as per the manufacturers' instructions. Reactions were incubated for 10 min at 25°C, 50 min at 37°C and the reaction terminated by incubation at 70°C for 15 min. Taqman quantitative real time polymerase chain reaction Gene expression was quantified utilising the relative standard curve method, based on Taqman quantitative real time polymerase chain reaction (qRT-PCR), as previously described [ 47 ]. Primers and probes were obtained from published work (GFAP - [ 48 ], β-actin - [ 49 ]), and synthesised by MWG Biotech, (Germany). Data are expressed as a ratio of gene expression levels with reference to β-actin. GFAP forward primer - 5- TGGCCACCAGTAACATGCAA-3, reverse primer - 5-CAGTTGGCGGCGATAGTCAT-3, Taqman probe - 5-CAGACGTTGCTTCCCGCAACGC-3. Β-actin forward primer - 5- AGGCCATGTACGTAGCCATCCA-3, reverse primer - 5- TCTCCGGAGTCCATCACAATG-3, Taqman probe - 5- TGTCCCTGTATGCCTCTGGTCGTACCAC -3.
Histology
Joint histology was conducted as previously described [ 10 ]. MIA- and saline-treated joints (day 28) were fixed in 10% formal saline and decalcified in an aqueous ethylenediaminetetraacetic acid (EDTA) solution (14% in distilled water; pH 7.0, 20°C). Samples were paraffin embedded and 5-8 μM sections of the central portion of the knee joint, in the coronal plane, were stained by safranin-O fast green to show matrix proteoglycan and overall joint morphology. Medial and lateral knee compartment tibial plateaux cartilage, tibial subchondral bone and joint synovium were scored as previously described [ 10 ].
Statistical Analyses
Statistical analyses comparing effects of MIA-treatment versus saline-treatment on weight-bearing and paw withdrawal thresholds were carried out using a 2-way ANOVA with a Bonferroni post hoc test. Statistical analyses comparing effects between treatment groups (nimesulide-treated versus vehicle-treated on weight bearing and paw withdrawal thresholds) were performed using a Kruskall-Wallis test with a Dunn's post hoc test and area under the curve analysis with a Mann Whitney test. Statistical analyses comparing the effect of minocycline versus vehicle on pain behaviour at day 28 post MIA-injection was performed using a Student's unpaired t Test. Statistical analyses of GFAP intensity used either a one-way or two-way ANOVA (as listed in figure legends) with a Bonferroni post hoc test. Statistical analyses of changes in number of activated microglia in the spinal dorsal horn of MIA versus saline-treated rats were performed using a Kruskall Wallis test with a Dunn's post hoc test. Statistical analysis of gene expression studies was performed using a Student's unpaired t Test. Correlations were performed using the 2-tailed Spearman's rank correlation.
Supplementary Material Additional file 1 Figure S1: MIA-induced pain behaviour . Intra-articular injection of MIA (1 mg/50 μl) produced significant decreases in (A) weight bearing on ipsilateral hind paw and (B) hindpaw mechanical withdrawal thresholds in the ipsilateral limb of rats compared to saline-treated rats. Data are expressed as mean ± SEM.
Statistical analyses comparing
MIA and saline-treated rats were performed using a two way ANOVA with a Bonferroni post hoc test, ***p < 0.001. Click here for file Additional file 2 Figure S2: Positively identified spinal microglia and GFAP immunofluorescence in the saline-treated rats . A: Positively identified spinal microglia in the ipsilateral and contralateral spinal cord of saline-treated rats at day 28. B: GFAP immunofluorescence in the ipsilateral and contralateral spinal cord of saline-treated rats at day 28. Click here for file Additional file 3 Figure S3: Spinal GFAP gene expression in MIA-treated rats . GFAP mRNA in the ipsilateral and contralateral spinal cord of saline and MIA-treated rats at day 28. Data are normalised to levels of β-actin and expressed as mean ± SEM.
Statistical comparison between
MIA and saline-treated rats was performed using a Student's unpaired t test. Click here for file Additional file 4 Figure S4: Schematic of the areas of spinal cord used for quantification . Lumbar sections 3-5 of the spinal cord, red box (illustrates the area of analysis for Iba-1) and the blue box (illustrates the area of analysis for GFAP). Note images were captured from both sides of the spinal cord for microglia and astrocytes. Adapted from: Molander, C. and Grant, G., 1995, spinal cord cytoarchitecture. In G. Paxinoa (Ed), The Nervous System, Second Edition, Academic Press, San Diego. Click here for file
📊 Figures
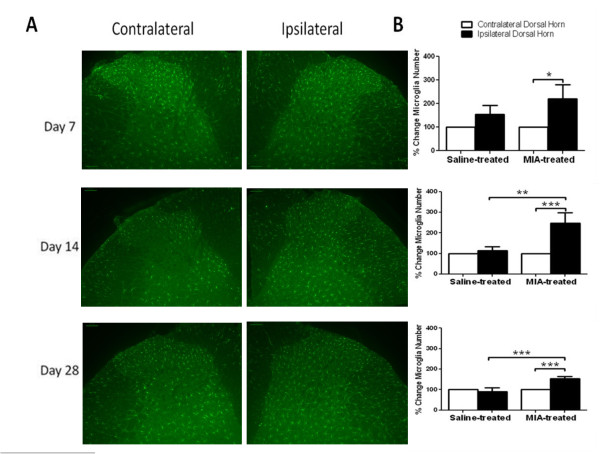
Figure 1
Timecourse of spinal microglia activation in MIA-treated rats . (A) Positively identified spinal microglia were increased in the ipsilateral spinal cord of MIA-treated rats at days 7, 14 and 28, when ...
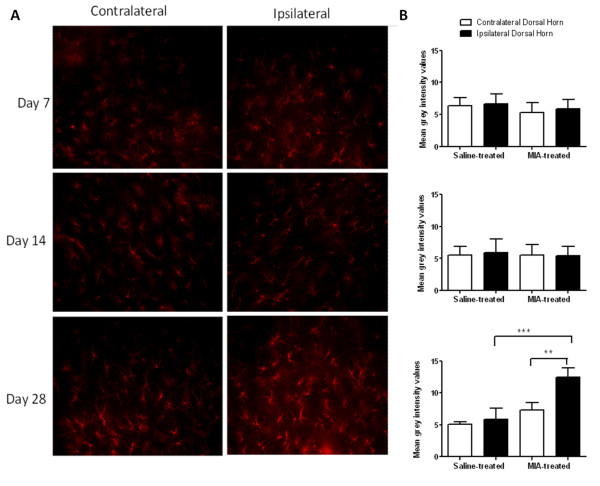
Figure 2
Timecourse of spinal astrocyte activation in MIA-treated rats . A: GFAP immunofluorescence, as a marker of astrocytes, was increased in the ipsilateral spinal cord of MIA-treated rats at day 28 post M...
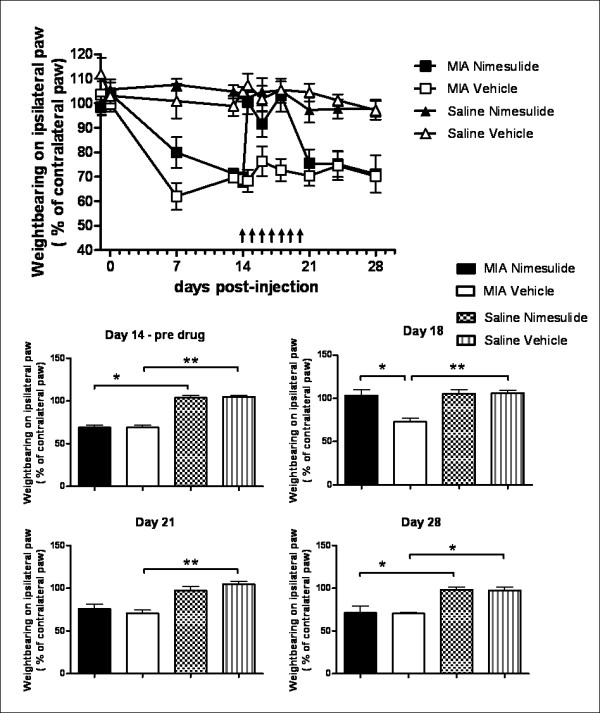
Figure 3
Nimesulide attenuates established weight bearing deficits in MIA-treated rats . A: Timecourse of the effects of repeated oral administration of nimesulide (10 mg.kg -1 ; days 14-20) on weight bearing ...
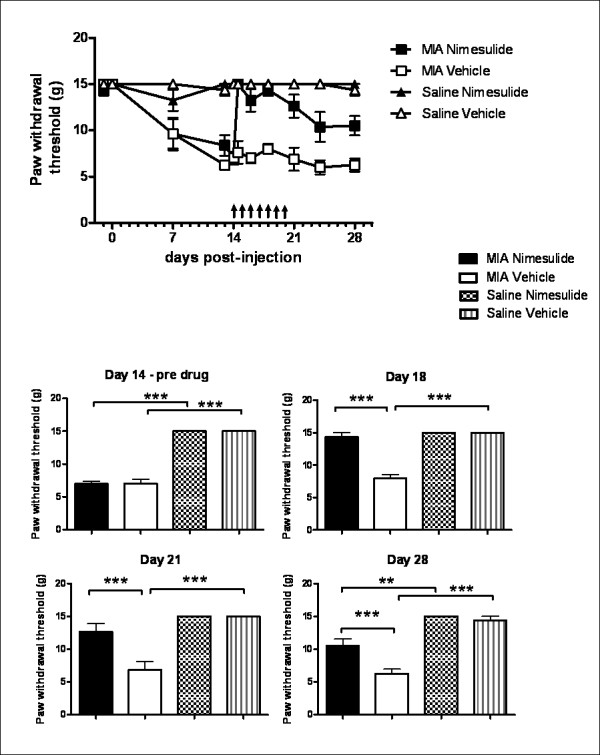
Figure 4
Nimesulide attenuates established allodynia in MIA-treated rats . A: Timecourse of the effects of repeated oral administration of nimesulide (10 mg.kg -1 ; days 14-20) or vehicle on mechanical withdra...
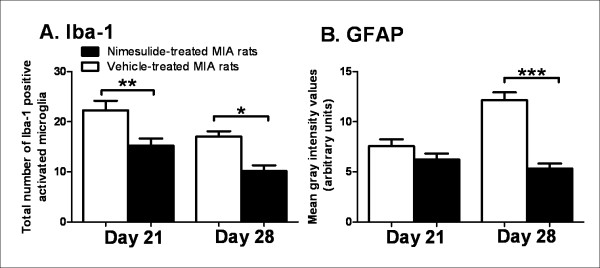
Figure 5
Nimesulide attenuates microglia and astrocyte activation in MIA-treated rats . A: Repeated administration of nimesulide (10 mg.kg -1 ; days 14-20) significantly attenuated MIA-induced increases in Iba...
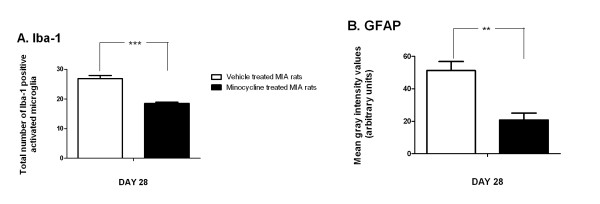
Figure 6
Minocycline attenuates microglia and astrocyte activation in MIA-treated rats . A: Minocycline treatment (30 mg.kg -1 ) significantly attenuated MIA-induced increases in Iba-1 positive activated micro...
Figure images are served from the NIH/NLM PubMed Central Open Access Subset or Europe PMC; copyright remains with the publishers and authors.
💬 Discussion
0 commentsNo comments yet. Be the first to start a discussion!
Leave a Comment