Abstract
gp130 is a shared signal-transducing membrane-associated receptor for several hematopoietic cytokines. The 30 A resolution cryo-electron microscopy (cryo-EM) structure of the Interleukin 11(IL-11)-IL-11 Receptor-gp130 extracellular complex reveals the architecture and dynamics of this gp130-containing signaling complex. Normal-mode analysis reveals a repertoire of conformational changes that could function in signal triggering. This suggests a concerted mechanism of signaling involving all the components of the complex. This could provide a general mechanism of signal transfer for cytokines utilizing the JAK-STAT signaling cascade.
🔬 Techniques
🔭 Microscopes
🧬 Organisms
🧪 Sample Preparation
🔬 Cell Lines
🏭 Microscope Brands
💻 Software Details
💾 Data Repositories
🏛️ Research Organizations (ROR)
Affiliated research institutions:
📋 Methods
Expression and Purification of the IL-11-IL-11R-gp130 Complex Murine
IL-11 (residues 22–199) was subcloned into the pET15b vector (Novagen), and the His 6 -tagged fusion protein, expressed in E . coli , was purified by metal-chelating affinity chromatography (TALON, Clonetech). The extracellular regions of murine IL-11R (residues 1–361) and gp130 (residues 1–617) were expressed as secreted, soluble, C-terminally tagged Fc fusion constructs in stably transfected Drosophila S2 cells and transiently transfected human epithelial kidney 293T cells, respectively. Both soluble receptors were purified from the media by adsorption to protein A Sepharose (Amersham Biosciences) and were eluted from the matrix after on-column cleavage with the rhinovirus 3C protease. The three affinity-purified subunits were mixed with IL-11 in molar excess and concentrated, and the complex was purified by gel filtration with the Superdex 200 (10/30) column (Amersham Biosciences). The purified complex used for cryo-EM imaging was in a buffer of 5 mM HEPES (pH 7.5), 100 mM NaCl, 1 mM DTT, and 0.25% β-octylglucopyranoside.
Cryo-Microscopy and Three-Dimensional Image Processing Purified
IL-11H, at a concentration of 1 mg/ml, was applied to a holey carbon film and freeze plunged into liquid ethane after blotting off excess fluid. The vitrified samples were imaged in a Philips CM200 FEG at liquid nitrogen temperatures by using a Gatan 626 cryoholder and cryotransfer system. Images were taken at defocus values ranging from 3 to 5 μm and at an electron optical magnification of 50,000. Micrographs were digitized by using a UMAX Powerlook 3000 at a step size of 8.3 μm, corresponding to 1.67 Å on the specimen scale. This resulted in 160 × 160 pixel IL-11H images. These images were binned by a factor of 2 for final analysis, resulting in a pixel sampling distance of 3.3 Å. Image processing was performed with the IMAGIC-5 software package ( van Heel et al., 1996 ). The full data set consisted of 830 images from 15 micrographs. The IL-11H particles were interactively selected by using the DISPLAY module. CTF compensation was performed on images as described ( Matadeen et al., 1999 ). The reconstruction was calculated de novo; the images were first aligned by using the reference-free alignment-by-classification procedure, followed by multistatistical analysis (MSA) ( van Heel, 1989 ). Averages of the data set were used to center the images within the data set; three rounds of iteration were performed. MSA was then used to generate class averages. Initially, 40 class averages were generated and used for further center refinement by using multireference alignment (MRA). The images were subjected to five cycles of MRA and MSA. Relative orientations of ten averaged images (those with the lowest variance) were determined by using angular reconstitution ( van Heel, 1987 ). The orientations obtained were used to calculate a three-dimensional map by using the exact filter back-projection algorithm ( Harauz and van Heel, 1986 ). Projections from the map were compared to their corresponding averages as a measure of the consistency of the analysis. A total of 70 projections were calculated from the map and were used in a new round of MRA followed by MSA. From 100 averages, 50 (consisting of a total of 622 particles) were selected for angular reconstitution, and a new three-dimensional map was calculated by using the resultant orientations. The process of analysis was iteratively refined until stability in alignment, resulting orientations, and FSC were observed. Fitting of the IL-11H Model The X-ray crystallographic model of the IL-6 cytokine-binding complex ( Boulanger et al., 2003b ) together with six FNIII repeats ( Sharma et al., 1999 ) were manually docked into the IL-11H cryo-EM map by using the program “O” ( Kleywegt and Jones, 1997 ). The fitting refinement procedure was performed in URO ( Navaza et al., 2002 ). This program uses an adapted rigid-body refinement to perform the fitting of molecular models to EM reconstructions in reciprocal space. Six positional variables are used in the refinement (Euler angles α, β, and γ and translational parameters x, y, and z). Data from 260 Å to 30 Å were used in the refinement procedure. Four optimization cycles were performed until no shifts in the coordinates were observed.
Show full methods section
Expression and Purification of the IL-11-IL-11R-gp130 Complex Murine
IL-11 (residues 22–199) was subcloned into the pET15b vector (Novagen), and the His 6 -tagged fusion protein, expressed in E . coli , was purified by metal-chelating affinity chromatography (TALON, Clonetech). The extracellular regions of murine IL-11R (residues 1–361) and gp130 (residues 1–617) were expressed as secreted, soluble, C-terminally tagged Fc fusion constructs in stably transfected Drosophila S2 cells and transiently transfected human epithelial kidney 293T cells, respectively. Both soluble receptors were purified from the media by adsorption to protein A Sepharose (Amersham Biosciences) and were eluted from the matrix after on-column cleavage with the rhinovirus 3C protease. The three affinity-purified subunits were mixed with IL-11 in molar excess and concentrated, and the complex was purified by gel filtration with the Superdex 200 (10/30) column (Amersham Biosciences). The purified complex used for cryo-EM imaging was in a buffer of 5 mM HEPES (pH 7.5), 100 mM NaCl, 1 mM DTT, and 0.25% β-octylglucopyranoside.
Cryo-Microscopy and Three-Dimensional Image Processing Purified
IL-11H, at a concentration of 1 mg/ml, was applied to a holey carbon film and freeze plunged into liquid ethane after blotting off excess fluid. The vitrified samples were imaged in a Philips CM200 FEG at liquid nitrogen temperatures by using a Gatan 626 cryoholder and cryotransfer system. Images were taken at defocus values ranging from 3 to 5 μm and at an electron optical magnification of 50,000. Micrographs were digitized by using a UMAX Powerlook 3000 at a step size of 8.3 μm, corresponding to 1.67 Å on the specimen scale. This resulted in 160 × 160 pixel IL-11H images. These images were binned by a factor of 2 for final analysis, resulting in a pixel sampling distance of 3.3 Å. Image processing was performed with the IMAGIC-5 software package ( van Heel et al., 1996 ). The full data set consisted of 830 images from 15 micrographs. The IL-11H particles were interactively selected by using the DISPLAY module. CTF compensation was performed on images as described ( Matadeen et al., 1999 ). The reconstruction was calculated de novo; the images were first aligned by using the reference-free alignment-by-classification procedure, followed by multistatistical analysis (MSA) ( van Heel, 1989 ). Averages of the data set were used to center the images within the data set; three rounds of iteration were performed. MSA was then used to generate class averages. Initially, 40 class averages were generated and used for further center refinement by using multireference alignment (MRA). The images were subjected to five cycles of MRA and MSA. Relative orientations of ten averaged images (those with the lowest variance) were determined by using angular reconstitution ( van Heel, 1987 ). The orientations obtained were used to calculate a three-dimensional map by using the exact filter back-projection algorithm ( Harauz and van Heel, 1986 ). Projections from the map were compared to their corresponding averages as a measure of the consistency of the analysis. A total of 70 projections were calculated from the map and were used in a new round of MRA followed by MSA. From 100 averages, 50 (consisting of a total of 622 particles) were selected for angular reconstitution, and a new three-dimensional map was calculated by using the resultant orientations. The process of analysis was iteratively refined until stability in alignment, resulting orientations, and FSC were observed. Fitting of the IL-11H Model The X-ray crystallographic model of the IL-6 cytokine-binding complex ( Boulanger et al., 2003b ) together with six FNIII repeats ( Sharma et al., 1999 ) were manually docked into the IL-11H cryo-EM map by using the program “O” ( Kleywegt and Jones, 1997 ). The fitting refinement procedure was performed in URO ( Navaza et al., 2002 ). This program uses an adapted rigid-body refinement to perform the fitting of molecular models to EM reconstructions in reciprocal space. Six positional variables are used in the refinement (Euler angles α, β, and γ and translational parameters x, y, and z). Data from 260 Å to 30 Å were used in the refinement procedure. Four optimization cycles were performed until no shifts in the coordinates were observed.
Representation of the IL-11H Cryo-EM Map and Model
Volume rendering and density representation were performed in Opendx ( http://www.opendx.org ) and pymol ( DeLano, 2002 ). For final representation of the results, the high-frequency components of the three-dimensional map are suppressed by a Gaussian low-pass filter with a 1/e width corresponding to ∼30 Å. Figure 4 was prepared with RASMOL ( Sayle and Milner-Whilte, 1995 ), BOBSCRIPT ( Esnouf, 1997 ), and RASTER3D ( Merritt and Bacon, 1997 ). The codebook vectors were calculated by using the qvol program in Situs ( Wriggers et al., 1999 ). A total of 50 codebook vectors were calculated, and the resultant discretized map was subjected to NMA with the ElNemo web server ( http://igs-server.cnrs-mrs.fr/elnemo/ ) by using a cut-off value of 30 Å.
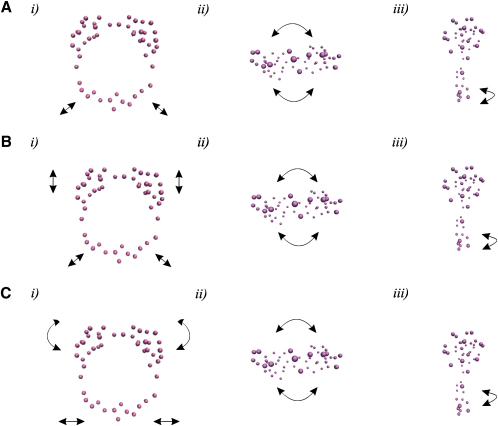
Supplemental Data Movie S1. Dynamics of the IL11H calculated from NMA: Mode 1 Three orthogonal views of the discrete map of the IL11H, composed of 50 codebook vectors (purple spheres) are shown for each of the three lowest frequency normal modes (Movies S1, S2, and S3, respectively). Movie S2. Dynamics of the IL11H calculated from NMA: Mode 2 Movie S3. Dynamics of the IL11H calculated from NMA: Mode 3
📊 Figures
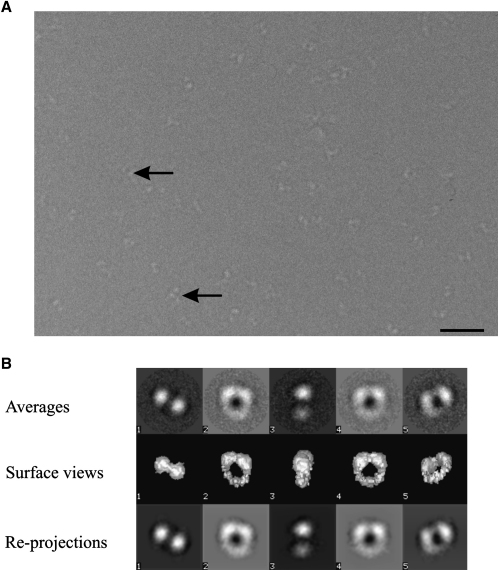
Figureu00a01
Cryo-EM of the IL-11-IL-11R-gp130 Complex (A) Part of a typical electron micrograph of the purified IL-11-IL-11R-gp130 complex. Arrows identify examples of the complexes within vitreous ice. The scale...
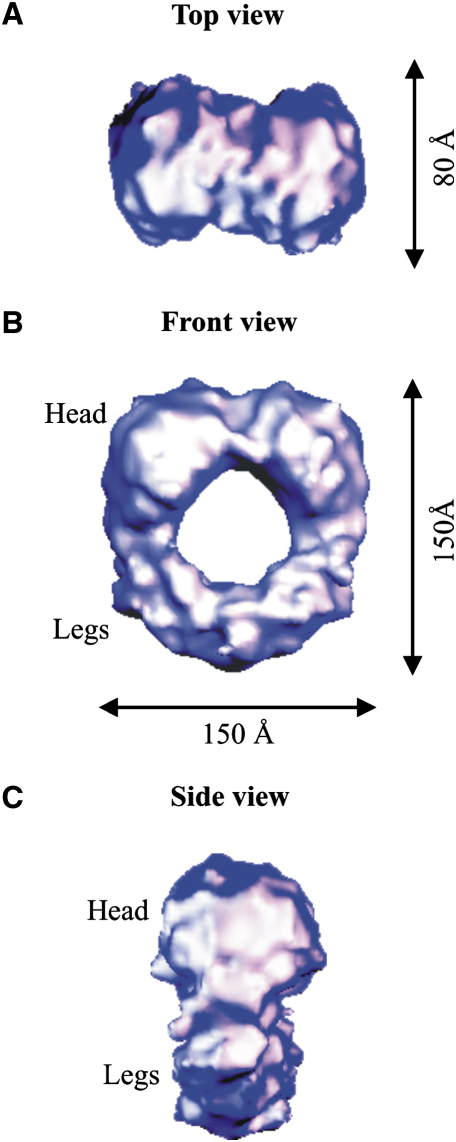
Figureu00a02
Orthogonal Views of the IL-11H Complex (Au2013C) The (A) top, (B) front, and (C) side views of the IL-11H complex are contoured at 2.5u03c3.
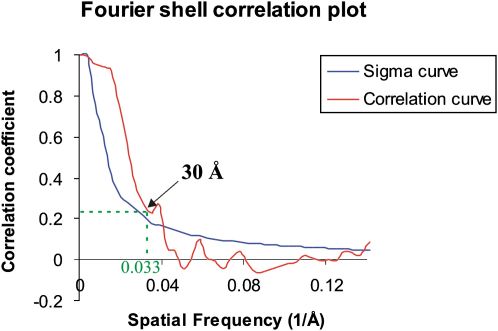
Figureu00a03
Fourier Shell Correlation Plot from the IL-11H Data Set Fourier shell correlation curve from the IL-11H data set is shown in red plot. The 3u03c3 threshold curve is multiplied by u221a2 = 1.41 to acco...
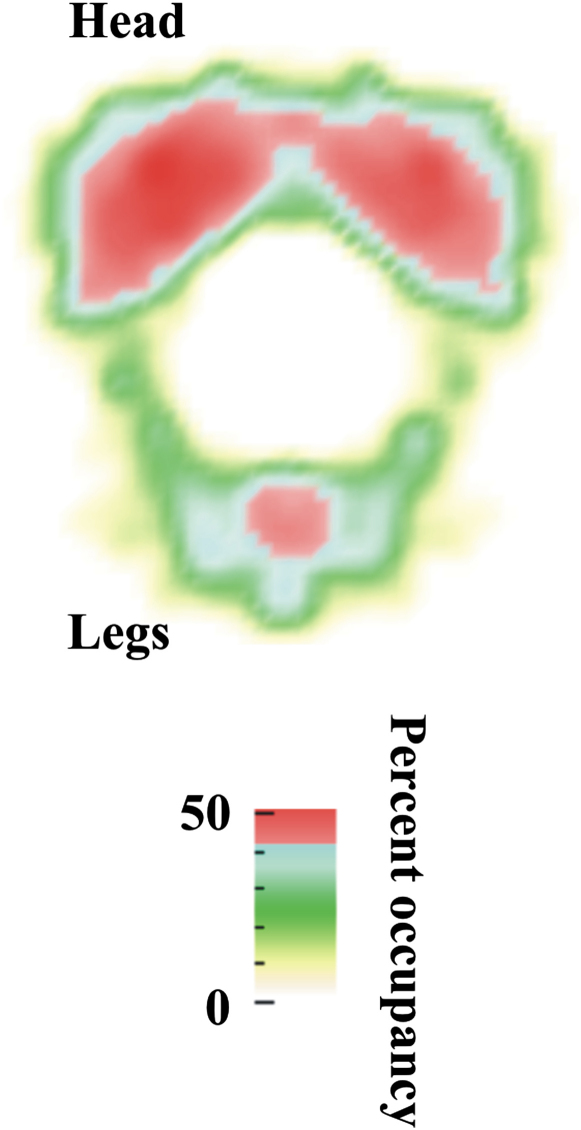
Figureu00a04
Density Distribution in the Cryo-EM Map Percent occupancy is defined as the density distribution relative to the highest density in the map. The density is strongest at the head and central region of ...
Figureu00a05
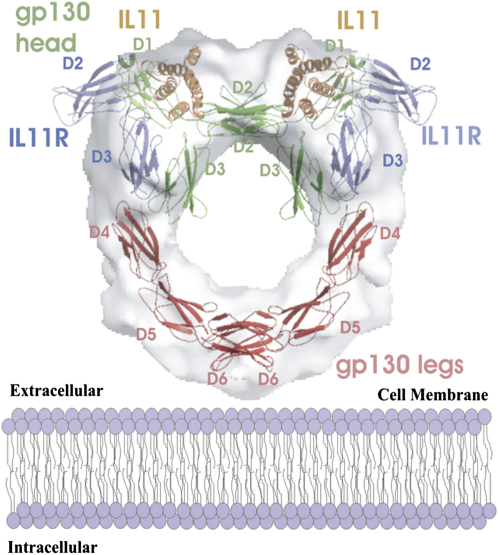
Fitting of the IL-6-IL-6R-gp130 Model into the Cryo-EM Density The cryo-EM map is shown as a gray, semitransparent surface. The fitted model is shown as a ribbon representation. The IL-6 cytokines (re...
Figureu00a06
Schematic of the Movements of IL-11H Calculated from NMA Three orthogonal views ( i , ii , iii ) of the discrete map of IL-11H, composed of 50 codebook vectors (purple spheres), are shown for the thre...
Figure images are served from the NIH/NLM PubMed Central Open Access Subset or Europe PMC; copyright remains with the publishers and authors.
💬 Discussion
0 commentsNo comments yet. Be the first to start a discussion!
Leave a Comment