Abstract
Despite abundant knowledge of the regulation and biochemistry of glycolytic enzymes, we have limited understanding on how they are spatially organized in the cell. Emerging evidence indicates that nonglycolytic metabolic enzymes regulating diverse pathways can assemble into polymers. We now show tetramer- and substrate-dependent filament assembly by phosphofructokinase-1 (PFK1), which is considered the "gatekeeper" of glycolysis because it catalyzes the step committing glucose to breakdown. Recombinant liver PFK1 (PFKL) isoform, but not platelet PFK1 (PFKP) or muscle PFK1 (PFKM) isoforms, assembles into filaments. Negative-stain electron micrographs reveal that filaments are apolar and made of stacked tetramers oriented with exposed catalytic sites positioned along the edge of the polymer. Electron micrographs and biochemical data with a PFKL/PFKP chimera indicate that the PFKL regulatory domain mediates filament assembly. Quantified live-cell imaging shows dynamic properties of localized PFKL puncta that are enriched at the plasma membrane. These findings reveal a new behavior of a key glycolytic enzyme with insights on spatial organization and isoform-specific glucose metabolism in cells.
🔬 Techniques
🔭 Microscopes
🧬 Organisms
💻 Software
✨ Fluorophores
🧪 Sample Preparation
🏭 Microscope Brands
🧪 Reagent Suppliers
📷 Detectors
🔎 Objectives
💻 Software Details
🏛️ Research Organizations (ROR)
Affiliated research institutions:
📋 Methods
Cloning, expression, and purification of recombinant human PFK1 isoforms The Homo sapiens cDNA encoding the 780-amino-acid isoform b of PFKL ( NP_002617 ) and the 780-amino-acid isoform 2 of the muscle isoform PFKM ( NP_000280 ) were cloned into pFastBac HTa or pFastBac HTb vectors, respectively. PFKL point mutants at the sugar substrate binding site H199Y and at the tetramer interface F638R were generated by using a commercially available site-directed mutagenesis kit (QuikChange Lightning; Agilent Technologies). DNA primers were designed using an online primer design tool (Agilent Technologies) and were purchased from Elim Biopharmaceuticals. Cloning of human PFKP was previously described ( Webb et al., 2015 ). The chimera of PFKP and PFKL was generated by Gibson Assembly (New England Biolabs, Inc.). Baculovirus expression and PFK1 purification were performed as previously described ( Webb et al., 2015 ). In brief, 200–500 million sf21 cells were used to express PFK1 at a multiplicity of infection of 2 for 48 h. Cells were pelleted by low-speed centrifugation (1,000 g ), then media was discarded, and pellets were stored at −80°C until the time of purification. Cell pellets were defrosted on ice, resuspended in 50 ml lysis buffer per 200 million cells (20 mM Tris-HCl, pH 7.5, 50 mM potassium phosphate, 1 mM 2-mercaptoethanol, 10% glycerol, 10 mM imidazole, and cOmplete Protease Inhibitor Cocktail [Roche]). Cells were lysed with ∼15 passes of a Dounce homogenizer, and debris was removed by centrifugation. The supernatant was incubated with Talon resin (Takara Bio Inc.) and then washed with 20 bed volumes of lysis buffer, and PFK1 was eluted with a minimal volume of elution buffer (lysis buffer with 100 mM imidazole). Fractions containing protein were pooled and dialyzed into a buffer containing 20 mM Hepes, pH 7.5, 100 mM potassium chloride, 1 mM dithiothreitol, 1 mM ATP, 1 mM magnesium chloride, and 5% glycerol. Protein concentration was determined using a Bradford Protein Assay kit (Thermo Fisher Scientific). After purification, PFK1 was stored on ice in a 4°C fridge. The sequences of PFKL, PFKP, and CatP/RegL were aligned using Clustal Omega ( Sievers et al., 2011 ).
Show full methods section
Cloning, expression, and purification of recombinant human PFK1 isoforms The Homo sapiens cDNA encoding the 780-amino-acid isoform b of PFKL ( NP_002617 ) and the 780-amino-acid isoform 2 of the muscle isoform PFKM ( NP_000280 ) were cloned into pFastBac HTa or pFastBac HTb vectors, respectively. PFKL point mutants at the sugar substrate binding site H199Y and at the tetramer interface F638R were generated by using a commercially available site-directed mutagenesis kit (QuikChange Lightning; Agilent Technologies). DNA primers were designed using an online primer design tool (Agilent Technologies) and were purchased from Elim Biopharmaceuticals. Cloning of human PFKP was previously described ( Webb et al., 2015 ). The chimera of PFKP and PFKL was generated by Gibson Assembly (New England Biolabs, Inc.). Baculovirus expression and PFK1 purification were performed as previously described ( Webb et al., 2015 ). In brief, 200–500 million sf21 cells were used to express PFK1 at a multiplicity of infection of 2 for 48 h. Cells were pelleted by low-speed centrifugation (1,000 g ), then media was discarded, and pellets were stored at −80°C until the time of purification. Cell pellets were defrosted on ice, resuspended in 50 ml lysis buffer per 200 million cells (20 mM Tris-HCl, pH 7.5, 50 mM potassium phosphate, 1 mM 2-mercaptoethanol, 10% glycerol, 10 mM imidazole, and cOmplete Protease Inhibitor Cocktail [Roche]). Cells were lysed with ∼15 passes of a Dounce homogenizer, and debris was removed by centrifugation. The supernatant was incubated with Talon resin (Takara Bio Inc.) and then washed with 20 bed volumes of lysis buffer, and PFK1 was eluted with a minimal volume of elution buffer (lysis buffer with 100 mM imidazole). Fractions containing protein were pooled and dialyzed into a buffer containing 20 mM Hepes, pH 7.5, 100 mM potassium chloride, 1 mM dithiothreitol, 1 mM ATP, 1 mM magnesium chloride, and 5% glycerol. Protein concentration was determined using a Bradford Protein Assay kit (Thermo Fisher Scientific). After purification, PFK1 was stored on ice in a 4°C fridge. The sequences of PFKL, PFKP, and CatP/RegL were aligned using Clustal Omega ( Sievers et al., 2011 ).
PFK1 activity assays
PFK1 activity was determined using an auxiliary enzyme assay ( Brüser et al., 2012 ) with kinetic analysis using 200-µl reactions containing 50 mM Tris-HCl, pH 7.4, 100 mM KCl, 10 mM MgCl 2 , 0.15 mM NADH, 0.675 U/ml aldolase, 5 U/ml triosephosphate isomerase, and 2 U/ml glycerol phosphate dehydrogenase. ATP and F6P were used as indicated. Auxiliary enzymes were desalted using an Amicon Ultracel-10K Centrifugal Filter Unit (EMD Millipore) before use. The temperature was equilibrated to 25°C for 10 min before initiating the reaction with the addition of magnesium chloride. The absorbance at 340 nm was measured using a SpectraMax M5 microplate reader (Molecular Devices). Kinetic parameters were generated by linear regression analysis of the Michalas-Menton or Hill equations using Prism (GraphPad Software) and are the mean of a minimum of three measurements from two independent preparations of protein. One unit of activity was defined as the amount of enzyme that catalyzed the formation of 1 mmol of fructose 1,6-bisphosphate per minute at 25°C. TEM 20 µl of 50 µg/ml PFK1 was applied to glow-discharged carbon-coated grids and stained with 2% (wt/vol) uranyl acetate. Grids were examined and photographed with a 100CX II transmission electron microscope (JEOL). For estimation of size of PFK1 particles and filaments, the length and width of individual particles from TEM images were measured using FIJI software (ImageJ; National Institutes of Health; Schindelin et al., 2012 ). The mean length and width ± SD are reported. 3D EM For both PFKL and the PFKP/PFKL chimera, purified protein was concentrated to 0.5 mg/ml. Final concentrations of 2 mM F6P and 20 mM (NH 4 )SO 4 were then added to the protein, and the assembly reaction was left to proceed for 10 min at room temperature. 3.5 µl of this reaction mixture was then spotted onto a 400 mesh glow-discharged copper-coated grid using a 0.7% uranyl formate solution. Electron micrographs were acquired on a Tecnai T12 microscope (FEI) operating at 120 kV at 52,000× magnification on a Gatan US4000 charge-coupled device camera with a 2.07 Å/px. For both reconstructions, images were collected with Leginon ( Suloway et al., 2005 ). Contrast transfer function (CTF) parameters were estimated using CTFFIND3 ( Rohou and Grigorieff, 2015 ) with a defocus range of 0.6–1.4 µm. Polymer assemblies were manually picked in Appion ( Lander et al., 2009 ). Particle boxing was performed in Appion using a 240-px box with an 80-Å helical step for both constructs, and CTF correction was performed by phase-flipping. For PFKL, 297 images were acquired, resulting in 25,364 segments corresponding with ∼31,700 phosphofructokinase tetramers. For CatP/RegL, 96 images were acquired, resulting in 5,206 segments corresponding with ∼6,500 PFK tetramers. 2D classification was performed in Relion ( Scheres, 2012 ), and poorly behaved classes (poorly defined features or obvious kinks in the filament) were excluded from 3D reconstructions. The final datasets consisted of 9,324 segments for PFKL and 5,206 segments for CatP/RegL. The Iterative Helical Real Space Reconstruction (IHRSR) method ( Egelman, 2010 ) in Spider ( Shaikh et al., 2008 ) was used for helical reconstruction. We modified the standard IHRSR protocol for gold-standard refinement, with all overlapping segments from a given filament assigned to the same half group to prevent overfitting. For the CatP/RegL reconstruction, a featureless cylinder was subject to 26 rounds of gold-standard refinement ( Scheres and Chen, 2012 ). This resulted in a 26-Å converged map, with 221.6° azimuthal rotation and 83 Å helical rise as the final helical parameters. For the PFKL reconstruction, the final PFKP/PFKL map filtered to 50 Å was used as an initial model for gold-standard refinement. After 15 rounds, this resulted in a 25-Å converged map, with 221.5° azimuthal rotation and 82.8 Å helical rise as the final helical parameters. 90° light scattering PFK1 polymerization was measured by 90°-angle light scattering in a Shimadzu RF-5301PC spectrofluorophotometer with 350-nm excitation and emission wavelengths and 1.5-nm slit width at 25°C. PFK1 was added at a final concentration up to 500 µg/ml (6 µM) as specified. Data were collected for ∼2 min to establish a baseline. Buffer or F6P was added to the cuvette from a 50× stock and gently mixed by pipetting. The elapsed time for the addition of substrate was ∼20 s. The reading at time 0 was the first reading after the addition of buffer or F6P with data collected every second. The change in light scattering relative to the maximal signal was plotted as a function of time. Plasmid generation, transfection, cell culture, and microscopy To generate PFK1 constructs with a carboxy-terminal EGFP tag, cDNA for wild-type and mutant PFKL and wild-type PFKP were cloned into pEGFP N2 and N1 vectors, respectively. The integrity of EGFP-tagged PFK1 was confirmed by Western blot analysis of total cell lysates of 293 FT cells using rabbit anti-GFP (A-11122; 1DB-001-0000868907; Invitrogen) and mouse anti-actin clone C4 (MAB1501; 1DB-001-0000850281; EMD Millipore) antibodies (Fig. S3 E). MTLn3 rat mammary adenocarcinoma cells ( Segall et al., 1996 ) were maintained in high-glucose MEM α media supplemented with 10% heat-inactivated fetal bovine serum and 1× penicillin/streptomycin at 37°C and 5% CO 2 . Cells were tested for mycoplasma contamination before use (DNA Diagnostics Center). Fluorescently tagged PFK1 constructs were expressed by transfecting plasmid DNA into cells using FuGENE HD (Promega) as previously described ( Webb et al., 2015 ). Cells were treated with 1 mM 2-deoxyglucose (Sigma-Aldrich) in cOmplete growth medium for 23 h. For acute treatment of cells with 10 mM citrate (Sigma-Aldrich), citrate was added from a 1 M, pH 7.4, stock directly to growth medium. For live-cell microscopy, cells were grown in 35-mm glass-bottom dishes (MatTek Corporation). TIRF images were acquired on a 37°C environmentally controlled inverted microscope stand (T i ; Nikon) equipped with a motorized TIRF illuminator (Nikon), an iXon electron-multiplying charge-coupled device camera (Andor Technology), and a 100× 1.49 NA CFI Apochromat TIRF objective (Nikon) using 1.5× intermediate magnification optimized for live-cell imaging. Confocal images were acquired with a 60× Plan Apochromat TIRF objective (Nikon) 1.49 NA oil immersion objective on an inverted microscope system (Eclipse T i Perfect Focus System; Nikon) equipped with a spinning-disk confocal scanner unit (Borealis-modified CSU-X1; Yokogawa Electric Corporation; Spectral Applied Research), a multipoint stage (MS-2000; Applied Scientific Instruments), and a cMyo cooled charge-coupled device camera (Photometrics; Stehbens et al., 2012 ). All microscope hardware was controlled by NIS Elements software 4.5 (Nikon), and image processing and analysis was performed in NIS Elements. Stationary PFKL-EGFP particles were identified by 1- or 5-s rolling averages generated by the “ND Image Average” function of NIS Elements. The lifetime of docked particles was estimated to be the time between the half-maximum intensities in 2 × 2–pixel regions of interest in which fluorescence intensity was measured as a function of time. The histogram and the log-logistic curve fit of the lifetime distribution was calculated in MATLAB (MathWorks). Kymographs were generated from the “Show Slices View” in NIS Elements by building a stack of y-t views and displaying a maximum-intensity projection of 3–4 y-t views to suppress image noise essentially as described ( Stehbens et al., 2014 ). Final figures were assembled in Illustrator CS5 (Adobe). Online supplemental material Fig. S1 shows the activity, TEM, and light scattering of purified recombinant wild-type and mutant PFK1. Fig. S2 shows the determination of the PFKL filament structure. Fig. S3 shows the sequence, purification, and activity of CatP/RegL, size distribution of CIP, and immunoblot of PFK1-EGFP constructs. Video 1 shows how PFKL-EGFP forms dynamic particles with punctate localization in cells and corresponds with Fig. 4 (A–D) . Video 2 shows how PFKP-EGFP is diffuse in cells and corresponds with Fig. 4 E . Video 3 shows how CatP/RegL-EGFP forms dynamic particles with punctate localization in cells and corresponds with Fig. 4 E . Video 4 shows how citrate reversibly induces the formation of large PFKL-EGFP punctae and corresponds with Fig. 5 A .
Online supplemental material Fig. S1 shows the activity, TEM, and light scattering of purified recombinant wild-type and mutant PFK1. Fig. S2 shows the determination of the PFKL filament structure. Fig. S3 shows the sequence, purification, and activity of CatP/RegL, size distribution of CIP, and immunoblot of PFK1-EGFP constructs. Video 1 shows how PFKL-EGFP forms dynamic particles with punctate localization in cells and corresponds with Fig. 4 (A–D) . Video 2 shows how PFKP-EGFP is diffuse in cells and corresponds with Fig. 4 E . Video 3 shows how CatP/RegL-EGFP forms dynamic particles with punctate localization in cells and corresponds with Fig. 4 E . Video 4 shows how citrate reversibly induces the formation of large PFKL-EGFP punctae and corresponds with Fig. 5 A .
Supplementary Material Supplemental Materials (PDF) Video 1 Video 2 Video 3 Video 4
📊 Figures
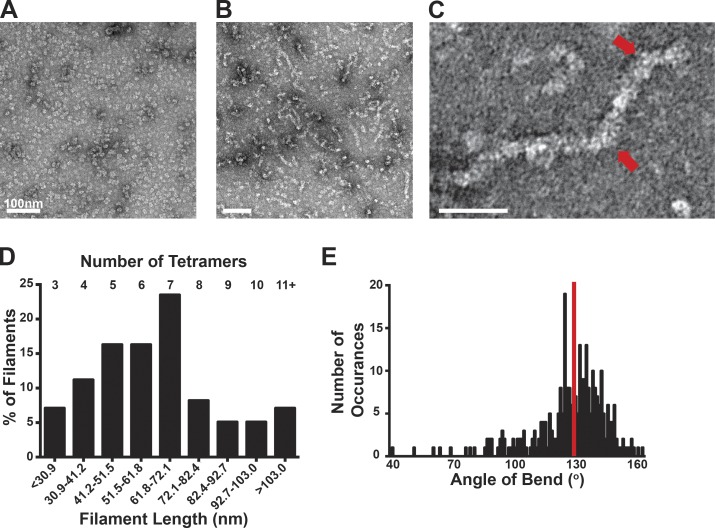
Figure 1.
PFKL forms filaments of stacked tetramers. (A and B) TEM images of PFKL in control buffer (A) and in buffer containing 2 mM F6P (B). (C) Higher-magnification TEM image of a PFKL filament in the presen...
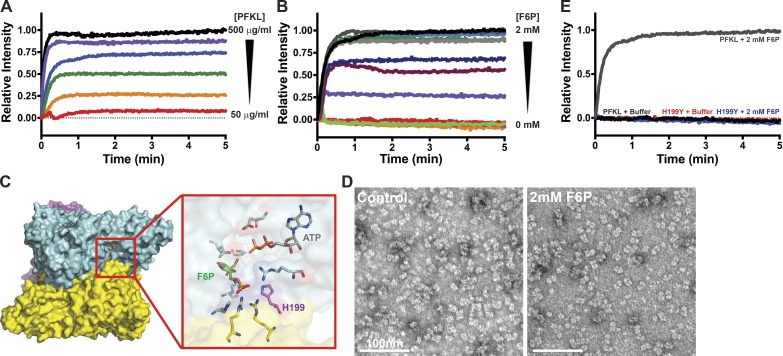
Figure 2.
PFKL filament formation is concentration- and F6P-dependent. (A) 90u00b0 light scattering of 50u2013500 u00b5g/ml PFKL upon the addition of 2 mM F6P at time 0. Red, 50 u00b5g/ml; orange, 100 u00b5g/ml...
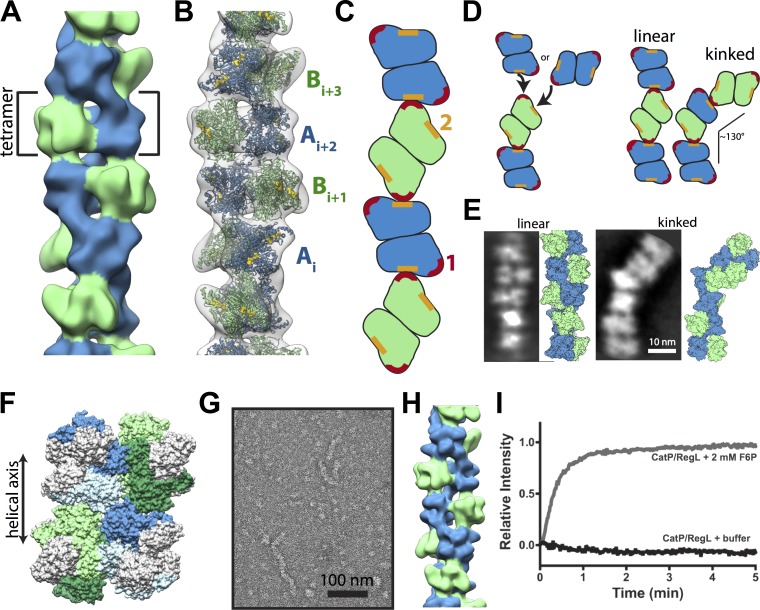
Figure 3.
Architecture of PFKL filament. (A) Negative-stain 3D reconstruction of the PFKL at 25-u00c5 resolution. The PFKL tetramer is the repeating helical unit. Dimers on each half of the tetramer, colored bl...
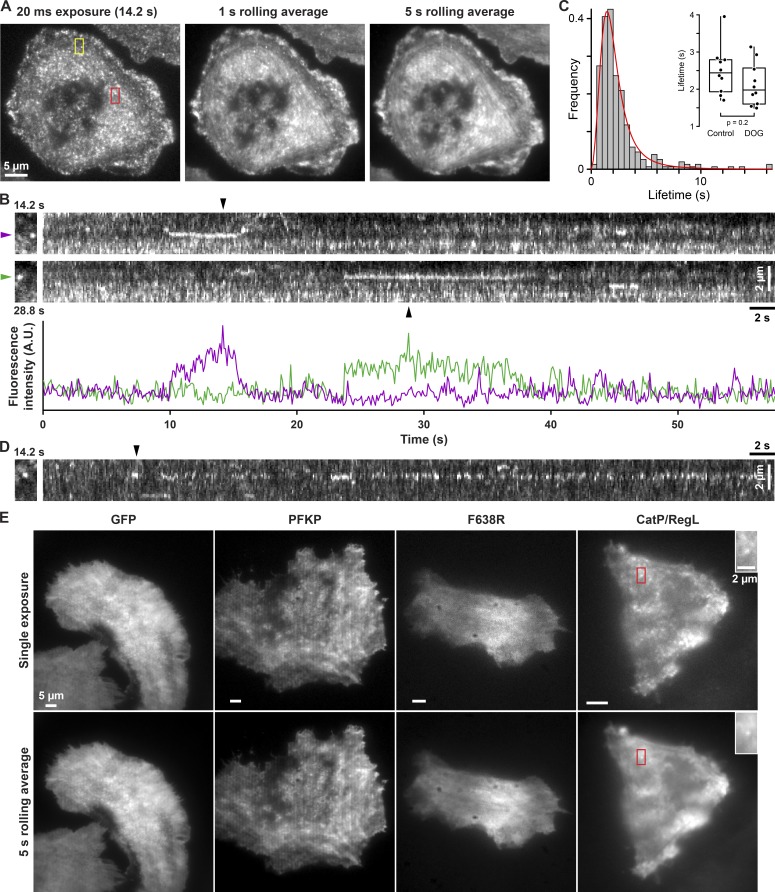
Figure 4.
PFKL forms dynamic particles in MTLn3 rat breast cancer cells. (A) TIRF image of PFKL-EGFP expressing MTLn3 rat mammary adenocarcinoma cell from a time-lapse sequence acquired at 10 frames per second ...
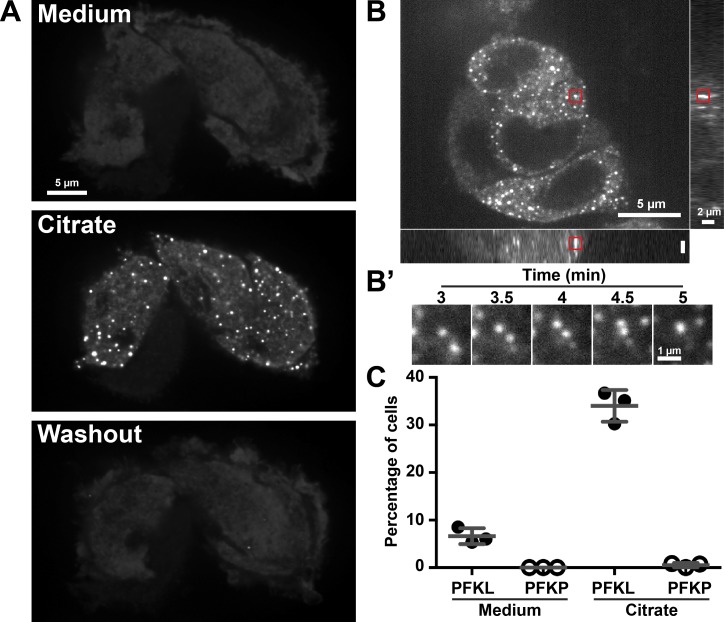
Figure 5.
Citrate reversibly induces the formation of large PFKL-EGFP punctae. (A) Spinning-disk confocal image of PFKL-EGFPu2013expressing MTLn3 cells from a time-lapse sequence acquired at two frames per minu...
Figure images are served from the NIH/NLM PubMed Central Open Access Subset or Europe PMC; copyright remains with the publishers and authors.
💬 Discussion
0 commentsNo comments yet. Be the first to start a discussion!
Leave a Comment