Abstract
Studies over the last decade provided evidence that in a dynamic interaction with neurons glial cell astrocytes contribut to fundamental phenomena in the brain. Most of the knowledge on this derives, however, from studies monitoring the astrocyte Ca2+ response to glutamate. Whether astrocytes can similarly respond to other neurotransmitters, including the inhibitory neurotransmitter GABA, is relatively unexplored. By using confocal and two photon laser‐scanning microscopy the astrocyte response to GABA in the mouse somatosensory and temporal cortex was studied. In slices from developing (P15‐20) and adult (P30‐60) mice, it was found that in a subpopulation of astrocytes GABA evoked somatic Ca2+ oscillations. This response was mediated by GABAB receptors and involved both Gi/o protein and inositol 1,4,5‐trisphosphate (IP3) signalling pathways. In vivo experiments from young adult mice, revealed that also cortical astrocytes in the living brain exibit GABAB receptor‐mediated Ca2+ elevations. At all astrocytic processes tested, local GABA or Baclofen brief applications induced long‐lasting Ca2+ oscillations, suggesting that all astrocytes have the potential to respond to GABA. Finally, in patch‐clamp recordings it was found that Ca2+ oscillations induced by Baclofen evoked astrocytic glutamate release and slow inward currents (SICs) in pyramidal cells from wild type but not IP3R2−/− mice, in which astrocytic GABAB receptor‐mediated Ca2+ elevations are impaired. These data suggest that cortical astrocytes in the mouse brain can sense the activity of GABAergic interneurons and through their specific recruitment contribut to the distinct role played on the cortical network by the different subsets of GABAergic interneurons. GLIA 2016;64:363–373
🔬 Techniques
🔭 Microscopes
✨ Fluorophores
🧪 Sample Preparation
🔬 Cell Lines
🏭 Microscope Brands
🧪 Reagent Suppliers
🔴 Lasers
💻 Software Details
🏛️ Research Organizations (ROR)
Affiliated research institutions:
📋 Methods
Animals
All procedures were conducted in accordance with the Italian and European Communities Council Directive on Animal Care and were approved by the Italian Ministry of Health. We used C57BL/6J mice (both sexes) at postnatal days 15–20 (P15–20; young) and P35–60 (adults). We also used IP 3 R2 −/− mice (Li et al., 2005 ) and mice obtained by crossing GCaMP3 (B6;129S‐ Gt(ROSA)26Sortm38(CAG‐GCaMP3)Hze /J) and GLAST‐CreERT2 mice (Mori et al., 2006 ). The expression of GCaMP3 was tamoxifen‐inducible. Tamoxifen (SIGMA Aldrich, Milano, IT) was dissolved in corn oil (20 mg/mL stock solution) and injected intraperitoneally (1 mg/day) twice in young mice (P7–10) and for 5 days in adult (P30–35) mice. Mice were analyzed 10 days after the last tamoxifen‐injection.
Brain Slice Preparation
Coronal slices of 350 μm containing somatosensory (SSCx) or temporal cortex (TeCx) were obtained from mice at postnatal days P15–20 and P30–60. Animals were anaesthetized with Zoletil (40 mg/kg, Virbac, Cedex, France) and Xilazyne (40 mg/kg, BIO98 srl, Barcelona, Spain) and the brain was removed and transferred into an ice‐cold solution (ACSF, in mM: 125 NaCl, 2.5 KCl, 2 CaCl 2 , 1 MgCl 2 , 25 glucose, pH 7.4 with 95% O 2 , and 5% CO 2 ). Coronal slices were cut with a vibratome (Leica Vibratome VT1000S Mannheim, Germany) in the solution described in Dugue et al. ( 2005 ). Slices were transferred for 1 minute in a solution at room temperature containing (in mM): 225 D‐mannitol, 2.5 KCl, 1.25 NaH 2 PO 4 , 26 NaHCO 3 , 25 glucose, 0.8 CaCl 2 , 8 MgCl 2 , 2 kynurenic acid with 95% O 2 , and 5% CO 2 . Slices were transferred in ACSF at 30°C for 20 minutes and then maintained at room temperature for the entire experiment. Dye Loading Brain slices were kept in ACSF with Sulforhodamine 101 (SR‐101) (0.2 μM, Sigma Aldrich, Milano, Italy) at 30°C for 15 minutes to selectively stain astrocytes (Nimmerjahn et al., 2004 ) and then loaded for 15 minutes at 31°C with the Ca 2+ sensitive dyes Fluo‐4 AM (10 μM; Life Technologies, Monza, Italy). Loading mix containing sulfinpyrazone (200 μM, Sigma Aldrich, Milano, Italy), pluronic F‐127 (0.12%, Sigma Aldrich, Milano, Italy), and kynurenic acid (1 mM, Sigma Aldrich, Milano, Italy) and was constantly bubbled with 95% O 2 and 5% CO 2 . Drug Applications Drugs applied with bath perfusion were (in μM): GABA 200 (Tocris, Bristol, United Kingdom); Baclofen 20–50 (BAC; Tocris, Bristol, United Kingdom); SCH50911 20–50 (Tocris, Bristol, United Kingdom), CGP52432 2.5 (Abicam Biomedicals, United Kingdom), Muscimol 100 (MUS; Tocris, Bristol, United Kingdom), Picrotoxin 100 (PTX; SIGMA Aldrich, Milano, Italy), DHPG 20‐50 (Tocris, Bristol, United Kingdom), D‐AP5 50 (Abicam Biomedicals, United Kingdom), Tetrodotoxin 0.5–1 (TTX; Abcam, Cambridge, United Kingdom). A pressure ejection unit (PDES, NPI Electronics, Tamm, Germany) connected to a glass pipette (tip diameter 2–3 μm) containing GABA or BAC (both at 500 μM) was used for local drug applications (pressure 3 psi; duration 200 ÷ 600 ms). Pertussis toxin (PerTx; SIGMA Aldrich, Milano, Italy) was dissolved in ACSF (7.5 μg/mL) and slices were incubated for 3–5 hours. Brain Slice Imaging Experiments Slice imaging experiments were conducted with a confocal laser scanning microscope TCS‐SP5‐RS (Leica Microsystems, GmbH, Wetzlar, Germany) equipped with two lasers tuned at 488 nm and 550 nm or with a two photon laser scanning microscope Multiphoton Imaging System (Scientifica Ltd., Uckfield, East Sussex, United Kingdom) equipped with a pulsed infrared laser (Chameleon Ultra 2, Coherent, Santa Clara, CA) tuned at 780 or 910 nm. Power at sample was controlled in the range 5–10 mW. The excitation wavelengths used were: 488 or 780 nm for Fluo‐4 AM and 488 or 910 nm for GCaMP3 for single or two photon excitation, respectively. Images were acquired at a resolution of 512 × 512 with at 1–2 Hz frame rate. Imaging was performed in cortical layers II–III and V and conducted at maximum for 1 hour with 1–2 minutes recording sessions every 5 minutes. In Vivo Imaging Experiments Mice were anaesthetized with an intraperitoneal injection of urethane ethylcarbamate (1.5 g/kg body weight, 10%; SIGMA Aldrich, Milano, Italy) solved in saline solution. Animal pinch withdrawal and eyelid reflex were tested to assay the depth of anesthesia. Dexamethasone sodium phosphate (2 mg/kg body weight, MSD, Boxmeer, Netherlands) was injected intramuscularly to reduce cortical stress response during surgery and prevent cerebral oedema. Dextran TRITC (20 μL; Sigma Aldrich, Milan, Italy) was injected in caudal vein to selectively mark blood vessel. Body temperature was maintained at 37°C with a feedback‐regulated heating pad. We monitored the respiration rate, heart rate and core body temperature throughout the experiment. The mouse was head‐fixed and a craniotomy of 2–3 mm in diameter was drilled over the SSCx (AP 2.5 mm from bregma; ML 3.3 mm). The dura was carefully removed and the craniotomy was immediately covered with a coverslip with a hole. Warm HEPES‐buffered artificial cerebrospinal fluid (ACSF, in mM: NaCl, 125; KCl, 5; glucose, 10; HEPES, 10; MgSO 4 2; and CaCl 2 , 2; at [pH 7.4]) filled the chamber to prevent desiccation and maintain ionic balance. To perform topical application of BAC, a borosilicate micropipette (Sutter instruments 1–2 μm tip diameter) was positioned over the hole on the coverslip. Imaging was performed with a two‐photon microscope (Ultima IV, Prairie Technology now Bruker, USA) at 910 nm with a Chameleon 2 laser (see above). Imaging was performed at a resolution of 512 × 512 pixels in superficial layers (50–150 μm below the cortical surface) and acquired at 1–2 Hz. Imaging session lasted up to 2 hours with 1–2 minutes recording sessions every 5 minutes.
Show full methods section
Animals
All procedures were conducted in accordance with the Italian and European Communities Council Directive on Animal Care and were approved by the Italian Ministry of Health. We used C57BL/6J mice (both sexes) at postnatal days 15–20 (P15–20; young) and P35–60 (adults). We also used IP 3 R2 −/− mice (Li et al., 2005 ) and mice obtained by crossing GCaMP3 (B6;129S‐ Gt(ROSA)26Sortm38(CAG‐GCaMP3)Hze /J) and GLAST‐CreERT2 mice (Mori et al., 2006 ). The expression of GCaMP3 was tamoxifen‐inducible. Tamoxifen (SIGMA Aldrich, Milano, IT) was dissolved in corn oil (20 mg/mL stock solution) and injected intraperitoneally (1 mg/day) twice in young mice (P7–10) and for 5 days in adult (P30–35) mice. Mice were analyzed 10 days after the last tamoxifen‐injection.
Brain Slice Preparation
Coronal slices of 350 μm containing somatosensory (SSCx) or temporal cortex (TeCx) were obtained from mice at postnatal days P15–20 and P30–60. Animals were anaesthetized with Zoletil (40 mg/kg, Virbac, Cedex, France) and Xilazyne (40 mg/kg, BIO98 srl, Barcelona, Spain) and the brain was removed and transferred into an ice‐cold solution (ACSF, in mM: 125 NaCl, 2.5 KCl, 2 CaCl 2 , 1 MgCl 2 , 25 glucose, pH 7.4 with 95% O 2 , and 5% CO 2 ). Coronal slices were cut with a vibratome (Leica Vibratome VT1000S Mannheim, Germany) in the solution described in Dugue et al. ( 2005 ). Slices were transferred for 1 minute in a solution at room temperature containing (in mM): 225 D‐mannitol, 2.5 KCl, 1.25 NaH 2 PO 4 , 26 NaHCO 3 , 25 glucose, 0.8 CaCl 2 , 8 MgCl 2 , 2 kynurenic acid with 95% O 2 , and 5% CO 2 . Slices were transferred in ACSF at 30°C for 20 minutes and then maintained at room temperature for the entire experiment. Dye Loading Brain slices were kept in ACSF with Sulforhodamine 101 (SR‐101) (0.2 μM, Sigma Aldrich, Milano, Italy) at 30°C for 15 minutes to selectively stain astrocytes (Nimmerjahn et al., 2004 ) and then loaded for 15 minutes at 31°C with the Ca 2+ sensitive dyes Fluo‐4 AM (10 μM; Life Technologies, Monza, Italy). Loading mix containing sulfinpyrazone (200 μM, Sigma Aldrich, Milano, Italy), pluronic F‐127 (0.12%, Sigma Aldrich, Milano, Italy), and kynurenic acid (1 mM, Sigma Aldrich, Milano, Italy) and was constantly bubbled with 95% O 2 and 5% CO 2 . Drug Applications Drugs applied with bath perfusion were (in μM): GABA 200 (Tocris, Bristol, United Kingdom); Baclofen 20–50 (BAC; Tocris, Bristol, United Kingdom); SCH50911 20–50 (Tocris, Bristol, United Kingdom), CGP52432 2.5 (Abicam Biomedicals, United Kingdom), Muscimol 100 (MUS; Tocris, Bristol, United Kingdom), Picrotoxin 100 (PTX; SIGMA Aldrich, Milano, Italy), DHPG 20‐50 (Tocris, Bristol, United Kingdom), D‐AP5 50 (Abicam Biomedicals, United Kingdom), Tetrodotoxin 0.5–1 (TTX; Abcam, Cambridge, United Kingdom). A pressure ejection unit (PDES, NPI Electronics, Tamm, Germany) connected to a glass pipette (tip diameter 2–3 μm) containing GABA or BAC (both at 500 μM) was used for local drug applications (pressure 3 psi; duration 200 ÷ 600 ms). Pertussis toxin (PerTx; SIGMA Aldrich, Milano, Italy) was dissolved in ACSF (7.5 μg/mL) and slices were incubated for 3–5 hours. Brain Slice Imaging Experiments Slice imaging experiments were conducted with a confocal laser scanning microscope TCS‐SP5‐RS (Leica Microsystems, GmbH, Wetzlar, Germany) equipped with two lasers tuned at 488 nm and 550 nm or with a two photon laser scanning microscope Multiphoton Imaging System (Scientifica Ltd., Uckfield, East Sussex, United Kingdom) equipped with a pulsed infrared laser (Chameleon Ultra 2, Coherent, Santa Clara, CA) tuned at 780 or 910 nm. Power at sample was controlled in the range 5–10 mW. The excitation wavelengths used were: 488 or 780 nm for Fluo‐4 AM and 488 or 910 nm for GCaMP3 for single or two photon excitation, respectively. Images were acquired at a resolution of 512 × 512 with at 1–2 Hz frame rate. Imaging was performed in cortical layers II–III and V and conducted at maximum for 1 hour with 1–2 minutes recording sessions every 5 minutes. In Vivo Imaging Experiments Mice were anaesthetized with an intraperitoneal injection of urethane ethylcarbamate (1.5 g/kg body weight, 10%; SIGMA Aldrich, Milano, Italy) solved in saline solution. Animal pinch withdrawal and eyelid reflex were tested to assay the depth of anesthesia. Dexamethasone sodium phosphate (2 mg/kg body weight, MSD, Boxmeer, Netherlands) was injected intramuscularly to reduce cortical stress response during surgery and prevent cerebral oedema. Dextran TRITC (20 μL; Sigma Aldrich, Milan, Italy) was injected in caudal vein to selectively mark blood vessel. Body temperature was maintained at 37°C with a feedback‐regulated heating pad. We monitored the respiration rate, heart rate and core body temperature throughout the experiment. The mouse was head‐fixed and a craniotomy of 2–3 mm in diameter was drilled over the SSCx (AP 2.5 mm from bregma; ML 3.3 mm). The dura was carefully removed and the craniotomy was immediately covered with a coverslip with a hole. Warm HEPES‐buffered artificial cerebrospinal fluid (ACSF, in mM: NaCl, 125; KCl, 5; glucose, 10; HEPES, 10; MgSO 4 2; and CaCl 2 , 2; at [pH 7.4]) filled the chamber to prevent desiccation and maintain ionic balance. To perform topical application of BAC, a borosilicate micropipette (Sutter instruments 1–2 μm tip diameter) was positioned over the hole on the coverslip. Imaging was performed with a two‐photon microscope (Ultima IV, Prairie Technology now Bruker, USA) at 910 nm with a Chameleon 2 laser (see above). Imaging was performed at a resolution of 512 × 512 pixels in superficial layers (50–150 μm below the cortical surface) and acquired at 1–2 Hz. Imaging session lasted up to 2 hours with 1–2 minutes recording sessions every 5 minutes.
Electrophysiological Recordings
Brain slices were continuously perfused in a submerged chamber at a rate of 3–4 mL/min with (in mM): NaCl, 120; KCl, 2.5; NaH 2 PO4, 1; NaHCO 3 , 26; MgCl 2 , 1; CaCl 2 , 2; glucose, 10; at pH 7.4 (with 5% CO 2 /95% O 2 ). Single and dual cell recordings were performed in voltage‐clamp and current‐clamp configuration using a multiclamp‐700B amplifier (Molecular Devices, Foster City, CA) under the same microscopes as for slice imaging (see above). Signals were filtered at 1 kHz and sampled at 10 kHz with a Digidata 1440s interface and pClamp10 software (Molecular Devices, Foster City, CA). Typical pipette resistance was 3–4 MΩ. Access resistance was monitored throughout the recordings and was typically less than 25 MΩ. Whole‐cell intracellular pipette solution was (in mM): K‐gluconate, 145; MgCl 2 , 5; EGTA, 0.5; Na 2 ATP, 2; Na 2 GTP, 0.2; HEPES, 10; to pH 7.2 with KOH, osmolarity, 280 ÷ 290 mOsm (calculated liquid junction potential: −14 mV). Pyramidal cells were identified on the basis of their distinct morphology and their response to hyperpolarizing and depolarizing 750 ms current steps. We selected only neurons showing a firing discharge with no spike amplitude accommodation (except for the second action potential in some cells), small after hyperpolarization and low steady‐state frequency (15 ÷ 23 Hz with 200 pA current injection). SICs were recorded in Mg 2+ free solution in presence of TTX, 1 μM (Abcam, Cambridge, UK) at a holding potential of −70 mV.
Data Analysis and Statistics
Data analysis was performed with Clampfit 10, Origin 8.0 (Microcal Software), Microsoft Office, ImageJ (NIH) and MATLAB 7.6.0 R2008A (Mathworks, Natick, MA). For imaging experiments, image sequences were aligned and processed with ImageJ and MATLAB. Region of interests (ROIs) were manually drawn around cellular body and processes using the red channel from the SR‐101 signal. All pixels within each ROI were averaged to give a single time course F ( t ). The Ca 2+ signal for each ROIs was computed as Δ F / F 0 = ( F ( t ) − F 0 )/( F 0 − background), where F 0 is the baseline fluorescence level obtained by averaging the fluorescence recorded during baseline activity. Peaks in the fluorescence were considered significant event when exceeding three standard deviation of the signal measured in baseline conditions. In electrophysiological experiments, inward currents with rise time (10%–90%) slower than 10 ms and amplitude greater than 20 pA were classified as SICs. The relative frequency of SICs was measured in the 5 minutes post pressure pulse applications (average of 1–3 applications, repeated every 5 minutes) then divided by each cell's control calculated in the period before BAC application (5 ÷ 25 minutes). For the analysis of other SICs parameters (rise, decay, duration, peak amplitude, and charge transferred) two minutes following BAC applications were considered. According to data normal distribution we performed two‐tailed Student's t ‐test for the percentage of active astrocytes and SIC frequency. Otherwise we used Wilcoxon test for Ca 2+ peak frequency and Mann–Whitney test for SICs area, rise, decay, duration, and peak amplitude. Results were considered statistically significant when * P < 0.05, ** P < 0.01, *** P < 0.001. All results are presented as mean ± s.e.m.
📊 Figures
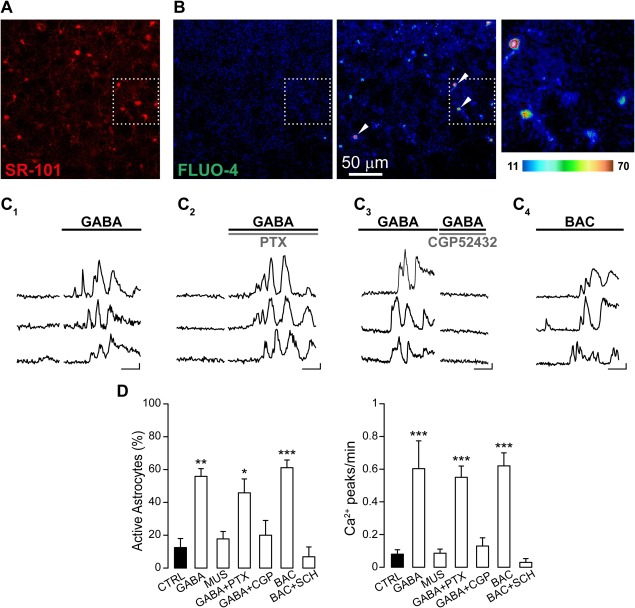
Figure 1
GABA activates somatic Ca 2+ transients in astrocytes via GABA B receptor. (A) Redu2010fluorescent SRu2010101 selective labelling of astrocytes from SSCx. (B) Pseudou2010colored images from FLUOu20104...
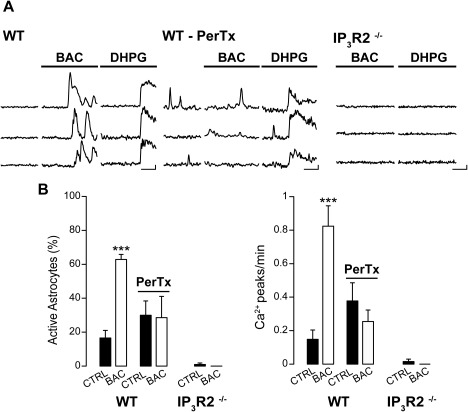
Figure 2
Astrocyte GABA B R activation recruits G i/o protein and IP 3 intracellular cascade. (A) Ca 2+ signal changes from three representative astrocytes in response to BAC in control conditions (WT), after ...
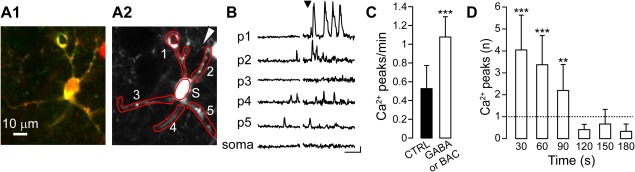
Figure 3
GABA activates long lasting Ca 2+ transients in astrocytic processes. (A 1 ) Twou2010photon Ca 2+ imaging of an astrocyte expressing the genetically encoded Ca 2+ indicator GCaMP 3 and loaded with SRu...
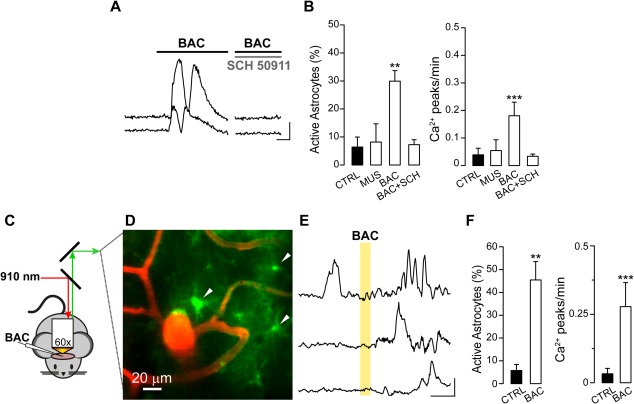
Figure 4
Local BAC applications trigger astrocyte Ca 2+ transients in GCaMP3 adult mice. (A,B) Experiments in brain slices. (A) Fluorescence signals over time from two representative astrocytes acquired in bas...
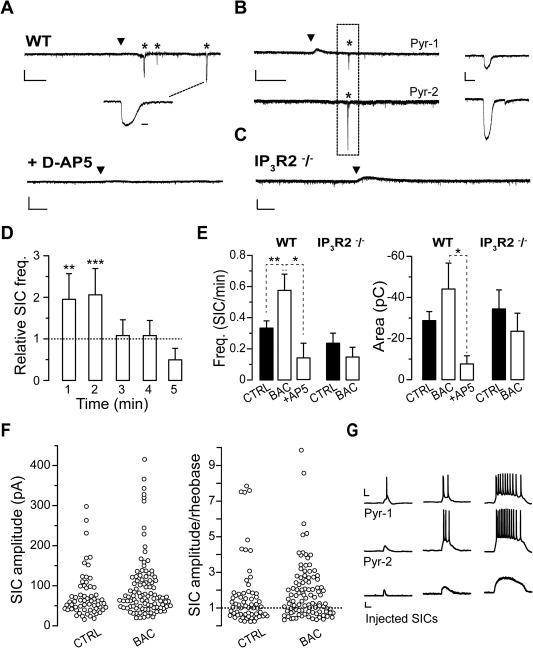
Figure 5
GABAu2010activated astrocytes evoke SICs in pyramidal neurons. (Au2013C) Representative whole cell currents from single pyramidal neurons (A) or a pair (C) of adjacent pyramidal neurons (90 u03bcm apa...
Figure images are served from the NIH/NLM PubMed Central Open Access Subset or Europe PMC; copyright remains with the publishers and authors.
💬 Discussion
0 commentsNo comments yet. Be the first to start a discussion!
Leave a Comment