Abstract
Though critical to normal development and cancer metastasis, how cells traverse basement membranes is poorly understood. A central impediment has been the challenge of visualizing invasive cell interactions with basement membrane in vivo. By developing live-cell imaging methods to follow anchor cell (AC) invasion in Caenorhabditis elegans, we identify F-actin-based invadopodia that breach basement membrane. When an invadopodium penetrates basement membrane, it rapidly transitions into a stable invasive process that expands the breach and crosses into the vulval tissue. We find that the netrin receptor UNC-40 (DCC) specifically enriches at the site of basement membrane breach and that activation by UNC-6 (netrin) directs focused F-actin formation, generating the invasive protrusion and the cessation of invadopodia. Using optical highlighting of basement membrane components, we further demonstrate that rather than relying solely on proteolytic dissolution, the AC's protrusion physically displaces basement membrane. These studies reveal an UNC-40-mediated morphogenetic transition at the cell-basement membrane interface that directs invading cells across basement membrane barriers.
🔬 Techniques
🔭 Microscopes
🧬 Organisms
💻 Software
✨ Fluorophores
🧪 Sample Preparation
🔬 Cell Lines
🏭 Microscope Brands
📷 Detectors
🔎 Objectives
💻 Software Details
📋 Protocols
💾 Data Repositories
🏛️ Research Organizations (ROR)
Affiliated research institutions:
📋 Methods
Strains and culture conditions
Culturing and handling of C. elegans was done as previously described ( Brenner, 1974 ). Wild-type animals were strain N2. In the text and figures, we designated linkage to a promoter with a greater than symbol (>) and used a double colon (::) for linkages that fuse open reading frames. The following alleles and transgenes were used in this study: qyIs61[cdh-3 > GFP::UNC-34] , qyIs242[cdh-3 > Lifeact::GFP] , qyIs46[emb-9::mCherry] , qyIs221[cdh-3 > GFP::CED-10] , qyIs219[cdh-3 > GFP::PLCδ PH ] , qyIs220[cdh-3 > GFP::MIG-2] , qyIs67[cdh-3 > UNC-40::GFP] , qyIs127[laminin::mCherry] , qyIs166[cdh-3 > GFP::CAAX] ; LGI, unc-40(e271) ; LGII, qyIs23[cdh-3 > mCherry::PLCδ PH ] ; LGIII, unc-119(ed4) ; LGIV, qyIs10[laminin::GFP] ; LGV, qyIs50[cdh-3 > mCherry::moeABD] ; and LGX, qyIs7[laminin::GFP] , unc-6(ev400) , qyIs24[cdh-3 > mCherry::PLCδ PH ] , and qyIs66[cdh-3 > UNC-40::GFP] . Microscopy, image acquisition, processing, and analysis Images were acquired using a camera (EM-CCD; Hamamatsu Photonics) and a spinning disk confocal microscope (CSU-10; Yokogawa) mounted on a microscope (AxioImager; Carl Zeiss) with a Plan-APOCHROMAT 100×/1.4 oil differential interference contrast objective and controlled by iVision software (Biovision Technologies). Acquired images were processed using ImageJ 1.40g and Photoshop (CS3 Extended; Adobe). 3D reconstructions were built from confocal z-stacks, analyzed, and exported as .mov files using IMARIS 7.4 (Bitplane, Inc.). Figures and graphs were constructed using Illustrator (CS3 Extended; Adobe). Videos were annotated using Photoshop. Quantitative analyses of AC-invadopodia, invasive protrusion, or basement membrane breach formation was done using either ImageJ, Imaris, or both. To be as consistent as possible isosurface renderings, built in place of polymerized F-actin, were used to determine a threshold for assigning the spots that were used to quantify AC-invadopodia dynamics. For time-lapse microscopy, worms were anesthetized in 0.2% tricaine and 0.02% levamosile in M9 and then transferred to 5% noble agar pads, sealed with VALAP, and imaged at 23°C. Capturing the AC-invadopodia structures that presaged the initial basement membrane breach required ventral view time-lapse imaging. Although AC-invadopodia could be observed to depress the basement membrane in single time point lateral view images, we were unable to resolve whether the structures that presaged the initial breach repeatedly depressed the basement membrane. RNAi RNAi targeting pat-3 was delivered by feeding worms Escherichia coli expressing double-stranded RNA. To avoid embryonic lethality, synchronized L1-arrested larvae were grown for 5 h on regular OP50 bacteria in the absence of RNAi. These worms were then transferred to bacteria expressing pat-3 double-stranded RNA. The empty RNAi vector L4440 was used as a negative control. The RNAi vector was sequenced to verify correct insert.
Show full methods section
Strains and culture conditions
Culturing and handling of C. elegans was done as previously described ( Brenner, 1974 ). Wild-type animals were strain N2. In the text and figures, we designated linkage to a promoter with a greater than symbol (>) and used a double colon (::) for linkages that fuse open reading frames. The following alleles and transgenes were used in this study: qyIs61[cdh-3 > GFP::UNC-34] , qyIs242[cdh-3 > Lifeact::GFP] , qyIs46[emb-9::mCherry] , qyIs221[cdh-3 > GFP::CED-10] , qyIs219[cdh-3 > GFP::PLCδ PH ] , qyIs220[cdh-3 > GFP::MIG-2] , qyIs67[cdh-3 > UNC-40::GFP] , qyIs127[laminin::mCherry] , qyIs166[cdh-3 > GFP::CAAX] ; LGI, unc-40(e271) ; LGII, qyIs23[cdh-3 > mCherry::PLCδ PH ] ; LGIII, unc-119(ed4) ; LGIV, qyIs10[laminin::GFP] ; LGV, qyIs50[cdh-3 > mCherry::moeABD] ; and LGX, qyIs7[laminin::GFP] , unc-6(ev400) , qyIs24[cdh-3 > mCherry::PLCδ PH ] , and qyIs66[cdh-3 > UNC-40::GFP] . Microscopy, image acquisition, processing, and analysis Images were acquired using a camera (EM-CCD; Hamamatsu Photonics) and a spinning disk confocal microscope (CSU-10; Yokogawa) mounted on a microscope (AxioImager; Carl Zeiss) with a Plan-APOCHROMAT 100×/1.4 oil differential interference contrast objective and controlled by iVision software (Biovision Technologies). Acquired images were processed using ImageJ 1.40g and Photoshop (CS3 Extended; Adobe). 3D reconstructions were built from confocal z-stacks, analyzed, and exported as .mov files using IMARIS 7.4 (Bitplane, Inc.). Figures and graphs were constructed using Illustrator (CS3 Extended; Adobe). Videos were annotated using Photoshop. Quantitative analyses of AC-invadopodia, invasive protrusion, or basement membrane breach formation was done using either ImageJ, Imaris, or both. To be as consistent as possible isosurface renderings, built in place of polymerized F-actin, were used to determine a threshold for assigning the spots that were used to quantify AC-invadopodia dynamics. For time-lapse microscopy, worms were anesthetized in 0.2% tricaine and 0.02% levamosile in M9 and then transferred to 5% noble agar pads, sealed with VALAP, and imaged at 23°C. Capturing the AC-invadopodia structures that presaged the initial basement membrane breach required ventral view time-lapse imaging. Although AC-invadopodia could be observed to depress the basement membrane in single time point lateral view images, we were unable to resolve whether the structures that presaged the initial breach repeatedly depressed the basement membrane. RNAi RNAi targeting pat-3 was delivered by feeding worms Escherichia coli expressing double-stranded RNA. To avoid embryonic lethality, synchronized L1-arrested larvae were grown for 5 h on regular OP50 bacteria in the absence of RNAi. These worms were then transferred to bacteria expressing pat-3 double-stranded RNA. The empty RNAi vector L4440 was used as a negative control. The RNAi vector was sequenced to verify correct insert.
Construction of GFP protein fusions
Lifeact::GFP was amplified from pJWZ73, and then linked by PCR fusion to the cdh-3 > promoter. MIG-2 and CED-10 were both amplified from N2 genomic DNA and then linked to a cdh-3 > GFP amplicon by PCR fusion. The PLCδ PH domain was amplified from pAA173, cloned into pBsSK at the C-terminus of GFP and then linked to the cdh-3 > promoter and unc-54 3′UTR using a three-step PCR fusion. GFP::CAAX was amplified from pSA129, and then linked by PCR fusion to the cdh-3 > promoter. Constructs were coinjected with ∼50 ng/µl unc-119 rescue DNA, ∼50 ng/µl pBsSK, and ∼50 ng/µl EcoRI cut salmon sperm DNA into unc-119(ed4) hermaphrodites. Stably expressed extrachromosomal lines were established and selected lines were integrated by gamma irradiation. See Tables S1 and S2 for primer sequences used and transgenic strains generated. Staining with the lipophilic dye FM1-43 To visualize the plasma membrane of the AC we used the lipophilic dye FM1-43, which fluoresces green when incorporated into the outer leaflet of the plasma membrane. Approximately 25 wild-type N2 worms at the early L3 larval stage were transferred to 25 µl of a 0.5 mM FM1-43 dye in M9 in a well of a glass spot plate. The spot plate was covered with parafilm and placed in the dark for 1 h. After incubation, worms were allowed to destain on OP50 food plates for an additional hour. Worms were mounted on 5% noble agar pads containing 0.01 M sodium azide and imaged using a spinning disc confocal and 488-nm laser. Optical highlighting (photoconversion) of basement membrane components Defined regions of laminin::Dendra and type IV collagen::Dendra were photoconverted using a confocal microscope (LSM 510; Carl Zeiss) equipped with a 63× objective, scanning regions of interest with a 405-nm laser at 1 mW power for 30 s. After photoconversion, images were captured using a spinning disc confocal or an AxioImager microscope. Animals were recovered from the agar pad, allowed to develop at 20°C for the specified amount of time, and then reimaged. The fold change in width of the optically highlighted regions was measured using ImageJ 1.40g. Quantification of percent displacement was done by photoconverting all of the basement membrane within a 15-µm radius of the AC, recovering the worms for 2–3 h, and then reimaging from the ventral perspective. Sum projections of confocal z-stacks were then analyzed using ImageJ 1.40g software and the method described in Fig. 6 B . Measurements of circularity were performed by tracing the boundary of single basement membrane breaches in ImageJ and calculated as 4π(area/perimeter 2 ) .
Statistical analysis
All statistical analysis was performed in JMP version 9.0 (SAS Institute), using either a two-tailed unpaired Student’s t test or nonparametric Wilcoxon rank-sum test. Figure legends specify when each test was used. Online supplemental material Online supplemental material includes five figures, nine videos corresponding to the time-lapse data presented in the main text figures, and two tables, Table S1 for primer sequences and Table S2 for extrachromosomal arrays and integrated strains. Online supplemental material is available at http://www.jcb.org/cgi/content/full/jcb.201301091/DC1 . Additional data are available in the JCB DataViewer at http://dx.doi.org/10.1083/jcb.201301091.dv .
Online supplemental material Online supplemental material includes five figures, nine videos corresponding to the time-lapse data presented in the main text figures, and two tables, Table S1 for primer sequences and Table S2 for extrachromosomal arrays and integrated strains. Online supplemental material is available at http://www.jcb.org/cgi/content/full/jcb.201301091/DC1 . Additional data are available in the JCB DataViewer at http://dx.doi.org/10.1083/jcb.201301091.dv .
📊 Figures
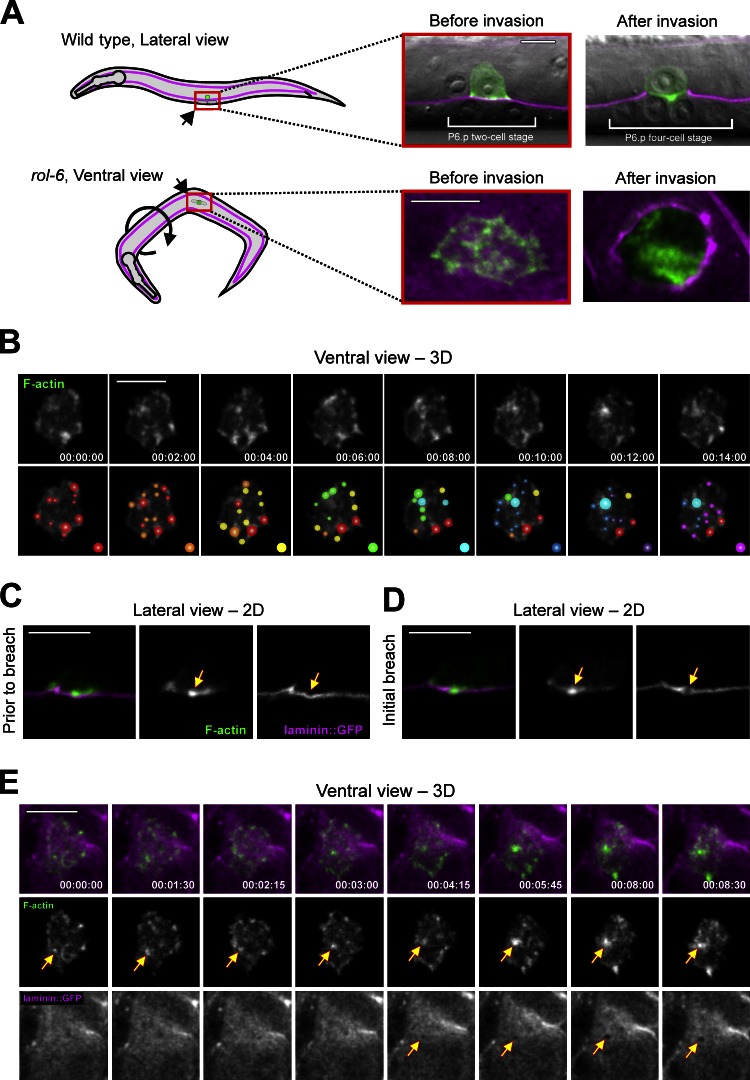
Figure 1.
F-actinu2013rich AC-invadopodia breach the basement membrane. (A) A schematic diagram depicts the two perspectives used for time-lapse imaging of AC invasion. (top) Wild-type animals lay on their side...
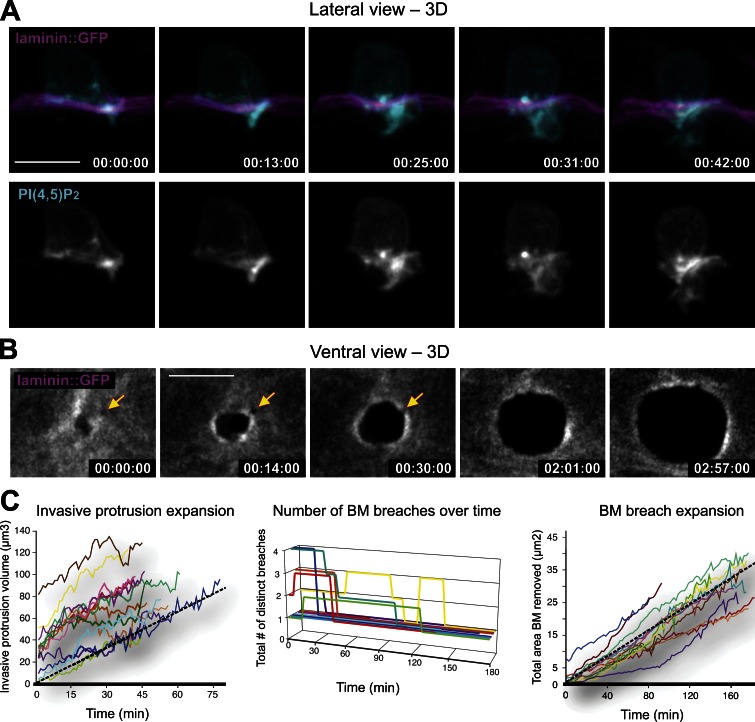
Figure 2.
Invadopodia give rise to an invasive protrusion that removes basement membrane. (A) A lateral view time series shows the growth of the invasive membrane protrusion (viewed with the AC-specific PI(4,5)...
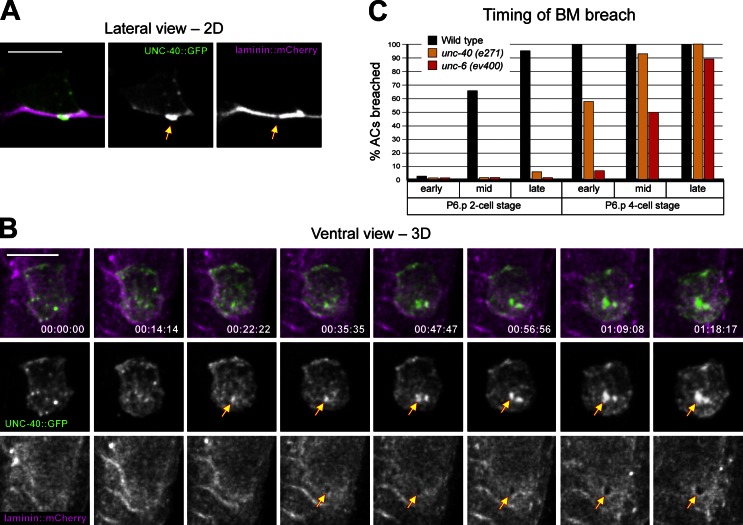
Figure 3.
UNC-40 (DCC) presages and then enriches at the basement membrane breach. (A) The netrin receptor UNC-40::GFP (middle, arrow) enriches at the site of basement membrane breach (right, arrow). (B) A vent...
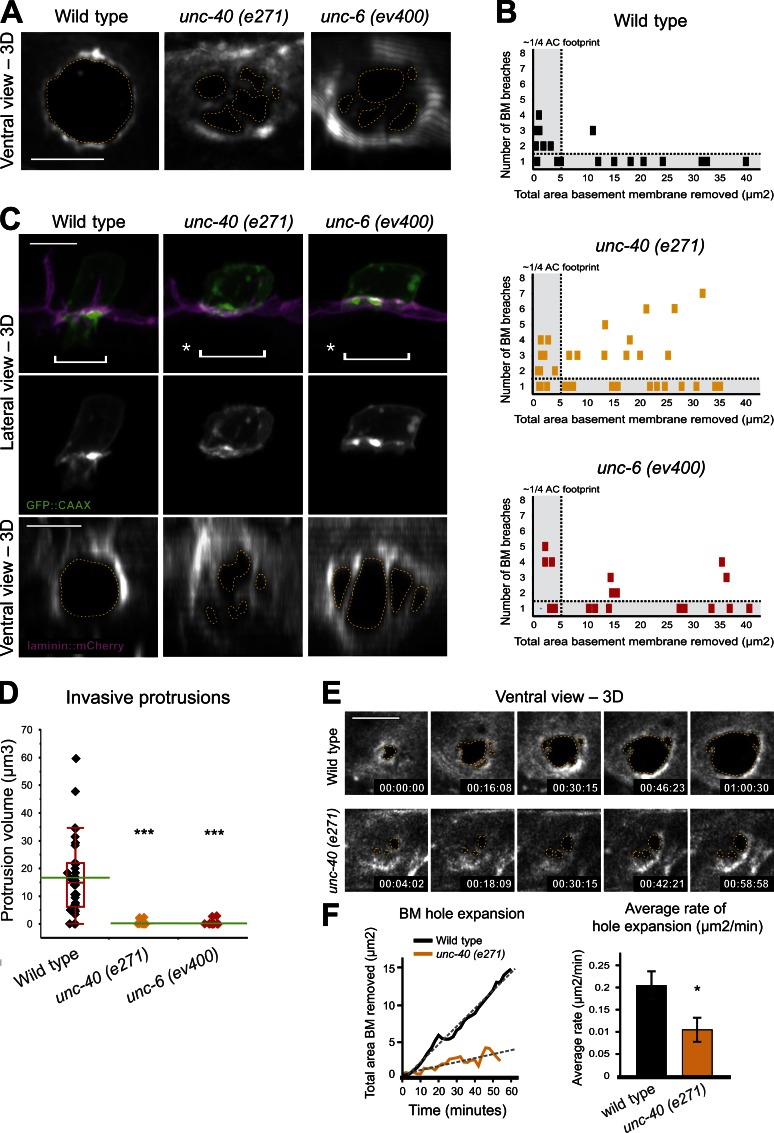
Figure 4.
UNC-40 and UNC-6 promote invasive protrusion formation and basement membrane clearance. (A) A single basement membrane gap (basement membrane viewed with laminin::GFP) is formed in wild-type animals (...
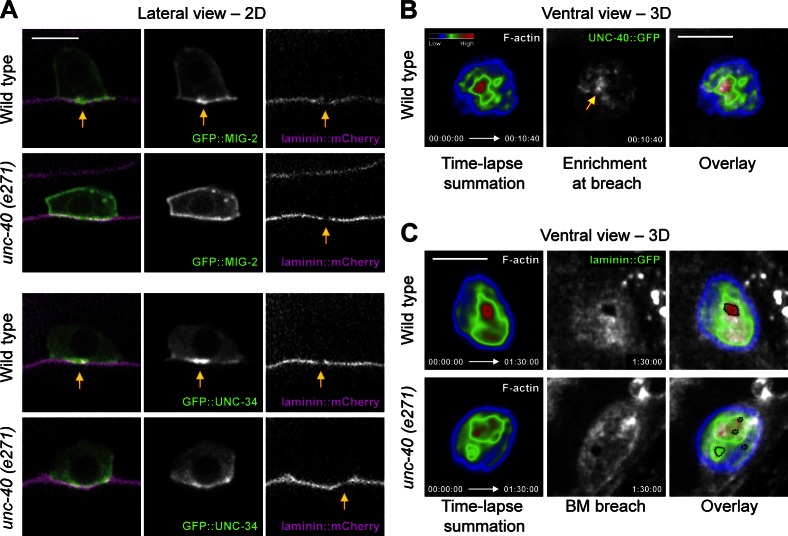
Figure 5.
UNC-40 directs F-actin formation at the site of protrusion formation. (A) F-actin effectors (middle), basement membrane (right), and overlay (left) show that GFP::MIG-2 (Rac) and GFP::UNC-34 (Ena/VASP...
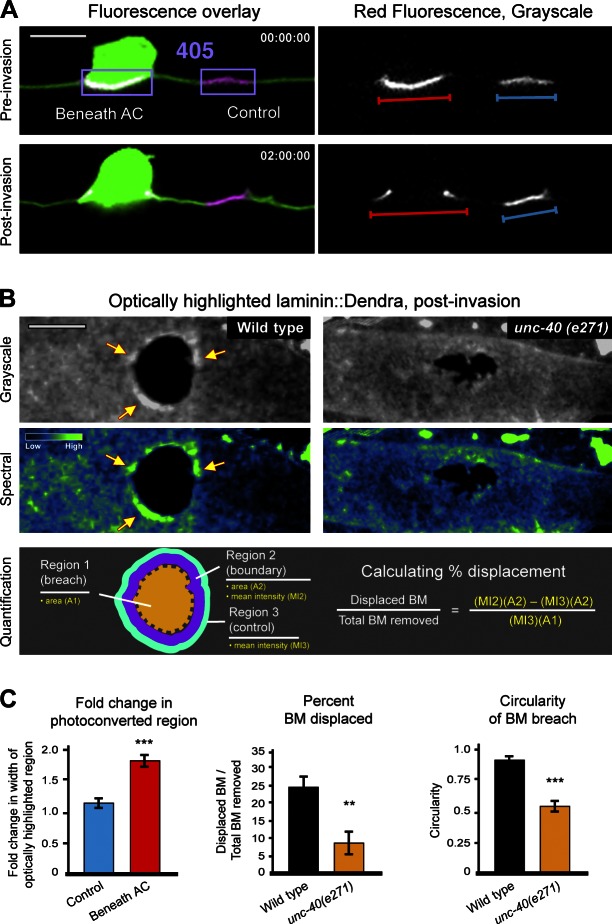
Figure 6.
The basement membrane is physically displaced by the UNC-40u2013generated invasive protrusion. (A) Lateral view images show two regions of laminin::Dendra (one beneath the AC and an adjacent control) ...
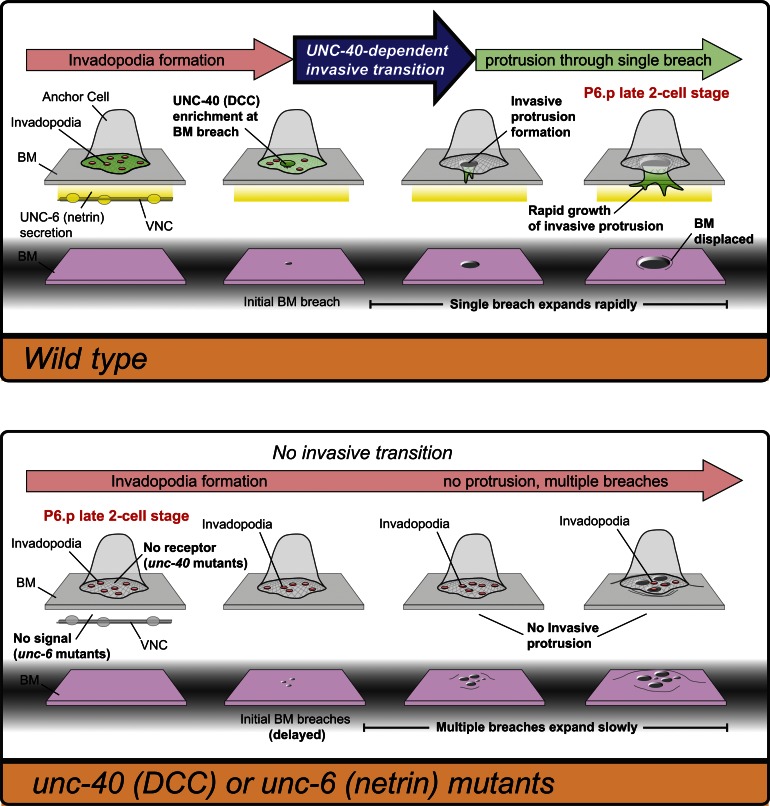
Figure 7.
The netrin receptor UNC-40 promotes invadopodia-to-invasive protrusion transition within the AC. In wild-type animals (top) numerous invadopodia turn over before one penetrates the basement membrane. ...
Figure images are served from the NIH/NLM PubMed Central Open Access Subset or Europe PMC; copyright remains with the publishers and authors.
💬 Discussion
0 commentsNo comments yet. Be the first to start a discussion!
Leave a Comment