Abstract
Processing bodies (PBs) are non-membranous cytoplasmic structures found in all eukaryotes. Many of their components such as the Dcp1 and Dcp2 proteins are highly conserved. Using live-cell imaging we found that PB structures disassembled as cells prepared for cell division, and then began to reassemble during the late stages of cytokinesis. During the cell cycle and as cells passed through S phase, PB numbers increased. However, there was no memory of PB numbers between mother and daughter cells. Examination of hDcp1a and hDcp1b proteins by electrophoresis in mitotic cell extracts showed a pronounced slower migrating band, which was caused by hyper-phosphorylation of the protein. We found that hDcp1a is a phospho-protein during interphase that becomes hyper-phosphorylated in mitotic cells. Using truncations of hDcp1a we localized the region important for hyper-phosphorylation to the center of the protein. Mutational analysis demonstrated the importance of serine 315 in the hyper-phosphorylation process, while other serine residues tested had a minor affect. Live-cell imaging demonstrated that serine mutations in other regions of the protein affected the dynamics of hDcp1a association with the PB structure. Our work demonstrates the control of PB dynamics during the cell cycle via phosphorylation.
🔬 Techniques
🧬 Organisms
💻 Software
✨ Fluorophores
🧪 Sample Preparation
🔬 Cell Lines
🏭 Microscope Brands
🧪 Reagent Suppliers
📷 Detectors
💻 Software Details
🏛️ Research Organizations (ROR)
Affiliated research institutions:
📋 Methods
Plasmids and site directed mutagenesis The GFP-Dcp1a was previously described [12] . The truncated forms of GFP-Dcp1a were obtained by the following restriction reactions on GFP-Dcp1a: 1–200: digested with XbaI; 1–150: digested with PstI. For 150–200: GFP-Dcp1a was digested with HindIII and PstI, and the fragment was subcloned into the peGFP-C1 vector. For 75–200: This region was amplified by RT-PCR from GFP-Dcp1a using primers – ATAGAATTCGCACAATCTAGTTGAACCAGGAA , ATACCCGGGTTCCAAATAACTCTTCTACCGT , digested with EcoRI and XbaI and subcloned into peGFP-C1. For 100–200: The amplified 75–224 region was digested with HindIII and XbaI and then subcloned into peGFP-C1. The previously constructed GFP-Dcp1a plasmid was mutated using the QuikChange II Site-Directed Mutagenesis kit (Stratagene). Serine 315 was mutated to alanine using primers – CTACACAATCCCGTTGGCCTGTTCTCAGTCCC , GGGACTGAGAACAGGGGAACGGGATTGTGTAG . Serine 319 was mutated to alanine using primers - CGTTGAGCCCTGTTCTCGCCCCACTCTGCCAGC , GCTGGCAGAGTGGGAGCCGAACAGGGCTCAACG . Both serines 315 and 319 were mutated to alanine using primers - GTTGGCCCCTGTTCTCGCCCACTCTGCCAG , CAATAGTTAGAGGAGAAGGGCGGCGGCTTTCCTCTCAA . Both serines at 522 and 523 were mutated to alanine using primers - CCTTGAGAGGAAAGCCGCGCCCCTTCTCCTCTAACTATT , CAATAGTTAGAGGAGAAGGGCGGCGGCTTTCCTCTCAA .
Cell culture and transfections Human
U2OS cells were maintained in low glucose DMEM (Biological Industries, Israel) and HeLa cells in high glucose DMEM (Gibco) containing 10% FBS (HyClone). The following U2OS stable lines were generated: GFP-Dcp1a, GFP-Dcp1a S315A, GFP-Dcp1 S319A, GFP-Dcp1a S522,523A. For Western blotting of GFP-Dcp1a truncations, cells were transiently transfected with Lipofectamine (Invitrogen). The Fucci system (Clontech) was used for cell cycle phase detection. For G1 phase detection, pRetroX-G1-Red vector (mCherry-hCdt1) was used, and for S/G2 the Phase pRetroX-SG2M-Cyan vector (AmCyan-hGeminin). Fucci vectors were transiently transfected into U2OS cells with the PolyJet transfection reagent (SignaGem Laboratories).
Show full methods section
Plasmids and site directed mutagenesis The GFP-Dcp1a was previously described [12] . The truncated forms of GFP-Dcp1a were obtained by the following restriction reactions on GFP-Dcp1a: 1–200: digested with XbaI; 1–150: digested with PstI. For 150–200: GFP-Dcp1a was digested with HindIII and PstI, and the fragment was subcloned into the peGFP-C1 vector. For 75–200: This region was amplified by RT-PCR from GFP-Dcp1a using primers – ATAGAATTCGCACAATCTAGTTGAACCAGGAA , ATACCCGGGTTCCAAATAACTCTTCTACCGT , digested with EcoRI and XbaI and subcloned into peGFP-C1. For 100–200: The amplified 75–224 region was digested with HindIII and XbaI and then subcloned into peGFP-C1. The previously constructed GFP-Dcp1a plasmid was mutated using the QuikChange II Site-Directed Mutagenesis kit (Stratagene). Serine 315 was mutated to alanine using primers – CTACACAATCCCGTTGGCCTGTTCTCAGTCCC , GGGACTGAGAACAGGGGAACGGGATTGTGTAG . Serine 319 was mutated to alanine using primers - CGTTGAGCCCTGTTCTCGCCCCACTCTGCCAGC , GCTGGCAGAGTGGGAGCCGAACAGGGCTCAACG . Both serines 315 and 319 were mutated to alanine using primers - GTTGGCCCCTGTTCTCGCCCACTCTGCCAG , CAATAGTTAGAGGAGAAGGGCGGCGGCTTTCCTCTCAA . Both serines at 522 and 523 were mutated to alanine using primers - CCTTGAGAGGAAAGCCGCGCCCCTTCTCCTCTAACTATT , CAATAGTTAGAGGAGAAGGGCGGCGGCTTTCCTCTCAA .
Cell culture and transfections Human
U2OS cells were maintained in low glucose DMEM (Biological Industries, Israel) and HeLa cells in high glucose DMEM (Gibco) containing 10% FBS (HyClone). The following U2OS stable lines were generated: GFP-Dcp1a, GFP-Dcp1a S315A, GFP-Dcp1 S319A, GFP-Dcp1a S522,523A. For Western blotting of GFP-Dcp1a truncations, cells were transiently transfected with Lipofectamine (Invitrogen). The Fucci system (Clontech) was used for cell cycle phase detection. For G1 phase detection, pRetroX-G1-Red vector (mCherry-hCdt1) was used, and for S/G2 the Phase pRetroX-SG2M-Cyan vector (AmCyan-hGeminin). Fucci vectors were transiently transfected into U2OS cells with the PolyJet transfection reagent (SignaGem Laboratories).
Immunofluorescence
Immunofluorescence was performed as previously described [12] . Primary antibodies: rabbit anti-hDcp1a, rabbit anti-hDcp1b, anti-Dcp2 (J. Lykke-Andersen, University of Colorado, Boulder, CO), mouse anti-hDcp1a (Abnova), mouse anti-Hedles (Santa Cruz), rabbit anti-α-tubulin (Abcam). Secondary Abs: anti-rabbit and anti-mouse Cy3 (Jackson ImmouResearch). Nuclei were counterstained with Hoechst 33342 and coverslips were mounted in mounting medium. Cell synchronization For the various treatments cells were treated with: 600 nM nocodazole, 5 µg/ml cycloheximide (Sigma). For cell cycle synchronization, cells were arrested at G1/S using a thymidine block. Briefly, cells were cultured for 1 day and then incubated in medium containing 5 mM thymidine (Sigma) for U2OS cells and 2 mM thymidine for HeLa cells for 24 hours. For a mitotic block, cells were incubated with medium containing 600 nM nocodazole or 25 µM noscapine for 16 hrs. Mitotic cells were washed off the plates. Cells were then washed briefly and cell extracts were prepared for Western blotting.
Western blotting
SDS-PAGE and Western blotting were performed as previously described [12] . When appropriate, extracts were further treated with 400 u of lambda protein phosphatase (New England Biolabs) for 1 hr at 30°C. Primary antibodies used were mouse anti-hDcp1a (Abnova), rabbit anti-hDcp1a, (J. Lykke-Andersen), mouse anti-α-tubulin (Abcam), mouse anti-GFP (Covance), mouse anti-GFP (Roche). The secondary antibody was a HRP-conjugated goat anti-rabbit or anti-mouse IgG (Sigma). Immunoreactive bands were detected by the Enhanced Chemiluminescence kit (ECL, Pierce). Fluorescence microscopy, live-cell imaging and data analysis Wide-field fluorescence images were obtained using the Cell∧R system based on an Olympus IX81 fully motorized inverted microscope (60× PlanApo objective, 1.42 NA) fitted with an Orca-AG CCD camera (Hamamatsu), rapid wavelength switching, and driven by the Cell∧R software. For time-lapse imaging, cells were plated on glass-bottomed tissue culture plates (MatTek, Ashland, MA) in medium containing 10% FCS at 37°C. The microscope is equipped with an enclosure incubator which includes temperature and CO2 control (Life Imaging Services, Reinach, Switzerland). For long-term imaging of the cell cycle, several cell positions were chosen and recorded by a motorized stage (Scan IM, Märzhäuser, Wetzlar-Steindorf, Germany). In these experiments, cells were typically imaged in 3D (4 Z planes per time point) every 6 minutes, at 3.33 µm steps ( Figure 2 ) or every 15 minutes at 2 µm steps ( Figure 3 ). For presentation of the movies, the 4D image sequences were transformed into a time sequence using the maximum projection option in the Cell∧R software.
FRAP
FRAP experiments were performed using a 3D-FRAP system (Photometrics) built on an Olympus IX81 microscope (636 Plan-Apo, 1.4 NA) equipped with an EM-CCD (Quant-EM, Roper), 491 nm laser, Lambda DG-4 light source (Sutter), XY&Z stages (Prior), and driven by MetaMorph (Molecular Devices). Experiments were performed at 37°C with 5% CO2 using a live cell chamber system (Tokai). For each acquisition, PBs were bleached using the 491 nm laser. Six pre-bleach images were acquired. Post-bleach images were acquired with a sequence of 2 time frequencies: 57 images every 350 msec and 12 images every 3 sec. The experiments were analyzed using ImageJ macros previously described [12] . Data from at least 10 experiments for each cell line were collected and the averaged FRAP measurements were fitted by Matlab.
Supporting Information Movie S1 PB assembly and disassembly during cell division in living cells. Cells stably expressing GFP-Dcp1a were simultaneously imaged in GFP and DIC showing the assembly and disassembly of PBs during a movie of 14 hours. Cells were imaged every 6 min. (MOV) Click here for additional data file. Movie S2 PB numbers during the cell cycle. U2OS cells stable for GFP-Dcp1a were co-transfected with AmCyan1-Geminin and mCherry-Cdt1 and imaged for 15 hours. The movie shows the cytoplasmic GFP-Dcp1a signal together with nuclear AmCyan1-Geminin staining (looks green due to the filter used). The increase in PBs during S can be seen for the marked cell and also for the unlabeled cell above, which also undergoes mitosis at a similar time. Cells were imaged every 15 min. (MOV) Click here for additional data file. Figure S1 Hyper-phosphorylation of Dcp1a during mitosis. (A) Treatment of U2OS or HeLa protein extracts before SDS-PAGE with a phosphatase (Noc+PPase) caused a reduction in the molecular weight of hDcp1a, compared to untreated, G1/S blocked (Thy), and metaphase blocked cells (Noc), and the appearance of slower migrating Dcp1a bands. This demonstrated that Dcp1a is hyper-phosphorylated during mitosis. Treatment with cycloheximide (Cyclo) for 1 or 4 hrs did not change the mobility of hDcp1a indicating that hyper-phosporylation is cell cycle dependent. (B) Shift in mobility due to hyper-phosphorylation in mitotic cells is seen also for GFP-Dcp1a and GFP-Dcp1b using an anti-GFP antibody. Phosphatase (Noc+PPase) treatment caused a reduction in the molecular weight of GFP-Dcp1a and Dcp1b, compared to control. Tubulin was used as a loading control. (TIF) Click here for additional data file. Figure S2 Putative phosphorylation sites in the hDcp1a protein. The central region of Dcp1a is marked in red (200–380, as used in figure 5 ). Serine, threonine, and tyrosine residues are marked in green. Mutated amino acids are marked in yellow. (TIF) Click here for additional data file. Figure S3 Mutation S315A reduces hyper-phosphorylation of GFP-Dcp1a. (A) No hyper-phosphorylation of hDcp1a S315A mutated protein was observed in mitotic cells (Noc) expressing GFP- hDcp1a S315A (100 kD) compared to the endogenous Dcp1a protein (70 kD) which did show hyper-phosphorylated Dcp1a bands. The blot was reacted with anti-Dcp1a. (B) The S319A and S522,523A mutated GFP-Dcp1a proteins showed prominent hyper-phosphorylation patterns compared to the S315A protein. Tubulin was used as a loading control. (TIF) Click here for additional data file.
📊 Figures
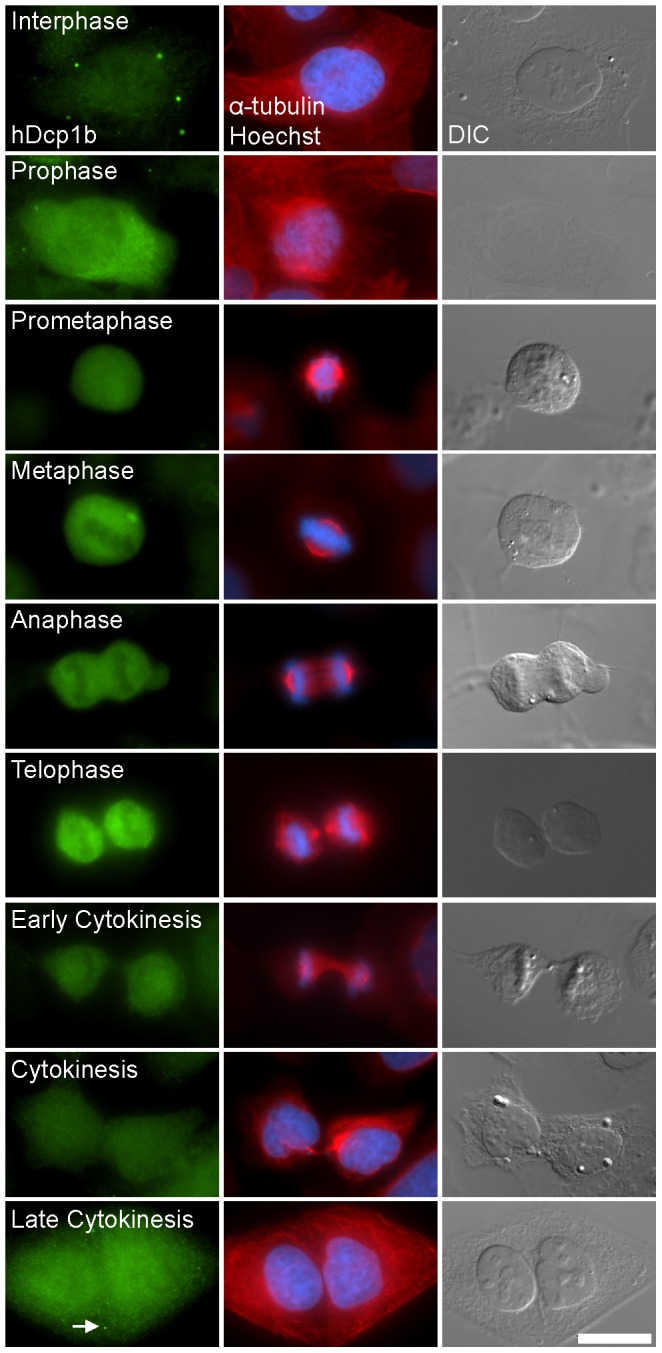
Figure 1
PB assembly and disassembly during the cell cycle.
Immunofluoresence staining of endogenous hDcp1b (green), u03b1-tubulin (red), DNA (Hoechst, blue) and DIC images show that PB structures disassemble during cell division. (Bar 20 u00b5m).
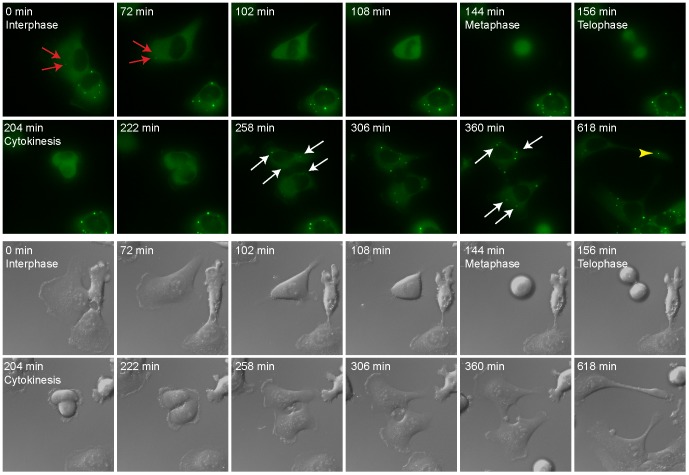
Figure 2
PB assembly and disassembly during cell division in living cells.
Cells stably expressing GFP-Dcp1a were simultaneously imaged in GFP and DIC showing the assembly and disassembly of PBs from a movie acquired for 14 hours. Cells were imaged every 6 min. Red arrows: P...
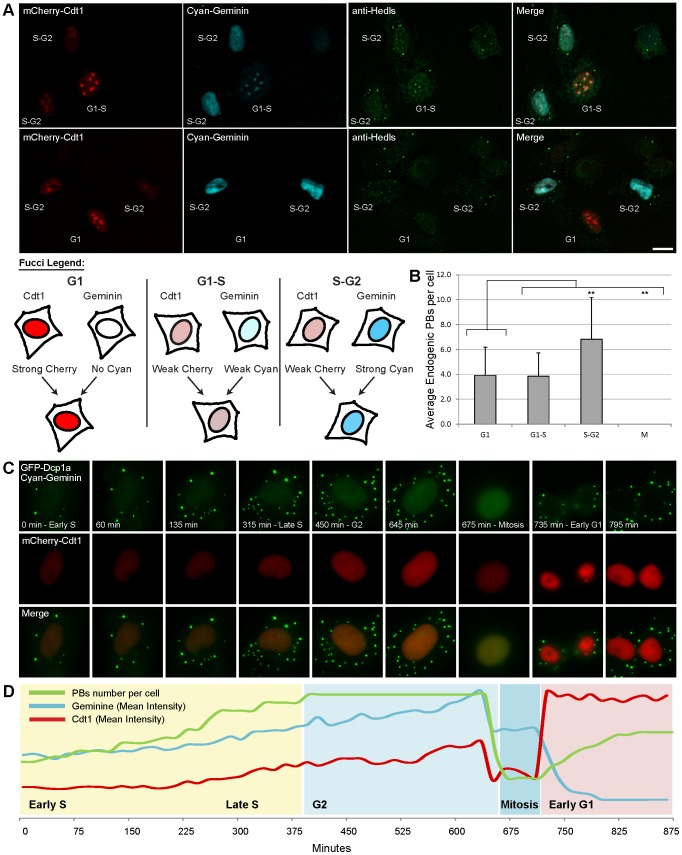
Figure 3
PB numbers increase as cells reach S/G2 phase of the cell cycle.
(A) The Fucci markers mCherry-Cdt1 (red) and AmCyan1-Geminin (cyan) were expressed in U2OS cells and then cells were stained with an anti-Hedls (green) antibody to mark PBs. (Bar 20 u00b5m). It was po...
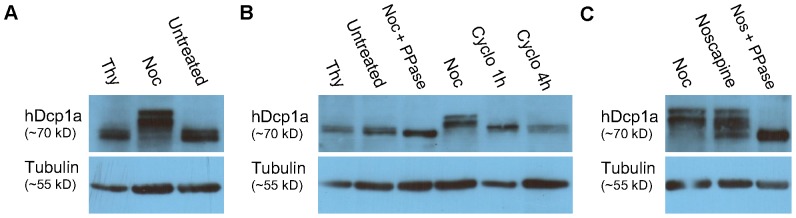
Figure 4
Dcp1a is hyper-phosphorylated during cell division.
Western blot analysis of (A) endogenous hDcp1a protein in U2OS cell extracts during interphase (untreated), metaphase (nocodazole block, Noc) and at G1/S (thymidine block, Thy), showed the appearance ...
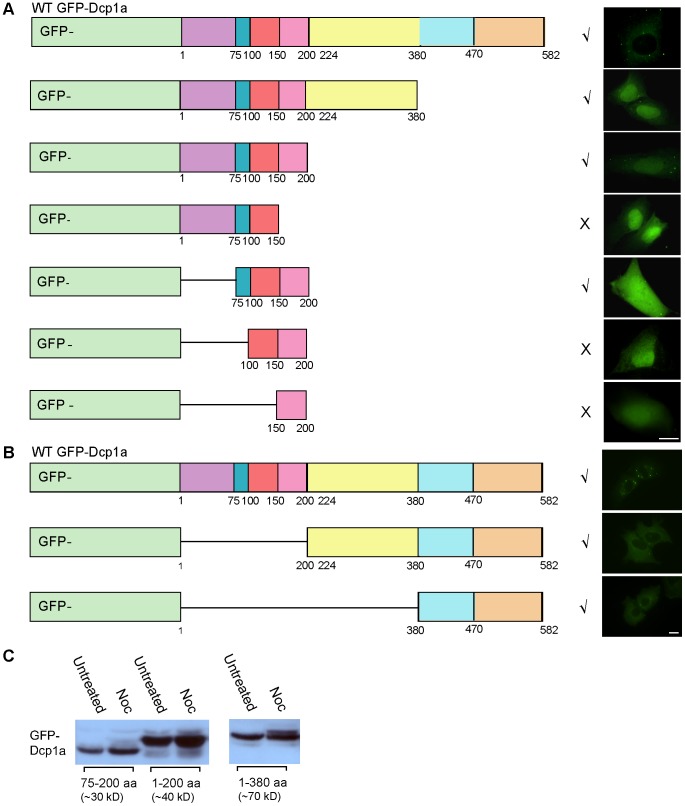
Figure 5
Phosphorylation of Dcp1a occurs in 200u2013380 region of the protein.
GFP constructs containing different fragments of the hDcp1a protein were transfected into U2OS cells and their assembly into PBs was monitored. The symbol u221a indicates accumulation in PBs and the s...
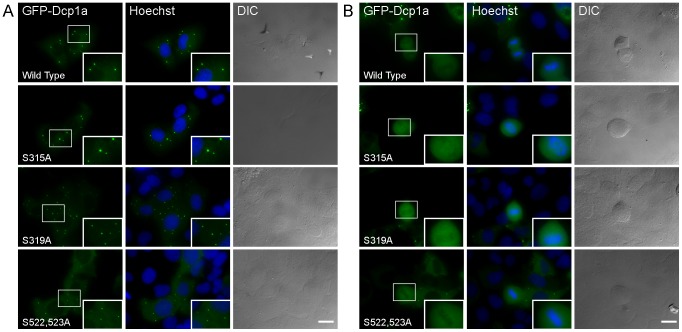
Figure 6
Serine mutated Dcp1a proteins assembled into PBs.
(A) Serine to alanine mutated GFP-Dcp1a proteins assembled in PBs in U2OS cells, and (B) disassembled during mitosis. Enlarged insets are boxed. DNA was counterstained with Hoechst. (Bar 20 u00b5m).
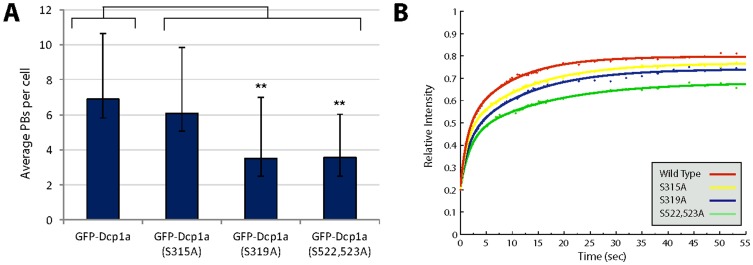
Figure 7
Serine 522 and 523 mutations affect Dcp1a association/dissociation dynamics in PBs.
(A) Plot showing the average number of PBs in cells expressing the different serine mutated forms of Dcp1a. A statistically significant reduction in PB numbers was seen in cells expressing the S522,52...
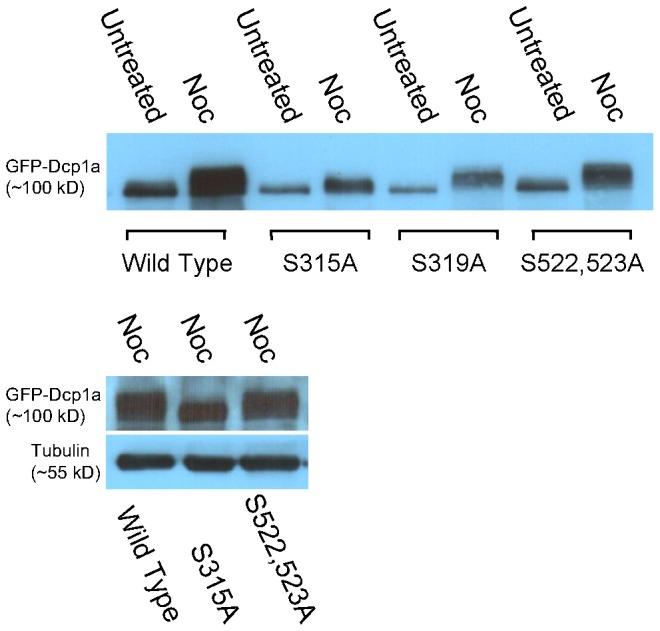
Figure 8
Serine 315 is important for the hyper-phosphorylation of Dcp1a during cell division.
Top - The S319A and S522,523A mutated GFP-Dcp1a proteins showed prominent hyper-phosphorylation patterns compared to the S315A protein. Bottom - blot comparing the mobility shifts of the mutated prote...
Figure images are served from the NIH/NLM PubMed Central Open Access Subset or Europe PMC; copyright remains with the publishers and authors.
💬 Discussion
0 commentsNo comments yet. Be the first to start a discussion!
Leave a Comment