Abstract
The ESX (or Type VII) secretion systems are protein export systems in mycobacteria and many Gram-positive bacteria that mediate a broad range of functions including virulence, conjugation, and metabolic regulation. These systems translocate folded dimers of WXG100-superfamily protein substrates across the cytoplasmic membrane. We report the cryo-electron microscopy structure of an ESX-3 system, purified using an epitope tag inserted with recombineering into the chromosome of the model organism Mycobacterium smegmatis. The structure reveals a stacked architecture that extends above and below the inner membrane of the bacterium. The ESX-3 protomer complex is assembled from a single copy of the EccB3, EccC3, and EccE3 and two copies of the EccD3 protein. In the structure, the protomers form a stable dimer that is consistent with assembly into a larger oligomer. The ESX-3 structure provides a framework for further study of these important bacterial transporters.
🔬 Techniques
🔭 Microscopes
✨ Fluorophores
🧪 Sample Preparation
🏭 Microscope Brands
🧪 Reagent Suppliers
📷 Detectors
💻 Software Details
💻 Code & Software
💾 Data Repositories
🏛️ Research Organizations (ROR)
Affiliated research institutions:
📋 Methods
Key resources table
Reagent type (species) or resource Designation Source or reference Identifiers Additional Information Biological sample Mycobacterium smegmatis mc(2)155 ATCC 700084 Wild type strain Biological sample Mycobacterium smegmatis mc(2)155 with ideR::mγδ200 (KanR) Dussurget et al., 1996 , Provided by GM Rodriguez Biological sample Mycobacterium smegmatis mc(2)155, MSMEG_0626-3C-EGFP This paper Biological sample Mycobacterium smegmatis mc(2)155 with ideR::mγδ200 (KanR), MSMEG_0626-3C-EGFP This paper Recombinant DNA reagent pKM444 Murphy et al., 2018 Addgene Plasmid #108319 Plasmid encoding for Che9c phage RecT and Bxb1 phage Integrase Recombinant DNA reagent pKM444 - zeo This paper Addition of zeocin resistance cassette to pKM444 plasmid Recombinant DNA reagent pKM468-3C-EGFP This paper Modified ORBIT tagging plasmid Sequenced-based reagent ORBIT targeting oligonucleotide This paper Oligo 5’ TGTGCGTTCCACTGGTTCCCCGGCAACCACCTGCTGCACGTGAGCCAGCCGGACTACCTAGGTTTGTACCGTACACCACTGAGACCGCGGTGGTTGACCAGACAAACCCGCCGGATGACCCGCTTCCTGCGCGGCTTCATGTTCGACTGAACCCTTCACCGAGGTCCG 3’ Antibody Anti-GFP stabilized antibody preparation Roche Cat. #: 11814460001 Dilution 1:10000 Antibody Anti-mouse IgG HRP-conjugated antibody R&D Systems Cat. #: HAF007 Dilution 1:5000 Antibody Goat anti-rabbit IgG antibody HRP GenScript Cat. #: A00098 Dilution 1:5000 Antibody Rabbit anti-GroEL Sigma-Aldrich Cat. #: G6532-.5ML Dilution 1:5000 Peptide, recombinant protein Human Rhinovirus (HRV) 3C Protease Thermo Scientific Pierce Cat. #: 88946 Commercial assay or kit Superose 6 Increase 10/300 GL GE Healthcare Cat. #: 29091596 Chemical compound, detergent DDM, n-Dodecyl-β-D-Maltopyranoside Inalco Cat. #: 1758-1350 Chemical compound, detergent GDN, glyco-diosgenin Anatrace Cat. #: GDN101 Other NativePAGE 3-12% Bis-Tris Protein Gels, 1.0 mm, 10-well ThermoFisher Scientific Cat. #: BN1001BOX Commercial assay or kit Pierce Silver Stain Kit Pierce Cat. #: PI24612 Software, algorithm SerialEM Mastronarde, 2005 https://bio3d.colorado.edu/SerialEM/ Software, algorithm MotionCor2 Zheng et al., 2017 http://msg.ucsf.edu/em/software/motioncor2.html Software, algorithm CTFfind4 Rohou and Grigorieff, 2015 https://grigoriefflab.umassmed.edu/ctffind4 Software, algorithm RELION Scheres, 2012 cam.ac.uk/relion/index.php/Download_%26_install Software, algorithm cisTEM Grant et al., 2018 https://cistem.org/ Software, algorithm cryosparc Punjani et al., 2017 https://cryosparc.com/docs/reference/install/ Software, algorithm pyem Asarnow et al., 2019 https://github.com/asarnow/pyem Software, algorithm coot Emsley et al., 2010 https://www2.mrc-lmb.cam. Software, algorithm raptorX Källberg et al., 2012 http://raptorx.uchicago.edu/ Software, algorithm phenix real space refine Afonine et al., 2018 https://www.phenix-online. Software, algorithm MDFF Trabuco et al., 2009 org/documentation/reference/refinement.html Software, algorithm namdinator Kidmose et al., 2019 https://namdinator.au.dk/ Software, algorithm pisa Krissinel, 2015 http://www.ccp4.ac.uk/pisa/ Software, algorithm chimera Pettersen et al., 2004 https://www.cgl.ucsf.edu/chimera/ Software, algorithm chimeraX Goddard et al., 2018 https://www.cgl.ucsf.edu/chimerax/ Software, algorithm DALI Holm and Laakso, 2016 http://ekhidna2.biocenter.helsinki.fi/dali/ Strain construction Mycobacteria smegmatis mc(2)155 (wild type) and Δ ideR cells were chromosomally tagged using the ORBIT protocol ( Figure 1—figure supplement 1 ). For wild type cells, the integrase and annealase expressing plasmid was pKM444. For recombineering in the Δi deR strain, which already contained a kanamycin resistance marker, we created a modified pKM444 plasmid with a zeocin resistance cassette inserted at the EcoIV restriction site. The tagging plasmid was pKM468 with a 3C protease cleavage site added before the EGFP tag. The targeting oligo had the sequence: 5’ TGTGCGTTCCACTGGTTCCCCGGCAACCACCTGCTGCACGTGAGCCAGCCGGACTACCTAGGTTTGTACCGTACACCACTGAGACCGCGGTGGTTGACCAGACAAACCCGCCGGATGACCCGCTTCCTGCGCGGCTTCATGTTCGACTGAACCCTTCACCGAGGTCCG 3’. M. smegmatis cells containing pKM444 were grown in an overnight liquid culture and induced for annealase and integrase expression. Cells were prepared for electroporation and electroporated with the targeting oligo and tagging plasmid. The transformed M. smegmatis were plated on hygromycin (wild type) or hygromycin and kanamycin (Δ ideR ) containing 7H9 plates and incubated at 37° C for 3 days. Colonies were verified for insertion of the tagging plasmid into the chromosome by PCR. Western blotting 100 mL of EccE 3 tagged wild type and Δ ideR knock out cells were grown overnight to an OD 600 of 1.0–1.2. Cells were pelleted and resuspended in 1 mL of buffer (50 mM Tris-HCl pH 8.0, 150 mM NaCl, 1% DDM) and sonicated for 30 s. Cell lysates were run on a 4–20% SDS-PAGE gel (GenScript) and transferred to PVDF membrane (BioRad) using a BioRad Trans-Blot Turbo Transfer System. The blot was washed with PBS and blocked in a 5% milk/PBS-T solution for 1 hr. The blot was incubated with mouse anti-GFP monoclonal antibody (Roche) overnight. After rinsing with PBS-T, the blot was incubated with anti-mouse IgG HRP-conjugated antibody (R&D Systems) for 2 hr. After activation (Amersham) the blot was imaged on a BioRad ChemiDoc. The blot was stripped with stripping buffer (ThermoFisher Scientific) as per the manufacture's instructions, and incubated overnight with rabbit anti-GroEL monoclonal antibody (Sigma-Aldrich). The blot was incubated with goat anti-rabbit IgG antibody HRP (GenScript) for 2 hr, activated (Amersham), and imaged on a BioRad ChemiDoc.
Show full methods section
Key resources table
Reagent type (species) or resource Designation Source or reference Identifiers Additional Information Biological sample Mycobacterium smegmatis mc(2)155 ATCC 700084 Wild type strain Biological sample Mycobacterium smegmatis mc(2)155 with ideR::mγδ200 (KanR) Dussurget et al., 1996 , Provided by GM Rodriguez Biological sample Mycobacterium smegmatis mc(2)155, MSMEG_0626-3C-EGFP This paper Biological sample Mycobacterium smegmatis mc(2)155 with ideR::mγδ200 (KanR), MSMEG_0626-3C-EGFP This paper Recombinant DNA reagent pKM444 Murphy et al., 2018 Addgene Plasmid #108319 Plasmid encoding for Che9c phage RecT and Bxb1 phage Integrase Recombinant DNA reagent pKM444 - zeo This paper Addition of zeocin resistance cassette to pKM444 plasmid Recombinant DNA reagent pKM468-3C-EGFP This paper Modified ORBIT tagging plasmid Sequenced-based reagent ORBIT targeting oligonucleotide This paper Oligo 5’ TGTGCGTTCCACTGGTTCCCCGGCAACCACCTGCTGCACGTGAGCCAGCCGGACTACCTAGGTTTGTACCGTACACCACTGAGACCGCGGTGGTTGACCAGACAAACCCGCCGGATGACCCGCTTCCTGCGCGGCTTCATGTTCGACTGAACCCTTCACCGAGGTCCG 3’ Antibody Anti-GFP stabilized antibody preparation Roche Cat. #: 11814460001 Dilution 1:10000 Antibody Anti-mouse IgG HRP-conjugated antibody R&D Systems Cat. #: HAF007 Dilution 1:5000 Antibody Goat anti-rabbit IgG antibody HRP GenScript Cat. #: A00098 Dilution 1:5000 Antibody Rabbit anti-GroEL Sigma-Aldrich Cat. #: G6532-.5ML Dilution 1:5000 Peptide, recombinant protein Human Rhinovirus (HRV) 3C Protease Thermo Scientific Pierce Cat. #: 88946 Commercial assay or kit Superose 6 Increase 10/300 GL GE Healthcare Cat. #: 29091596 Chemical compound, detergent DDM, n-Dodecyl-β-D-Maltopyranoside Inalco Cat. #: 1758-1350 Chemical compound, detergent GDN, glyco-diosgenin Anatrace Cat. #: GDN101 Other NativePAGE 3-12% Bis-Tris Protein Gels, 1.0 mm, 10-well ThermoFisher Scientific Cat. #: BN1001BOX Commercial assay or kit Pierce Silver Stain Kit Pierce Cat. #: PI24612 Software, algorithm SerialEM Mastronarde, 2005 https://bio3d.colorado.edu/SerialEM/ Software, algorithm MotionCor2 Zheng et al., 2017 http://msg.ucsf.edu/em/software/motioncor2.html Software, algorithm CTFfind4 Rohou and Grigorieff, 2015 https://grigoriefflab.umassmed.edu/ctffind4 Software, algorithm RELION Scheres, 2012 cam.ac.uk/relion/index.php/Download_%26_install Software, algorithm cisTEM Grant et al., 2018 https://cistem.org/ Software, algorithm cryosparc Punjani et al., 2017 https://cryosparc.com/docs/reference/install/ Software, algorithm pyem Asarnow et al., 2019 https://github.com/asarnow/pyem Software, algorithm coot Emsley et al., 2010 https://www2.mrc-lmb.cam. Software, algorithm raptorX Källberg et al., 2012 http://raptorx.uchicago.edu/ Software, algorithm phenix real space refine Afonine et al., 2018 https://www.phenix-online. Software, algorithm MDFF Trabuco et al., 2009 org/documentation/reference/refinement.html Software, algorithm namdinator Kidmose et al., 2019 https://namdinator.au.dk/ Software, algorithm pisa Krissinel, 2015 http://www.ccp4.ac.uk/pisa/ Software, algorithm chimera Pettersen et al., 2004 https://www.cgl.ucsf.edu/chimera/ Software, algorithm chimeraX Goddard et al., 2018 https://www.cgl.ucsf.edu/chimerax/ Software, algorithm DALI Holm and Laakso, 2016 http://ekhidna2.biocenter.helsinki.fi/dali/ Strain construction Mycobacteria smegmatis mc(2)155 (wild type) and Δ ideR cells were chromosomally tagged using the ORBIT protocol ( Figure 1—figure supplement 1 ). For wild type cells, the integrase and annealase expressing plasmid was pKM444. For recombineering in the Δi deR strain, which already contained a kanamycin resistance marker, we created a modified pKM444 plasmid with a zeocin resistance cassette inserted at the EcoIV restriction site. The tagging plasmid was pKM468 with a 3C protease cleavage site added before the EGFP tag. The targeting oligo had the sequence: 5’ TGTGCGTTCCACTGGTTCCCCGGCAACCACCTGCTGCACGTGAGCCAGCCGGACTACCTAGGTTTGTACCGTACACCACTGAGACCGCGGTGGTTGACCAGACAAACCCGCCGGATGACCCGCTTCCTGCGCGGCTTCATGTTCGACTGAACCCTTCACCGAGGTCCG 3’. M. smegmatis cells containing pKM444 were grown in an overnight liquid culture and induced for annealase and integrase expression. Cells were prepared for electroporation and electroporated with the targeting oligo and tagging plasmid. The transformed M. smegmatis were plated on hygromycin (wild type) or hygromycin and kanamycin (Δ ideR ) containing 7H9 plates and incubated at 37° C for 3 days. Colonies were verified for insertion of the tagging plasmid into the chromosome by PCR. Western blotting 100 mL of EccE 3 tagged wild type and Δ ideR knock out cells were grown overnight to an OD 600 of 1.0–1.2. Cells were pelleted and resuspended in 1 mL of buffer (50 mM Tris-HCl pH 8.0, 150 mM NaCl, 1% DDM) and sonicated for 30 s. Cell lysates were run on a 4–20% SDS-PAGE gel (GenScript) and transferred to PVDF membrane (BioRad) using a BioRad Trans-Blot Turbo Transfer System. The blot was washed with PBS and blocked in a 5% milk/PBS-T solution for 1 hr. The blot was incubated with mouse anti-GFP monoclonal antibody (Roche) overnight. After rinsing with PBS-T, the blot was incubated with anti-mouse IgG HRP-conjugated antibody (R&D Systems) for 2 hr. After activation (Amersham) the blot was imaged on a BioRad ChemiDoc. The blot was stripped with stripping buffer (ThermoFisher Scientific) as per the manufacture's instructions, and incubated overnight with rabbit anti-GroEL monoclonal antibody (Sigma-Aldrich). The blot was incubated with goat anti-rabbit IgG antibody HRP (GenScript) for 2 hr, activated (Amersham), and imaged on a BioRad ChemiDoc.
Protein purification
Purification for high resolution structural determination: M. smegmatis was grown in 6 L of 7H9 supplemented with 0.05% Tween 80 and 20 µg/mL kanamycin to an OD 600 of ~0.8. After harvest, cells were washed three times with PBS and frozen in liquid nitrogen before lysis with a cryogenic grinder (SPEX SamplePrep). 24.9 g of powdered cell material was resuspended by adding 56.3 mL 50 mM Tris-HCl pH 8.0, 150 mM NaCl, 1% DDM supplemented with 1X protease inhibitor cocktail (SigmaFast) and 224 units Benzonase endonuclease. The suspension was stirred for 120 min at 4°C. After centrifugation for 30 min at 98,000 g, the supernatant was incubated with 1.4 mL anti-GFP-nanobody resin for 110 min at 4°C. The resin was transferred to a column and washed sequentially with 28 ml of wash buffer (50 mM Tris-HCl pH 8.0, 150 mM NaCl and 0.1% GDN), 14 mL of high salt wash buffer (50 mM Tris-HCl pH 8.0, 400 mM NaCl, and 0.1% GDN), and 14 mL of wash buffer (50 mM Tris-HCl pH 8.0, 150 mM NaCl, and 0.1% GDN). To cleave off the purification tag, the resin was incubated o/n at 4°C with 70 units Pierce HRV 3C protease (Thermo Scientific Pierce) in 2.8 mL wash buffer supplemented with 0.2 mM DTT. This resin was sedimented by gentle centrifugation (300 x g for 3 min), the supernatant collected, and the resin was subsequently washed with 1.4 mL wash buffer. The supernatant and wash fraction were combined and concentrated using an Amicon Ultra-4 centrifugal filter unit with a 100 kDa molecular weight cut-off. The sample was centrifuged at 16,000 g before injection on a Superose 6 10/300 column equilibrated in 50 mM Tris-HCl pH 8.0, 150 mM NaCl and 0.021% GDN. Peak fractions were concentrated using a 0.5 mL centrifugal filter unit (Amicon, 100 kDa cut-off) to an A280 of 5.52 by Nanodrop reading in about ~30 µL . Purification completed for examination of the void fractions was similar except: volumes were scaled for a powder weight of 21.1 g. and the high salt wash was omitted. Blue-Native polyacrylamide gel electrophoresis (BN-PAGE) BN-PAGE experiments were carried out using the Invitrogen NativePAGE Novex Bis-Tris Gel system as recommended by the manufacturer. Samples were prepared in a total volume of 10 µL using 0.5 µL 5% G-250 sample additive. Electrophoresis was performed at a constant voltage of 105-120 V for 2-3.5 hr at 4°C. The gel was fixed and stained using the Pierce silver stain kit.
Cryo-EM – data acquisition
Samples were frozen for cryo-EM. Quantifoil R1.2/1.3, 400 mesh, copper grids were glow discharged using a Solarus plasma cleaner (Gatan) with an H 2 /O 2 mixture for 30 s. 2 µL of sample were applied per grid and the grids were plunged into liquid ethane using a FEI Vitrobot Mark IV. Initially, samples were screened, and test data sets were collected on a FEI Talos Arctica 200kV microscope equipped with a Gatan K2 Summit detector. For the initial screen of freezing conditions, 2499 movies were collected at a magnification of 36,000 with a pixel size of 1.14, and a defocus range of −1.5 to −2.5 µm, an exposure time of 9 s, and a dose rate of 7 electrons/Å 2 /second ( Table 1 ). Data collection for the final structure presented in the main text was collected on a FEI Titan Krios at 300kV with a Gatan K2 Summit detector. Two imaging sessions were used. In the first imaging session, 2705 movies were collected at a magnification of 29,000 with a pixel size of 0.82, and a defocus of −0.4 to −1.2 µm, an exposure time of 10 s to collect 100 total frames, and a dose rate of 8 electrons/Å 2 /second ( Table 1 ). In the second imaging session, data was collected on the same microscope with the same detector, 4632 movies were collected at a magnification of 29,000 with a pixel size of 0.82, and a defocus range of −0.6 to −1.4 µm, an exposure time of 10 s to collect 80 total frames, and a dose rate of 6.7 electrons/Å 2 /second. Data used to analyze the void, plateau, and peak regions of the SEC profile were collected on a FEI Talos Arctica at 200kV with a Gatan K3 detector. All micrographs were collected at a magnification of 28,000 with a pixel size of 0.9, and a defocus range of −1.5 to −2.5 µm, an exposure time of 11.7 s to collect 117 total frames at a total dose of 58 electrons/ Å 2 . For the void region, 1215 micrographs were collected.
Cryo-EM – data processing
For all data, movies were motion corrected using MotionCor2 ( Zheng et al., 2017 ) and CTF correction was performed using CTFfind4 ( Rohou and Grigorieff, 2015 ). For the Arctica dataset, particles were picked using a gaussian blob in either RELION ( Zivanov et al., 2018 ) or cisTEM ( Grant et al., 2018 ) and initial 2D classification was performed to remove obvious artifactual particles. Initially, a shotgun approach was taken to generate several initial models using RELION, cisTEM, and cryosparc ( Punjani et al., 2017 ). Once an initial model which contained realistic low-resolution features was generated, a user defined descent gradient was performed to improve the model with the goal of achieving accurate secondary structure features. First, all particles selected during 2D classification were refined in 3D against the randomly generated initial model. Second, a round of 3D classification with four classes and default RELION settings was performed and the best class selected. Third, the best class was refined as a single class in 3D classification with increasing Tau2_Fudge and decreasing search angle size. The resulting EM density map had clear transmembrane helix densities and was used as the model for a new 3D reconstruction. This reconstruction was used to back project models for reference-based particle picking in RELION. Two rounds of 2D classification were performed and the best classes selected. One round of 3D classification was performed using the Tau2_Fudge value optimized during the previous run through (T = 12) and the best class selected. A final 3D reconstruction of the Arctica data set yielded a map of about 4.7 Å resolution ( Figure 1—figure supplement 4 ). After motion correction and CTF determination, the final Titan Krios dataset was processed entirely using RELION. Particles were picked using a gaussian blob, and extracted as 4x binned particles. Two rounds of initial 2D classification were performed with T = 3 on the binned particles and obvious artifactual particles were removed. The final reconstruction from the Arctica dataset was used as the initial model for a 3D reconstruction of the binned particles. 3D classification with four classes and the previously optimized Tau2_Fudge value, T = 12, was performed on the binned particles. The two best classes were selected and re-extracted without binning. A 3D reconstruction was performed. A mask was created for the high-resolution region of the reconstruction and 3D classification without image alignment was performed focused on this region. The best class was selected and the subsequent 4.0 Å reconstruction is the consensus structure for the entire complex ( Figure 1—figure supplement 5 ). Focused classification of each protomer, the periplasmic EccB region, and the ATPase 1, 2, and 3 domains of EccC were performed. To perform focused classification, the center of mass of the region of interest was determined using chimera ( Pettersen et al., 2004 ). Particles were recentered on this area and reextracted. Masks for the region of interest were generated and 3D classification without image alignment was performed. The best class was selected and used for a focused 3D reconstruction without image alignment of the region of interest. A reconstruction was generated and density outside of the region of interest was subtracted. A final reconstruction of the masked and density subtracted particles was then performed. This procedure improved the resolution of the protomer i to 3.75 Å and protomer ii 3.83 Å, 5.8 Å resolution for the EccB 3 periplasmic domain, and ~7 Å resolution for the EccC 3 lower cytoplasmic region. To generate the symmetry expanded protomers based on non-point group symmetry (also known as non-crystallographic symmetry or NCS), a transformation matrix between the two protomers was calculated using chimera. Particles were then transformed and aligned using the subparticles.py and star.py utilities in pyem ( Asarnow et al., 2019 ) resulting in a particle stack with twice as many particles as the input file, each focused on protomer i or protomer ii. Density subtraction was performed to remove density outside of the symmetry expanded protomer, and focused classification and refinement were performed as described above. This procedure improved the resolution of the symmetry expanded protomer to 3.69 Å resolution. Atomic model building The cytoplasmic domain from the crystal structure of EccD 1 (PDB 4KV2) was docked into the cytoplasmic domains of the two EccD 3 molecules and the sequence was mutated. The remaining transmembrane domains of EccD 3 and the residues 14–93 of EccB 3 were built de novo in Coot ( Emsley et al., 2010 ) using baton building. The alpha helices of EccE 3 and EccC 3 were initially modeled using the RaptorX ( Källberg et al., 2012 ) homology server. The loops and strands of EccE 3 and EccC 3 were built in Coot using baton building. All models were subsequently refined individually, as a symmetry expanded protomer, left and right protomers, and as the full model using phenix real space refine ( Afonine et al., 2018 ), Coot, and the MDFF ( Trabuco et al., 2009 ) server, Namdinator ( Kidmose et al., 2019 ; Supplementary file 1 ).
Low resolution modeling
The left and right protomer map, periplasmic focused refined map, and lower cytoplasmic focused refined map were all docked into the consensus map and added together using chimera. The combined map was filtered to 10 Å resolution to match the lowest resolution component. Homology models for amino acids 94–516 of EccB 3 , the transmembrane helixes of EccC 3 , and 404–1268 of EccC 3 were generated using RaptorX. These models were fit into the combined map density using the fit map to model utility in Chimera. The full model was refined using phenix.real_space_refine. Model interpretation and display Buried surface area between subunits was calculated by PISA ( Krissinel, 2015 ). Atomic models for individual proteins were compared against the PDB using the DALI server ( Holm and Laakso, 2016 ). Chimera and ChimeraX ( Goddard et al., 2018 ) were used to display maps and models for figure creation. Consurf ( Ashkenazy et al., 2016 ) was used to produce multisequence alignments and to color structural models by homology.
Additional files Supplementary file 1. Model Refinement Statistics. Supplementary file 2. Top Dali server hits. Supplementary file 3. Buried surface area. Transparent reporting form
📊 Figures
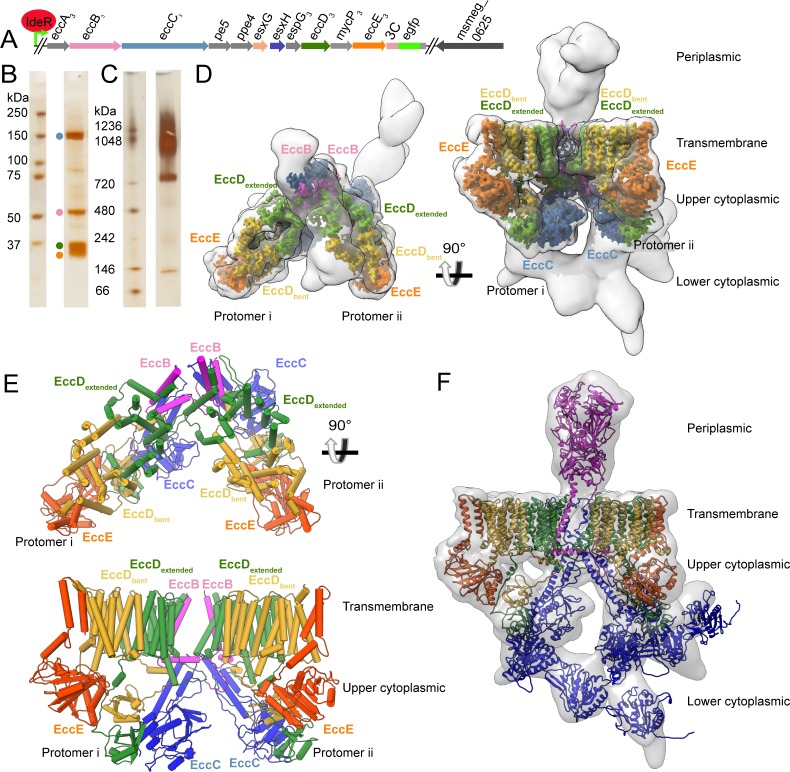
Figure 1.
Overview of the ESX-3 tagging, purification, and structure.
( A ) The ESX-3 operon in M.u00a0smegmatis and the placement of the purification tag. Genomic deletion of ideR derepresses ESX-3 to boost expression for purification. ( B ) SDS-PAGE of purified ESX-3 ...
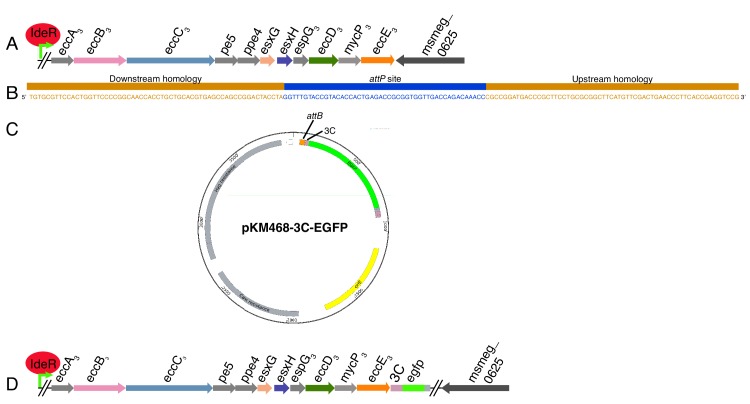
Figure 1u2014figure supplement 1.
ORBIT tagging of the chromosomal copy of EccE 3 .
( A ) Diagram of the ESX-3 operon in M.u00a0smegmatis mc(2)155. ( B ) The targeting oligo used to insert the attP site into the chromosome. ( C ) The tagging plasmid.( D ) Cartoon of the resulting cha...
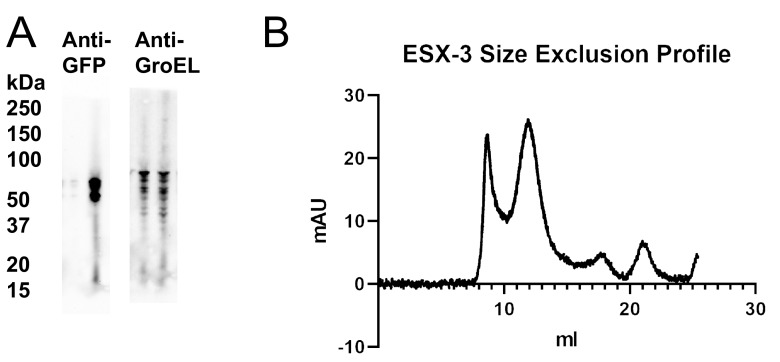
Figure 1u2014figure supplement 2.
ESX-3 dimer purification optimization.
( A ) Western blot of solubilized cell material with EccE3 tagged with EGFP.u00a0Lane 1, wild type background. Lane 2, u0394ideR background. ( B ) Size exclusion profile for the ESX-3 dimeru00a0purifi...
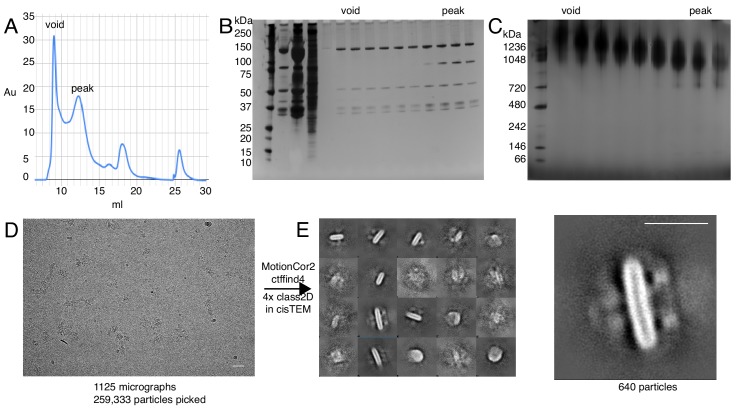
Figure 1u2014figure supplement 3.
Examination of the void volume.
( A ) Size exclusion profile with void volume and peak fractions indicated.u00a0( B ) SDS-PAGE of all fractions from the beginning of elution until the end of the peak fraction. ( C ) BN-PAGE of the v...
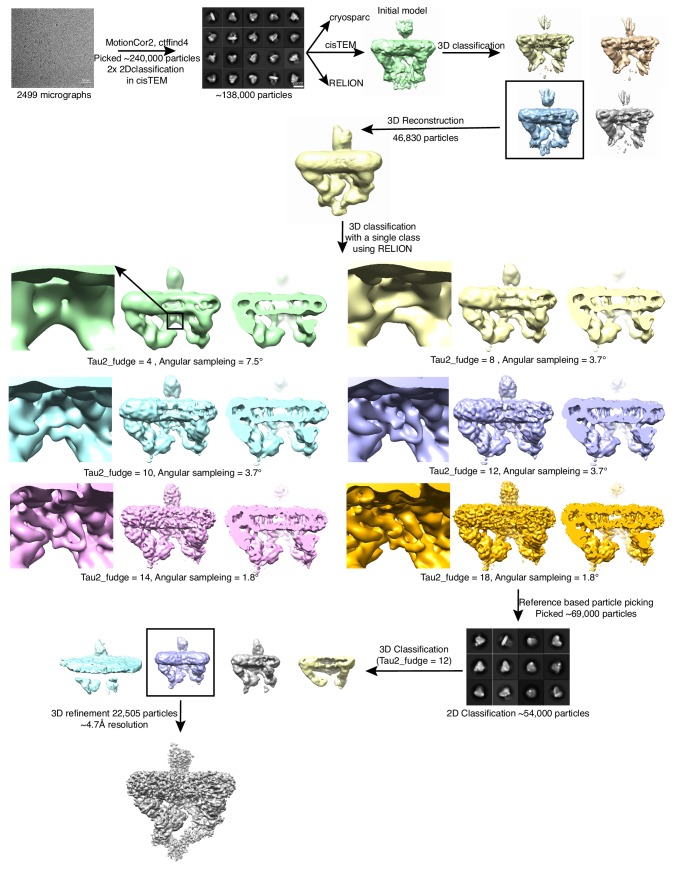
Figure 1u2014figure supplement 4.
Initial data collection and initial model generation.
An initial data set was collected on a Talos Arctica microscope. The final refinement from this data processing was used as the starting model for future data processing.
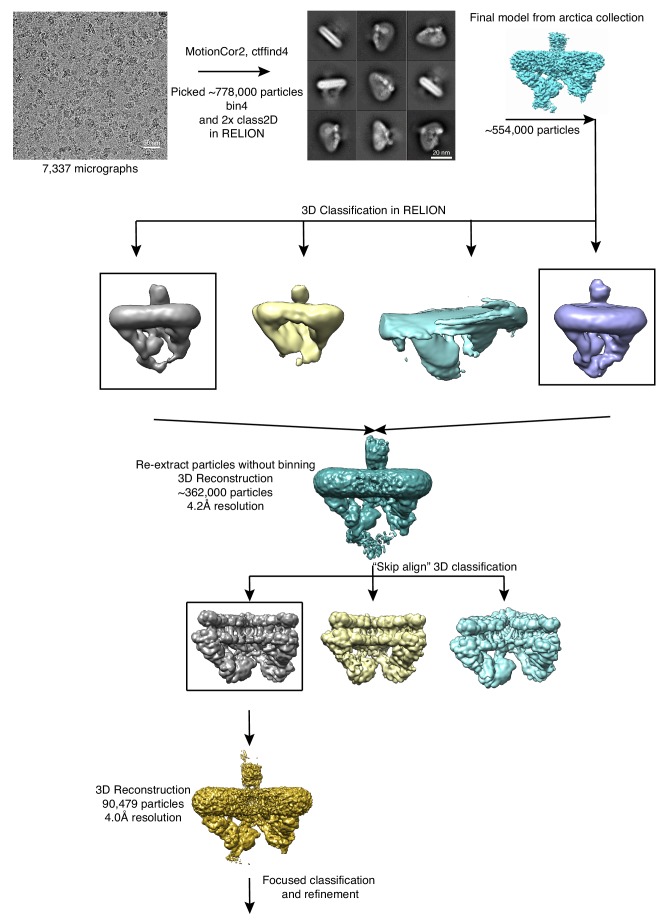
Figure 1u2014figure supplement 5.
Data processing workflow for final data collection.
Data was collected on a Titan Krios. Particles from the final reconstruction were subsequently used for focused classification and refinement.
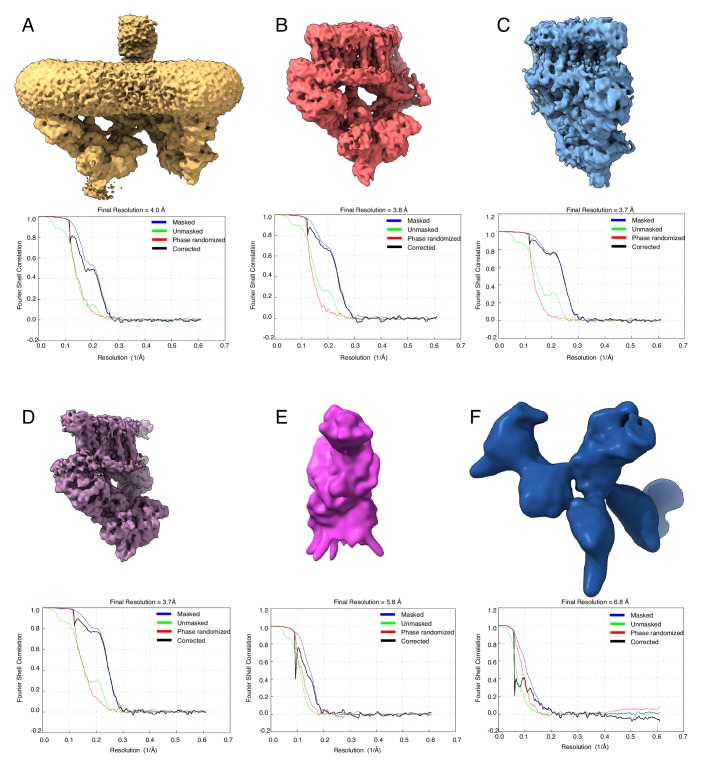
Figure 1u2014figure supplement 6.
Consensus and focused refinements.
( A ) Consensus refinement map and FSC curve for the ESX-3 complex.u00a0Focused refinement maps and FSC curves for ( B ) the left protomer of the ESX-3 complex, ( C ) the right protomer of the ESX-3 c...
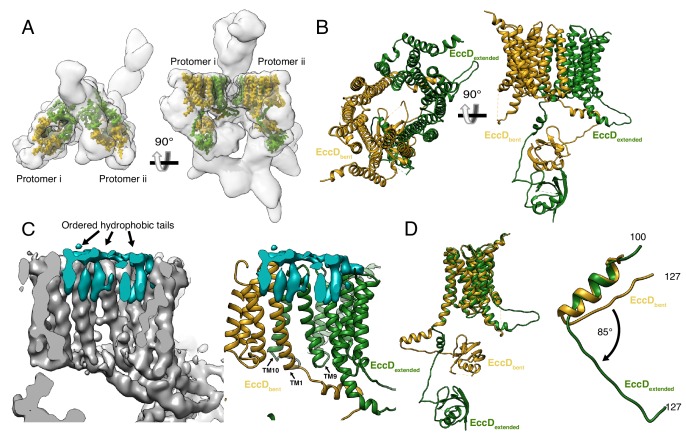
Figure 2.
The structure of EccD 3 .
( A ) EccD 3-bent (yellow) and EccD 3-extended (green) in the context of the overall ESX-3 dimer (gray transparency).u00a0( B ) Atomic models of EccD 3-bent and EccD 3-extended ( C ) An unsharpened el...
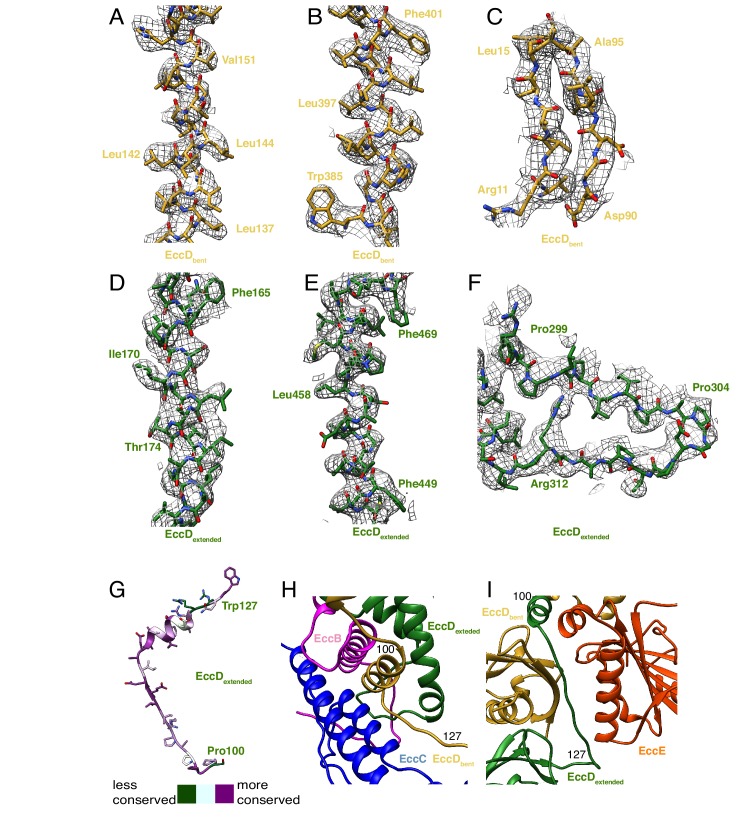
Figure 2u2014figure supplement 1.
EccD 3 map and model.
Map to model fits for EccD 3-bent for ( A ) transmembrane helix 1, amino acids 136u2013153, ( B ) transmembrane u03b1-helix 1, amino acids 385u2013402, andu00a0( C ) soluble domain u03b2-strands amino...
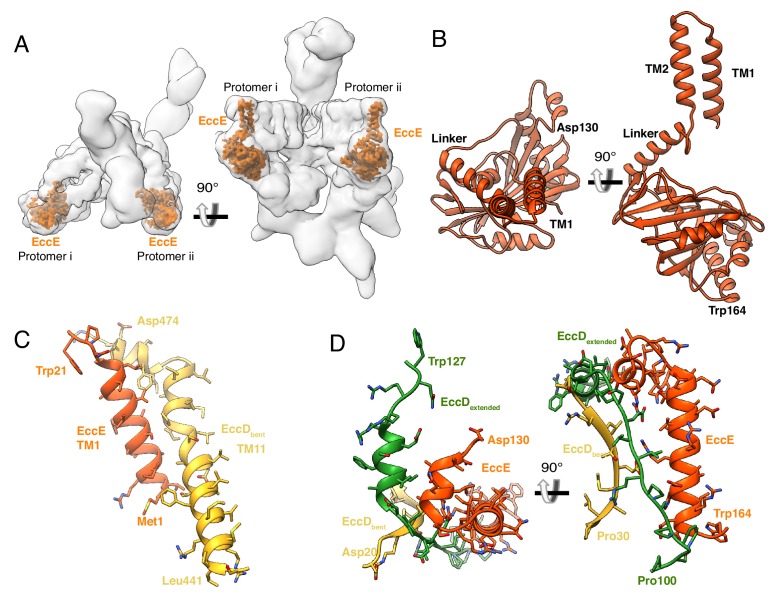
Figure 3.
The structure and protein-protein interactions of EccE 3 .
( A ) The placement of EccE 3 in the overall ESX-3 dimer.u00a0( B ) Atomic model of EccE 3 ( C ) Transmembrane helix 1 of EccE 3 interacts with transmembrane helix 11 of EccD 3-bent ( D ) Two soluble ...
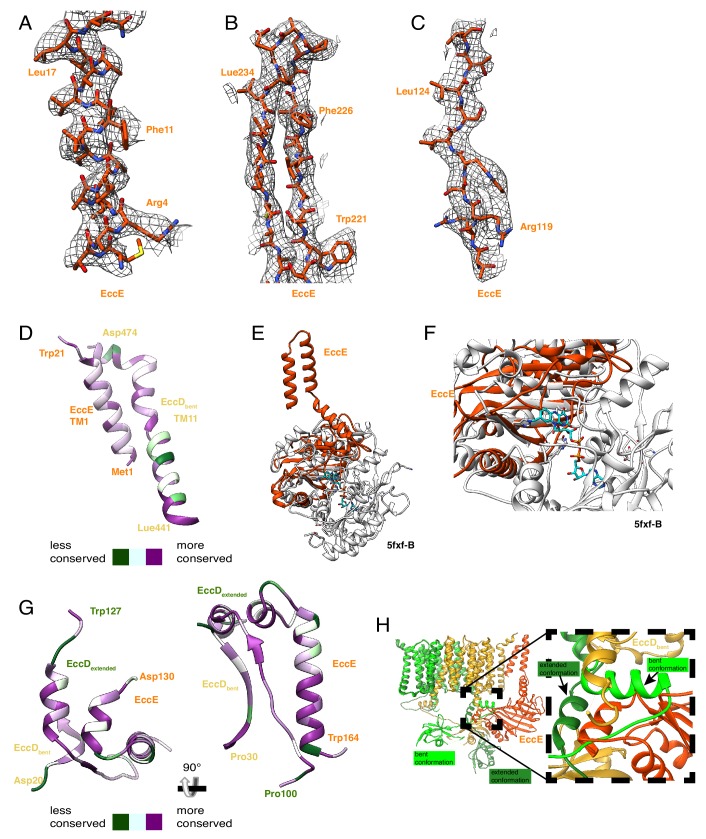
Figure 3u2014figure supplement 1.
EccE 3 map and model.
( A ) Map and model comparison for transmembrane helix 1, amino acids 1 to 18.u00a0( B ) Beta strand separation, amino acids amino acids 221 to 240. ( C ) A single beta strand, amino acids 117 to 126....
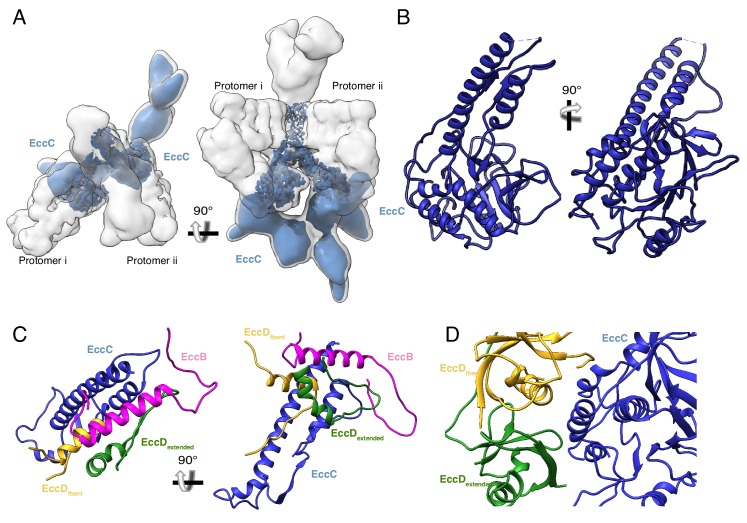
Figure 4.
The structure and protein-protein interactions of EccC 3 .
( A ) The placement of EccC 3 in the overall ESX-3 dimer.u00a0( B ) Atomic model of the EccC 3 DUF ( C ) The stalk helices of EccC 3 interact with EccB 3 , EccD 3-bent , and EccD 3-extended ( D ) Inte...
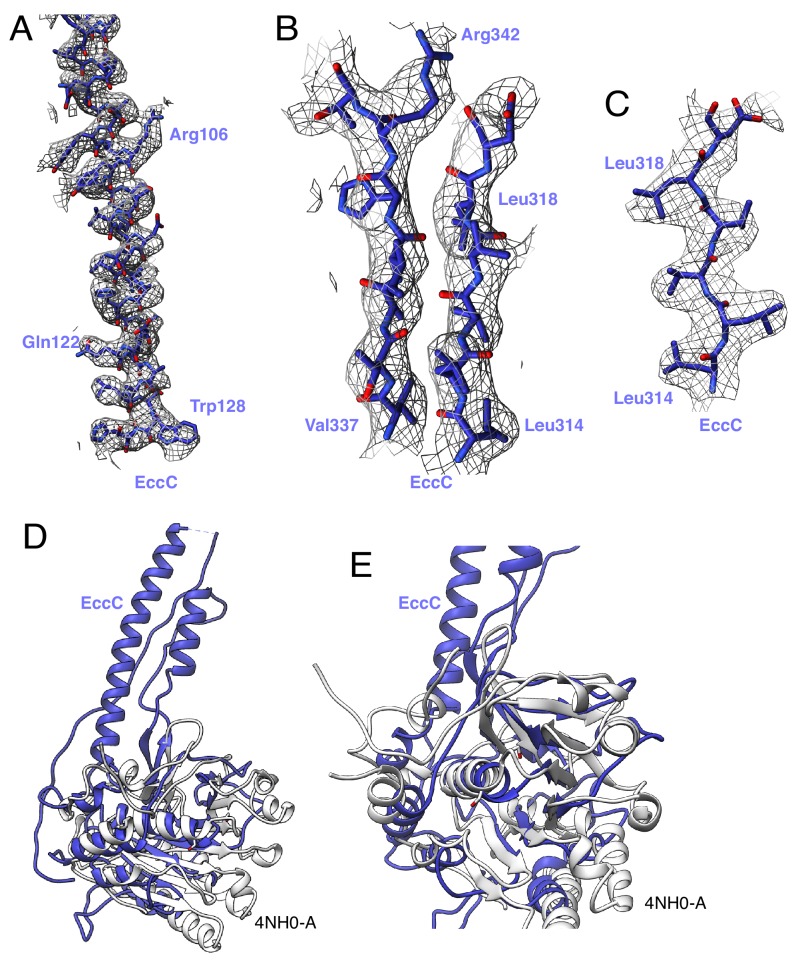
Figure 4u2014figure supplement 1.
EccC 3 map and model.
( A ) Map and model of the EccC DUF domain, amino acids amino acids 97 to 130.u00a0( B ) Two beta strands in the EccC DUF domain, amino acids 314 to 319 and 337 to 343. ( C ) Beta strand in the EccC D...
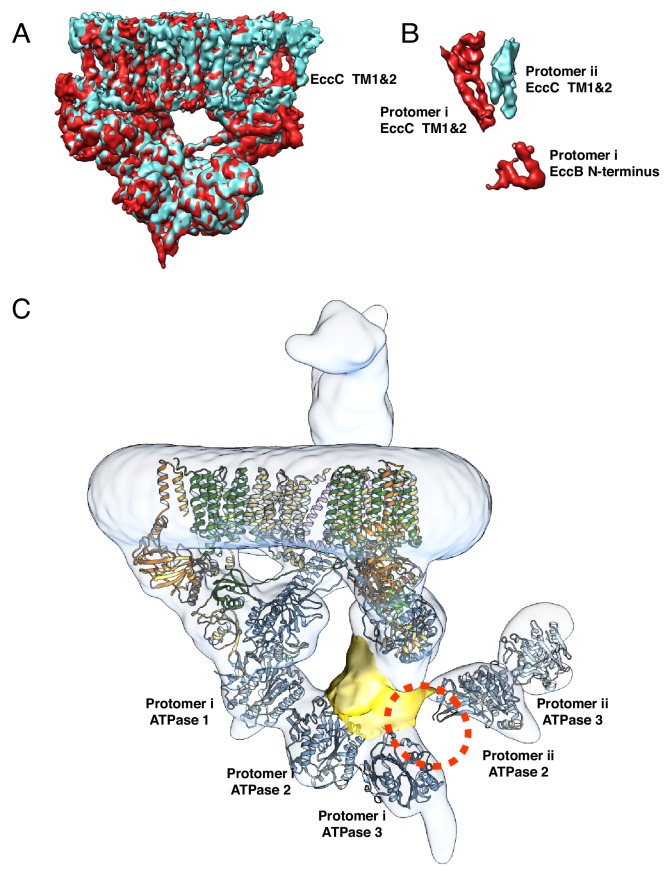
Figure 4u2014figure supplement 2.
Conformational differences between protomer i and protomer ii.
( A ) Overlay of the focused refined maps of the transmembrane and upper cytoplasmic regions of protomer i (red) and protomer ii (blue).u00a0The two protomers are nearly identical except in the transm...
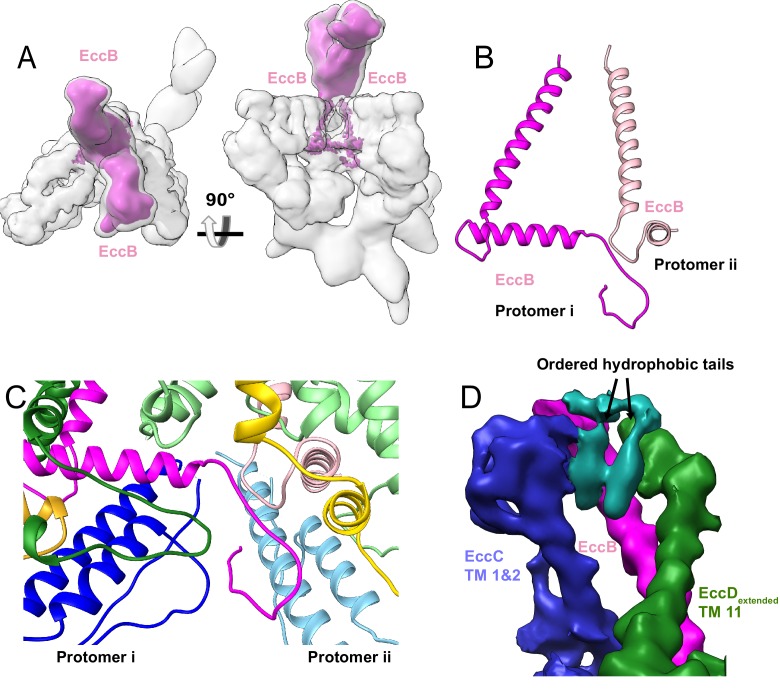
Figure 5.
The periplasmic multimerization domain.
( A ) EccB 3 (pink) in the context of the overall ESX-3 dimer (gray transparency).u00a0EccB 3 has a single-pass transmembrane domain which extends into a large periplasmic domain which was resolved at...
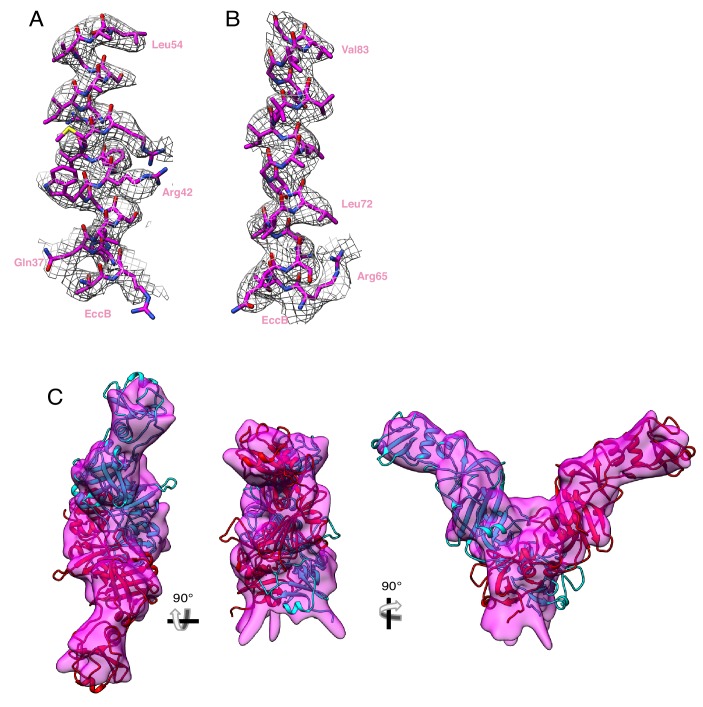
Figure 5u2014figure supplement 1.
EccB 3 maps and models.
( A ) Fit between map and model in the linker helix, amino acids 34 to 54.u00a0( B ) Fit between map and model in the transmembrane helix, amino acids 65 to 85. ( C ) Fit between homology models of th...
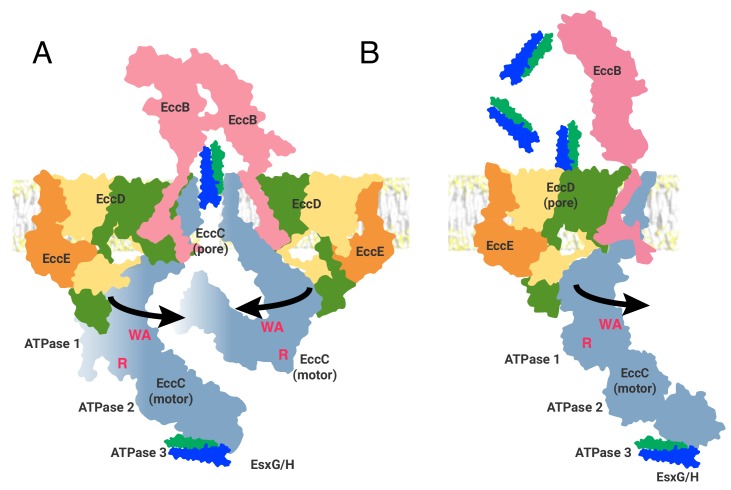
Figure 6.
Two models of the ESX-3 translocon complex.
ATPase activity entails, at a minimum, oligomerization of ATPase 1 to bring the R-finger (R) into proximity of the catalytic site, marked by the Walker A motif (WA).u00a0This requires at least 65 u00c...
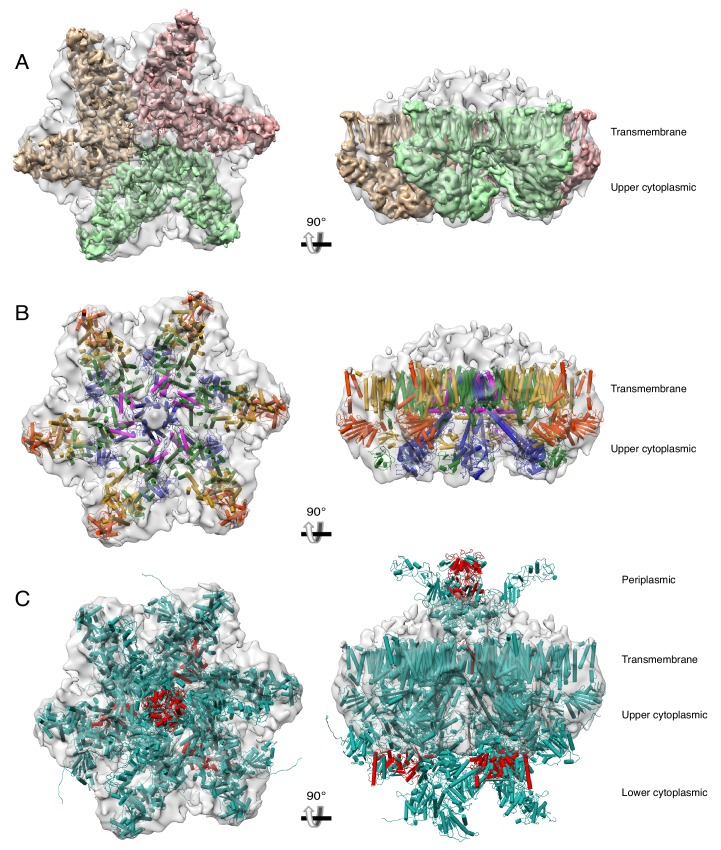
Figure 6u2014figure supplement 1.
A hexameric model of the ESX-3 dimer.
( A ) Fit of three copies of the transmembrane and upper cytoplasmic regions of the ESX-3 translocon complex into the ESX-5 hexameric structure (EMDB 3596).u00a0The ESX-3 translocon complex was filter...
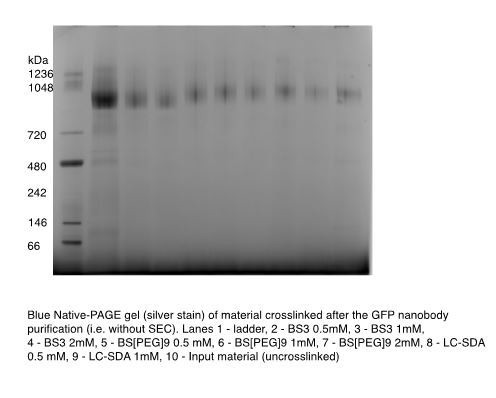
Author response image 1.
Figure images are served from the NIH/NLM PubMed Central Open Access Subset or Europe PMC; copyright remains with the publishers and authors.
💬 Discussion
0 commentsNo comments yet. Be the first to start a discussion!
Leave a Comment