Abstract
Transcription sites are detected by labeling nascent transcripts with BrUTP in permeabilized 3T3 mouse fibroblasts followed by laser scanning confocal microscopy. Inhibition and enzyme digestion studies confirm that the labeled sites are from RNA transcripts and that RNA polymerase I (RP I) and II (RP II) are responsible for nucleolar and extranucleolar transcription, respectively. An average of 2,000 sites are detected per nucleus with over 90% in the extranucleolar compartment where they are arranged in clusters and three-dimensional networklike arrays. The number of transcription sites, their three-dimensional organization and arrangement into functional zones (Wei et al. 1998) is strikingly maintained after extraction for nuclear matrix. Significant levels of total RP II mediated transcription sites (45%) were associated with splicing factor–rich nuclear speckles even though the speckles occupied <10% of the total extranucleolar space. Moreover, the vast majority of nuclear speckles (>90%) had moderate to high levels of associated transcription activity. Transcription sites were found along the periphery as well as inside the speckles themselves. These spatial relations were confirmed in optical sections through individual speckles and after in vivo labeling of nascent transcripts. Our results demonstrate that nuclear speckles and their surrounding regions are major sites of RP II-mediated transcription in the cell nucleus, and support the view that both speckle- and nonspeckle-associated regions of the nucleus contain sites for the coordination of transcription and splicing processes.
🔬 Techniques
✨ Fluorophores
🧪 Sample Preparation
🔬 Cell Lines
🏭 Microscope Brands
🧪 Reagent Suppliers
🏛️ Research Organizations (ROR)
Affiliated research institutions:
📋 Methods
Labeling of DNA Replication and Transcription Sites and Immunofluorescence Procedures
DNA replication and transcription sites were labeled based on previous procedures ( Nakayasu and Berezney 1989 ; Jackson et al. 1993 ; Wansink et al. 1993 ) and those briefly reported by Wei et al. 1998 . Mouse 3T3 fibroblast cells are grown on coverslips in DME or MEM supplied with 10% FCS for 24–48 h. Cells are washed with ice-cold TBS buffer (10 mM Tris-HCl, pH 7.4, 150 mM NaCl, 5 mM MgCl 2 ) and further washed with glycerol buffer (20 mM Tris-HCl, pH 7.4, 25% glycerol, 5 mM MgCl 2 , 0.5 mM EGTA, 0.5 mM PMSF) for 10 min on ice. Washed cells were permeabilized with 0.025% Triton X-100 in glycerol buffer (with 25 U/ml of RNasin; Promega Corp.) on ice for 3 min and immediately incubated at room temperature for 30 min with nucleic acid synthesis buffer (50 mM Tris-HCl, pH 7.4, 10 mM MgCl 2 , 150 mM NaCl, 25% glycerol, 0.5 mM PMSF, 25 U/ml of RNasin, 1.8 mM ATP) supplemented with 0.5 mM CTP, GTP, and BrUTP (Sigma Chemical Co.) for labeling transcription sites (nascent RNA), 0.1 mM dATP, dCTP, dGTP, and 25 μM digoxigenin-11-dUTP (Boehringer Mannheim) for labeling DNA replication sites (nascent DNA), or both for simultaneously labeling transcription and replication sites. After incorporation, the cells were fixed with 3% freshly made paraformaldehyde in PBS on ice for 5 min, washed with ice-cold TBS-Tween buffer (10 mM Tris-HCl, pH 7.4, 150 mM NaCl, 0.2 mM MgCl 2 , 0.2% Tween 20), blocked with 5% goat serum and incubated with rat anti-BrU antibodies (IgG, SeraLab) followed by biotin-conjugated goat anti–rat IgG (1:50; Jackson ImmunoResearch Laboratories, Inc.) and Texas red–conjugated streptavidin (1:100; GIBCO BRL) to detect transcription sites. Replication sites were detected with FITC-conjugated sheep antidigoxigenin Fab fragments (1:10; Boehringer Mannheim). All incubations were performed at room temperature for 30 min. Alternatively, nascent RNA was labeled in vivo, by pulsing 3T3 cells for 2 min with 30 μM BrU (Sigma Chemical Co.). The biotin-strepavidin enhancement system resulted in greatly improved sensitivity for detected individual transcription sites compared with a standard secondary antibody approach and was absolutely essential for detecting transcription sites after 2-min in vivo pulses of BrU. Nuclear speckles were decorated with the Y12 mAb to Sm, which recognizes common core proteins of snRNPs involved in RNA processing ( Lerner et al. 1981 ; Zieve and Sauterer 1990 ), followed by goat anti–mouse IgG (1:20–50; Jackson ImmunoResearch Laboratories, Inc.) conjugated to FITC or Texas red. Coiled bodies and the nuclear lamina were decorated with rabbit polyclonal anticoilin and antilamin B antibodies, respectively, and detected with FITC- or Texas red–conjugated goat anti–rabbit IgG (1:20–50; Jackson ImmunoResearch Laboratories, Inc.). Coverslips were mounted on slides in Slow-Fade (Molecular Probes, Inc.) and stored at −20°C for microscopic examination. Laser Scanning Confocal Microscopy, Image Processing, and Quantitation Optical sections (0.5 or 0.3 μm where indicated) were collected with a confocal microscope (MRC-1024; Bio-Rad) equipped with a Nikon Optiphot 2 microscope, a Nikon 60×, 1.4 NA objective, and a krypton argon laser to simultaneously excite FITC and Texas red at 488 and 568 nm, respectively. Emissions were collected with filters 522-DF32 for FITC and HQ598-40 for Texas red. The pixel intensity distribution was checked before image collection and adjusted so that the pixel intensities were all below saturation. The total number of transcription sites are calculated by a new and highly improved segmentation program, presented in detail elsewhere ( Samarabandu et al. 1995 ). In brief, by using two-dimensional image segmentation on the individual slices to obtain transcription site contours and combining this high level two-dimensional data using a modified three-dimensional connected component labeling algorithm with weak connectivity in the Z direction, we were able to reconstruct the network of three-dimensional transcription sites. Instead of using the equivalent of traditional two-dimensional 8-connectivity in three dimensions, we used a metric that evaluated the amount of overlap between successive sections to determine whether the two contours belong to the same site. After determining the three-dimensional boundary of transcription sites, the center of gravity of each site was calculated by averaging the (x, y, z) coordinates of all voxels that belong to the site ( Samarabandu et al. 1995 ). Segmentation of the nuclear speckles, nucleoli, the total nuclei, and measurement of the size and intensity of segregated areas was performed in IPLab (Signal Analytics Corp.). Distribution of transcription sites between the nuclear speckles and other nuclear regions was determined by direct measurement. Fluorescence signal intensities from unprocessed confocal microscopic images were measured in IPLab. In brief, the extranucleolar regions, nucleolar regions, and the internal region of the nuclear speckles were manually selected and the mean intensities were calculated after multiple scans through the areas under analysis. The nucleolar signal was selected as background and subtracted from the signal emitting from the speckle and extranucleolar regions.
Show full methods section
Labeling of DNA Replication and Transcription Sites and Immunofluorescence Procedures
DNA replication and transcription sites were labeled based on previous procedures ( Nakayasu and Berezney 1989 ; Jackson et al. 1993 ; Wansink et al. 1993 ) and those briefly reported by Wei et al. 1998 . Mouse 3T3 fibroblast cells are grown on coverslips in DME or MEM supplied with 10% FCS for 24–48 h. Cells are washed with ice-cold TBS buffer (10 mM Tris-HCl, pH 7.4, 150 mM NaCl, 5 mM MgCl 2 ) and further washed with glycerol buffer (20 mM Tris-HCl, pH 7.4, 25% glycerol, 5 mM MgCl 2 , 0.5 mM EGTA, 0.5 mM PMSF) for 10 min on ice. Washed cells were permeabilized with 0.025% Triton X-100 in glycerol buffer (with 25 U/ml of RNasin; Promega Corp.) on ice for 3 min and immediately incubated at room temperature for 30 min with nucleic acid synthesis buffer (50 mM Tris-HCl, pH 7.4, 10 mM MgCl 2 , 150 mM NaCl, 25% glycerol, 0.5 mM PMSF, 25 U/ml of RNasin, 1.8 mM ATP) supplemented with 0.5 mM CTP, GTP, and BrUTP (Sigma Chemical Co.) for labeling transcription sites (nascent RNA), 0.1 mM dATP, dCTP, dGTP, and 25 μM digoxigenin-11-dUTP (Boehringer Mannheim) for labeling DNA replication sites (nascent DNA), or both for simultaneously labeling transcription and replication sites. After incorporation, the cells were fixed with 3% freshly made paraformaldehyde in PBS on ice for 5 min, washed with ice-cold TBS-Tween buffer (10 mM Tris-HCl, pH 7.4, 150 mM NaCl, 0.2 mM MgCl 2 , 0.2% Tween 20), blocked with 5% goat serum and incubated with rat anti-BrU antibodies (IgG, SeraLab) followed by biotin-conjugated goat anti–rat IgG (1:50; Jackson ImmunoResearch Laboratories, Inc.) and Texas red–conjugated streptavidin (1:100; GIBCO BRL) to detect transcription sites. Replication sites were detected with FITC-conjugated sheep antidigoxigenin Fab fragments (1:10; Boehringer Mannheim). All incubations were performed at room temperature for 30 min. Alternatively, nascent RNA was labeled in vivo, by pulsing 3T3 cells for 2 min with 30 μM BrU (Sigma Chemical Co.). The biotin-strepavidin enhancement system resulted in greatly improved sensitivity for detected individual transcription sites compared with a standard secondary antibody approach and was absolutely essential for detecting transcription sites after 2-min in vivo pulses of BrU. Nuclear speckles were decorated with the Y12 mAb to Sm, which recognizes common core proteins of snRNPs involved in RNA processing ( Lerner et al. 1981 ; Zieve and Sauterer 1990 ), followed by goat anti–mouse IgG (1:20–50; Jackson ImmunoResearch Laboratories, Inc.) conjugated to FITC or Texas red. Coiled bodies and the nuclear lamina were decorated with rabbit polyclonal anticoilin and antilamin B antibodies, respectively, and detected with FITC- or Texas red–conjugated goat anti–rabbit IgG (1:20–50; Jackson ImmunoResearch Laboratories, Inc.). Coverslips were mounted on slides in Slow-Fade (Molecular Probes, Inc.) and stored at −20°C for microscopic examination. Laser Scanning Confocal Microscopy, Image Processing, and Quantitation Optical sections (0.5 or 0.3 μm where indicated) were collected with a confocal microscope (MRC-1024; Bio-Rad) equipped with a Nikon Optiphot 2 microscope, a Nikon 60×, 1.4 NA objective, and a krypton argon laser to simultaneously excite FITC and Texas red at 488 and 568 nm, respectively. Emissions were collected with filters 522-DF32 for FITC and HQ598-40 for Texas red. The pixel intensity distribution was checked before image collection and adjusted so that the pixel intensities were all below saturation. The total number of transcription sites are calculated by a new and highly improved segmentation program, presented in detail elsewhere ( Samarabandu et al. 1995 ). In brief, by using two-dimensional image segmentation on the individual slices to obtain transcription site contours and combining this high level two-dimensional data using a modified three-dimensional connected component labeling algorithm with weak connectivity in the Z direction, we were able to reconstruct the network of three-dimensional transcription sites. Instead of using the equivalent of traditional two-dimensional 8-connectivity in three dimensions, we used a metric that evaluated the amount of overlap between successive sections to determine whether the two contours belong to the same site. After determining the three-dimensional boundary of transcription sites, the center of gravity of each site was calculated by averaging the (x, y, z) coordinates of all voxels that belong to the site ( Samarabandu et al. 1995 ). Segmentation of the nuclear speckles, nucleoli, the total nuclei, and measurement of the size and intensity of segregated areas was performed in IPLab (Signal Analytics Corp.). Distribution of transcription sites between the nuclear speckles and other nuclear regions was determined by direct measurement. Fluorescence signal intensities from unprocessed confocal microscopic images were measured in IPLab. In brief, the extranucleolar regions, nucleolar regions, and the internal region of the nuclear speckles were manually selected and the mean intensities were calculated after multiple scans through the areas under analysis. The nucleolar signal was selected as background and subtracted from the signal emitting from the speckle and extranucleolar regions.
Labeling of DNA Replication and Transcription Sites and Immunofluorescence Procedures
DNA replication and transcription sites were labeled based on previous procedures ( Nakayasu and Berezney 1989 ; Jackson et al. 1993 ; Wansink et al. 1993 ) and those briefly reported by Wei et al. 1998 . Mouse 3T3 fibroblast cells are grown on coverslips in DME or MEM supplied with 10% FCS for 24–48 h. Cells are washed with ice-cold TBS buffer (10 mM Tris-HCl, pH 7.4, 150 mM NaCl, 5 mM MgCl 2 ) and further washed with glycerol buffer (20 mM Tris-HCl, pH 7.4, 25% glycerol, 5 mM MgCl 2 , 0.5 mM EGTA, 0.5 mM PMSF) for 10 min on ice. Washed cells were permeabilized with 0.025% Triton X-100 in glycerol buffer (with 25 U/ml of RNasin; Promega Corp.) on ice for 3 min and immediately incubated at room temperature for 30 min with nucleic acid synthesis buffer (50 mM Tris-HCl, pH 7.4, 10 mM MgCl 2 , 150 mM NaCl, 25% glycerol, 0.5 mM PMSF, 25 U/ml of RNasin, 1.8 mM ATP) supplemented with 0.5 mM CTP, GTP, and BrUTP (Sigma Chemical Co.) for labeling transcription sites (nascent RNA), 0.1 mM dATP, dCTP, dGTP, and 25 μM digoxigenin-11-dUTP (Boehringer Mannheim) for labeling DNA replication sites (nascent DNA), or both for simultaneously labeling transcription and replication sites. After incorporation, the cells were fixed with 3% freshly made paraformaldehyde in PBS on ice for 5 min, washed with ice-cold TBS-Tween buffer (10 mM Tris-HCl, pH 7.4, 150 mM NaCl, 0.2 mM MgCl 2 , 0.2% Tween 20), blocked with 5% goat serum and incubated with rat anti-BrU antibodies (IgG, SeraLab) followed by biotin-conjugated goat anti–rat IgG (1:50; Jackson ImmunoResearch Laboratories, Inc.) and Texas red–conjugated streptavidin (1:100; GIBCO BRL) to detect transcription sites. Replication sites were detected with FITC-conjugated sheep antidigoxigenin Fab fragments (1:10; Boehringer Mannheim). All incubations were performed at room temperature for 30 min. Alternatively, nascent RNA was labeled in vivo, by pulsing 3T3 cells for 2 min with 30 μM BrU (Sigma Chemical Co.). The biotin-strepavidin enhancement system resulted in greatly improved sensitivity for detected individual transcription sites compared with a standard secondary antibody approach and was absolutely essential for detecting transcription sites after 2-min in vivo pulses of BrU. Nuclear speckles were decorated with the Y12 mAb to Sm, which recognizes common core proteins of snRNPs involved in RNA processing ( Lerner et al. 1981 ; Zieve and Sauterer 1990 ), followed by goat anti–mouse IgG (1:20–50; Jackson ImmunoResearch Laboratories, Inc.) conjugated to FITC or Texas red. Coiled bodies and the nuclear lamina were decorated with rabbit polyclonal anticoilin and antilamin B antibodies, respectively, and detected with FITC- or Texas red–conjugated goat anti–rabbit IgG (1:20–50; Jackson ImmunoResearch Laboratories, Inc.). Coverslips were mounted on slides in Slow-Fade (Molecular Probes, Inc.) and stored at −20°C for microscopic examination.
📊 Figures
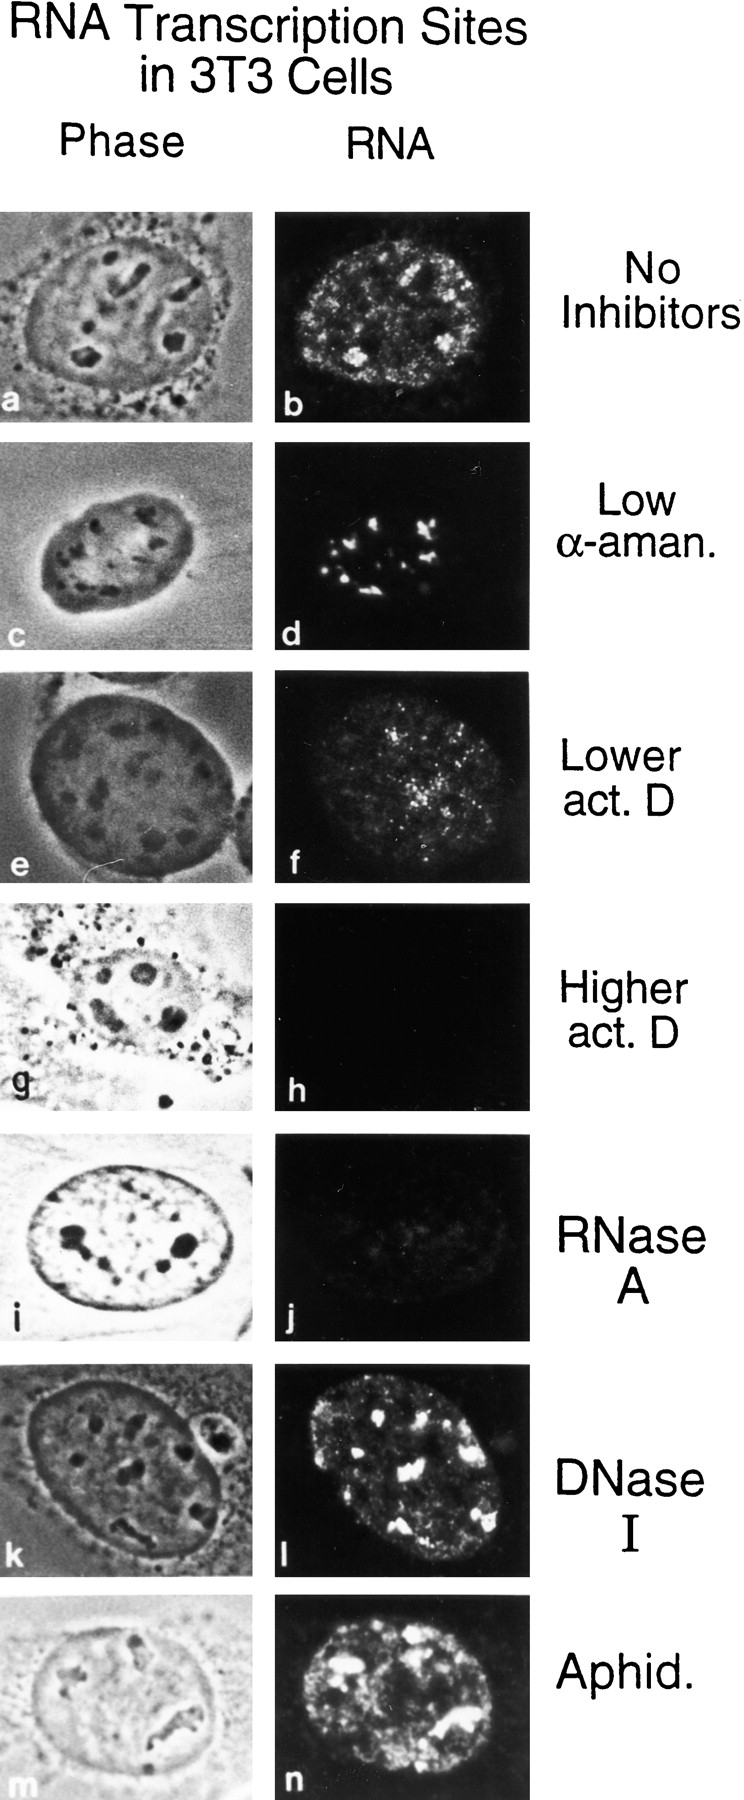
Figure 1
Transcription occurs at discrete sites throughout the cell nucleus. Mouse 3T3 cells were permeabilized with 0.025% Triton X-100, and then incubated with RNA synthesis buffer to label nascent transcrip...
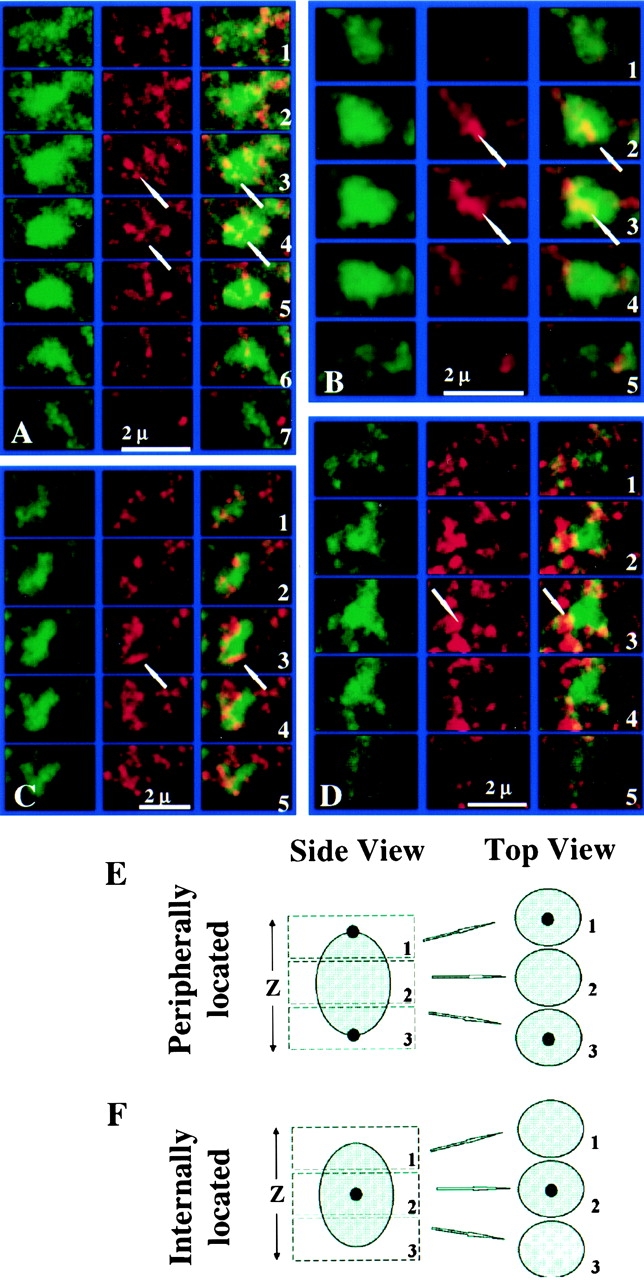
Figure 9
Optical section series through individual nuclear speckles. (A and B) Arrows indicate interior located transcription sites that are present in the middle sections (0.3 u03bcm) of the series, but not i...
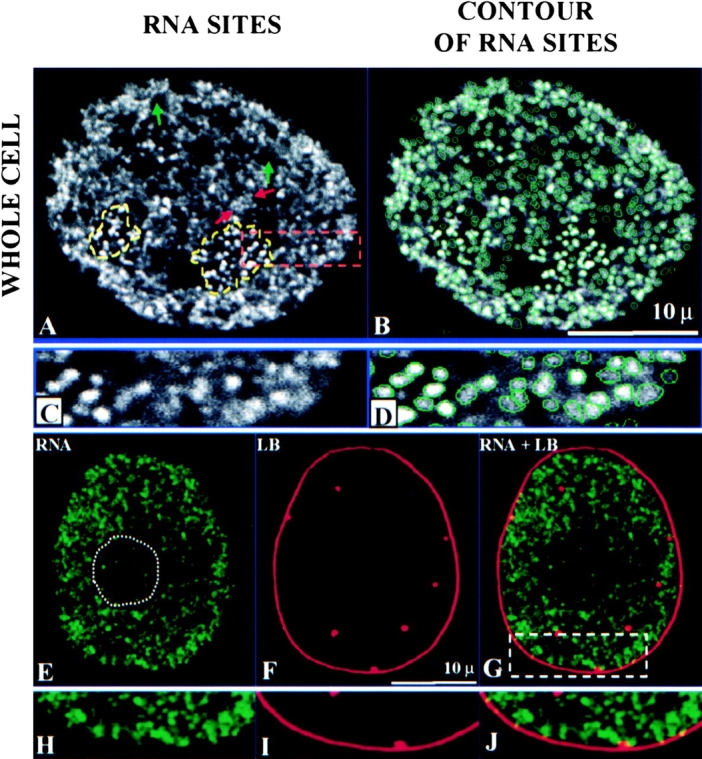
Figure 2
Laser scanning confocal microscopy of transcription sites, their segmentation, and spatial relationship with the nuclear lamina in permeabilized 3T3 cells. (A) Nucleolar transcription sites are encirc...
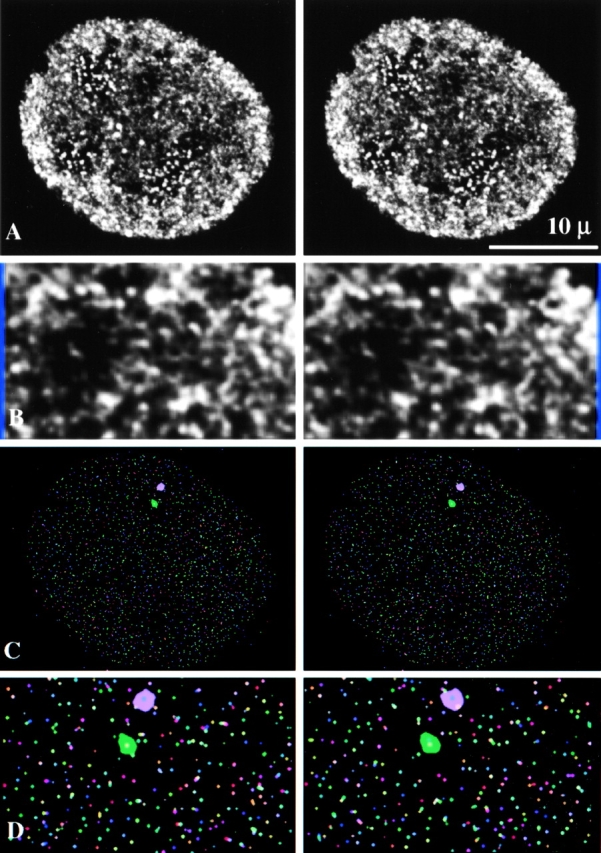
Figure 3
Three-dimensional visualization of transcription sites in permeabilized 3T3 cells. (A) 0.3-u03bcm optical sections were reconstructed to form a three-dimensional image. Transcription sites are cluster...
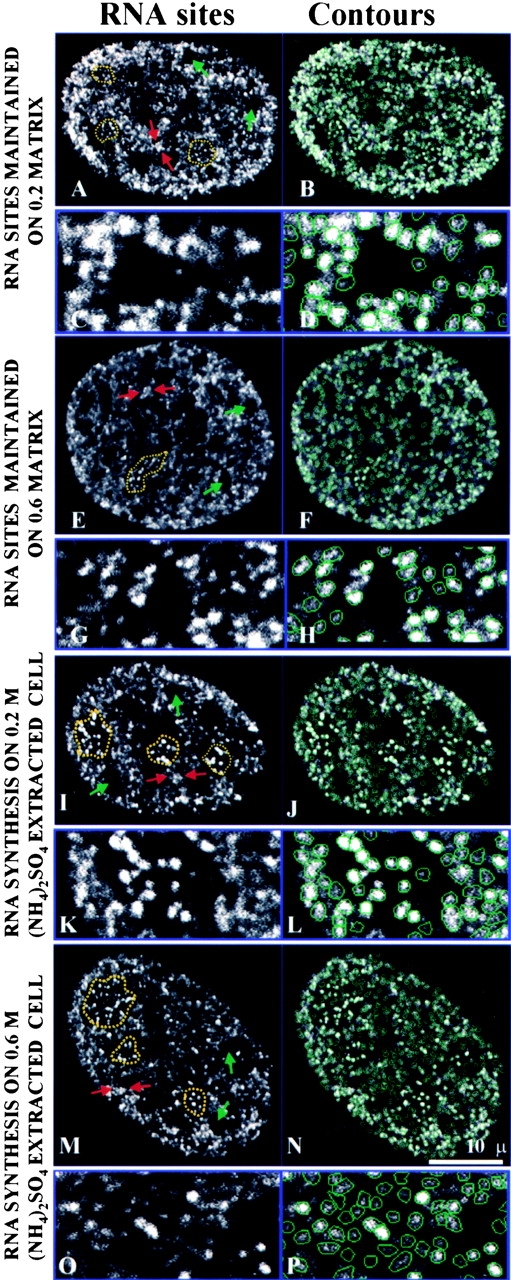
Figure 4
Transcription sites are maintained after preparation for nuclear matrix and the transcription activity is also preserved in salt-extracted 3T3 cells. On the left are the optical midplane images; on th...
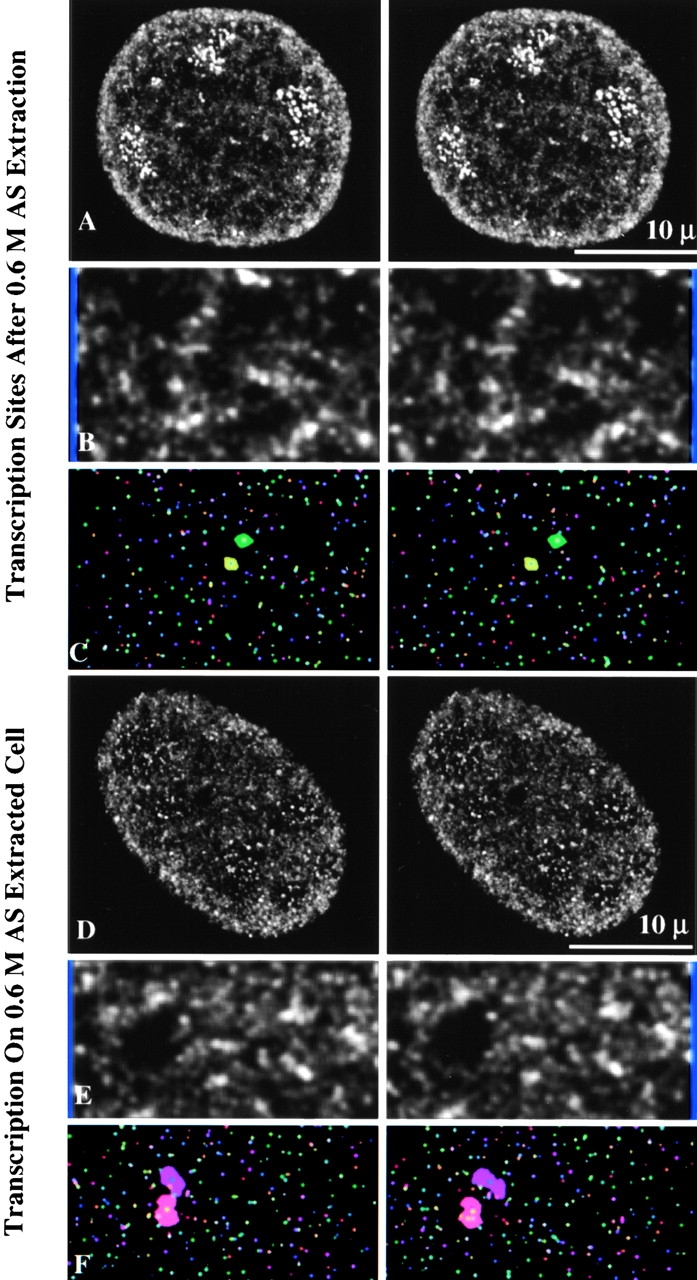
Figure 5
Three-dimensional visualization of transcription sites maintained on nuclear matrix and transcription activity of salt-extracted cells. 0.3-u03bcm optical sections through 3T3 cells were reconstructed...
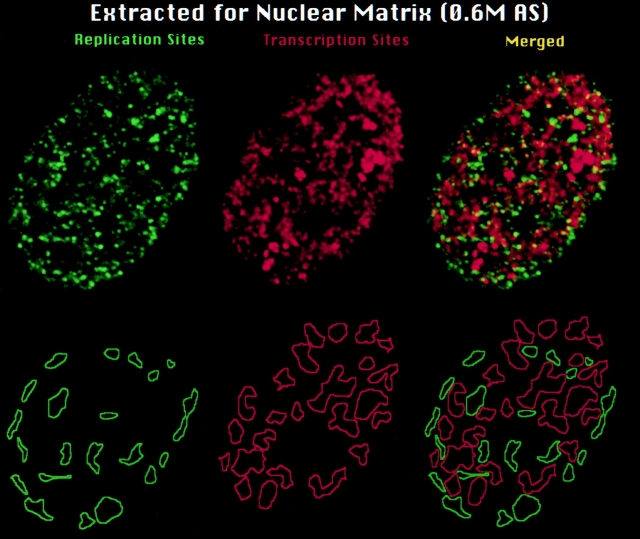
Figure 6
Maintenance of DNA replication and transcription sites and their organization into higher order zones on the nuclear matrix. Replication and transcription sites were simultaneously labeled in permeabi...
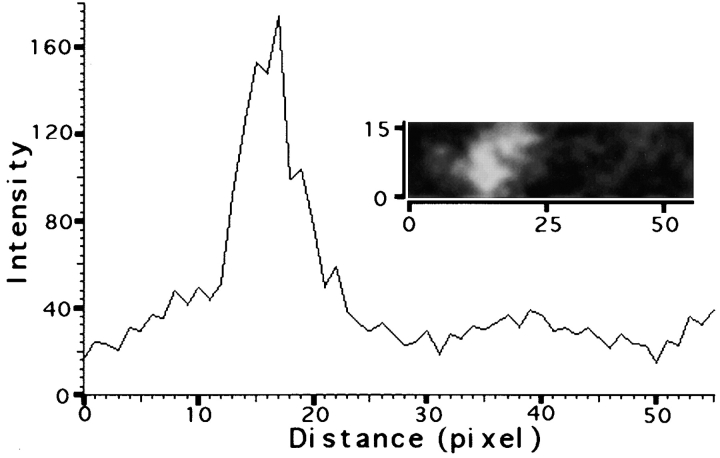
Figure 7
Quantification of snRNP in the nuclear speckle versus other nuclear regions. snRNP was detected with mAb Y12. A typical nuclear speckle and its surroundings were selected (insert) and the fluorescent ...
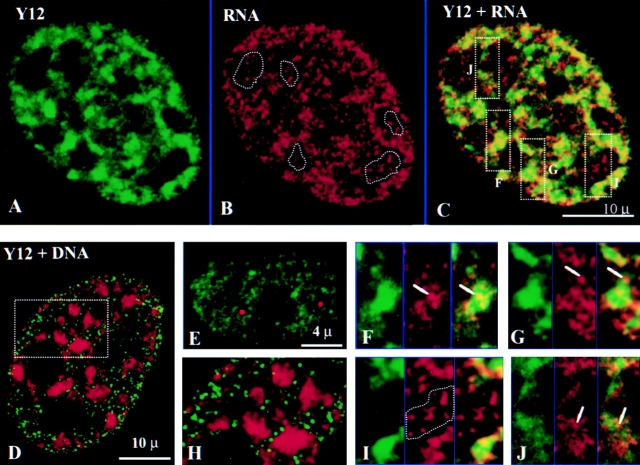
Figure 8
Transcription but not replication sites are associated with nuclear speckles. (A) Y12 decorates regions where splicing factors are concentrated in nuclear speckles and more diffuse nonspeckled regions...
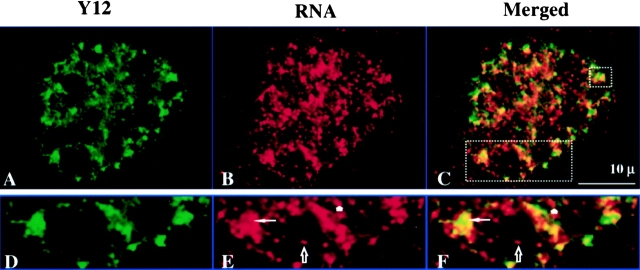
Figure 10
In vivo labeled nascent RNA transcripts are associated with splicing factors. (A) Nuclear speckles are detected with the Y12 antibody (green). (B) Transcription sites are detected by incorporating BrU...
Figure images are served from the NIH/NLM PubMed Central Open Access Subset or Europe PMC; copyright remains with the publishers and authors.
💬 Discussion
0 commentsNo comments yet. Be the first to start a discussion!
Leave a Comment