Abstract
Abstract During translation, a conserved GTPase elongation factor—EF-G in bacteria or eEF2 in eukaryotes—translocates tRNA and mRNA through the ribosome. EF-G has been proposed to act as a flexible motor that propels tRNA and mRNA movement, as a rigid pawl that biases unidirectional translocation resulting from ribosome rearrangements, or by various combinations of motor- and pawl-like mechanisms. Using time-resolved cryo-EM, we visualized GTP-catalyzed translocation without inhibitors, capturing elusive structures of ribosome•EF-G intermediates at near-atomic resolution. Prior to translocation, EF-G binds near peptidyl-tRNA, while the rotated 30S subunit stabilizes the EF-G GTPase center. Reverse 30S rotation releases Pi and translocates peptidyl-tRNA and EF-G by ~20 Å. An additional 4-Å translocation initiates EF-G dissociation from a transient ribosome state with highly swiveled 30S head. The structures visualize how nearly rigid EF-G rectifies inherent and spontaneous ribosomal dynamics into tRNA-mRNA translocation, whereas GTP hydrolysis and Pi release drive EF-G dissociation.
🔬 Techniques
🧬 Organisms
✨ Fluorophores
🏭 Microscope Brands
🧪 Reagent Suppliers
💻 Software Details
💾 Data Repositories
🏛️ Research Organizations (ROR)
Affiliated research institutions:
📋 Methods
Preparation of EF-G and ribosomal subunits
The gene encoding the full-length C-terminally His 6 -tagged E. coli EF-G was cloned into a pET24a+ vector (Novagen, kanamycin resistance), and the plasmid was transformed into E. coli BLR/DE3 cells. The cells were cultured in Luria-Bertani (LB) medium with 50 µg mL −1 kanamycin at 37 °C until the OD 600 of 0.7–0.8. Expression of EF-G was induced by 1 mM IPTG (Gold Biotechnology Inc., USA), followed by cell growth for 9 h at 16 °C. The cells were harvested, washed and resuspended in buffer A: 50 mM Tris•HCl (pH 7.5), 50 mM NH 4 Cl, 10 mM MgCl 2 , 5% glycerol, 10 mM imidazole, 6 mM β-mercaptoethanol (βME) and protease inhibitor (complete Mini, EDTA-free protease inhibitor tablets, Sigma Aldrich, USA). The cells were disrupted with a microfluidizer (Microfluidics, USA), and the soluble fraction was collected by centrifugation using a JA-20 rotor at 39,200 × g for 50 minutes and filtered through a 0.22 μm pore size sterile filter (CELLTREAT Scientific Products, USA). EF-G was purified in three steps. The purity of the protein after each step was assessed by 12% SDS-PAGE stained with Coomassie Brilliant Blue R 250 (Sigma-Aldrich). First, affinity chromatography with Ni-NTA column (Nickel-nitrilotriacetic acid, 5 ml HisTrap, GE Healthcare) was performed using FPLC (Äkta explorer, GE Healthcare) at 4 °C. The cytoplasmic fraction was loaded onto the column equilibrated with buffer A and washed with the same buffer. EF-G was eluted with a linear gradient of buffer B (buffer A with 0.25 M imidazole). Fractions containing EF-G were pooled and dialyzed against buffer C (50 mM Tris•HCl (pH 7.5), 100 mM KCl, 10 mM MgCl 2 , 0.5 mM EDTA, 6 mM βME and protease inhibitor). The second purification step involved ion-exchange chromatography using a 20-ml HiPrep FF Q-column (GE Healthcare). The column was equilibrated and washed with buffer C. EF-G sample was loaded in buffer C and eluted with a linear gradient of buffer D (buffer C with 0.7 M KCl). Finally, the protein was dialyzed against 50 mM Tris•HCl (pH 7.5), 100 mM KCl, 10 mM MgCl 2 , 0.5 mM EDTA, 6 mM βME, and purified using size-exclusion chromatography (Hiload 16/600 Superdex 200 pg column, GE Healthcare). The fractions of the protein were pooled, buffer-exchanged (25 mM Tris•HCl (pH 7.5), 100 mM NH 4 Cl, 10 mM MgCl 2 , 0.5 mM EDTA and 6 mM βME, 5% glycerol) and concentrated with an ultrafiltration unit using a 10-kDa cutoff membrane (Millipore). The concentrated protein was flash-frozen in liquid nitrogen and stored at −80 °C. 70S ribosomes were prepared from E. coli (MRE600), and stored in the ribosome-storage buffer (20 mM Tris•HCl (pH 7.0), 100 mM NH 4 Cl, 12.5 mM MgCl 2 , 0.5 mM EDTA, 6 mM βME) at −80 °C 18 . Ribosomal 30S and 50S subunits were purified using sucrose gradient (10–35%) in a ribosome-dissociation buffer (20 mM Tris•HCl (pH 7.0), 500 mM NH 4 Cl, 1.5 mM MgCl 2 , 0.5 mM EDTA, 6 mM βME). The fractions containing 30S and 50S subunits were collected separately, concentrated and stored in the ribosome-storage buffer at −80 °C.
Show full methods section
Preparation of EF-G and ribosomal subunits
The gene encoding the full-length C-terminally His 6 -tagged E. coli EF-G was cloned into a pET24a+ vector (Novagen, kanamycin resistance), and the plasmid was transformed into E. coli BLR/DE3 cells. The cells were cultured in Luria-Bertani (LB) medium with 50 µg mL −1 kanamycin at 37 °C until the OD 600 of 0.7–0.8. Expression of EF-G was induced by 1 mM IPTG (Gold Biotechnology Inc., USA), followed by cell growth for 9 h at 16 °C. The cells were harvested, washed and resuspended in buffer A: 50 mM Tris•HCl (pH 7.5), 50 mM NH 4 Cl, 10 mM MgCl 2 , 5% glycerol, 10 mM imidazole, 6 mM β-mercaptoethanol (βME) and protease inhibitor (complete Mini, EDTA-free protease inhibitor tablets, Sigma Aldrich, USA). The cells were disrupted with a microfluidizer (Microfluidics, USA), and the soluble fraction was collected by centrifugation using a JA-20 rotor at 39,200 × g for 50 minutes and filtered through a 0.22 μm pore size sterile filter (CELLTREAT Scientific Products, USA). EF-G was purified in three steps. The purity of the protein after each step was assessed by 12% SDS-PAGE stained with Coomassie Brilliant Blue R 250 (Sigma-Aldrich). First, affinity chromatography with Ni-NTA column (Nickel-nitrilotriacetic acid, 5 ml HisTrap, GE Healthcare) was performed using FPLC (Äkta explorer, GE Healthcare) at 4 °C. The cytoplasmic fraction was loaded onto the column equilibrated with buffer A and washed with the same buffer. EF-G was eluted with a linear gradient of buffer B (buffer A with 0.25 M imidazole). Fractions containing EF-G were pooled and dialyzed against buffer C (50 mM Tris•HCl (pH 7.5), 100 mM KCl, 10 mM MgCl 2 , 0.5 mM EDTA, 6 mM βME and protease inhibitor). The second purification step involved ion-exchange chromatography using a 20-ml HiPrep FF Q-column (GE Healthcare). The column was equilibrated and washed with buffer C. EF-G sample was loaded in buffer C and eluted with a linear gradient of buffer D (buffer C with 0.7 M KCl). Finally, the protein was dialyzed against 50 mM Tris•HCl (pH 7.5), 100 mM KCl, 10 mM MgCl 2 , 0.5 mM EDTA, 6 mM βME, and purified using size-exclusion chromatography (Hiload 16/600 Superdex 200 pg column, GE Healthcare). The fractions of the protein were pooled, buffer-exchanged (25 mM Tris•HCl (pH 7.5), 100 mM NH 4 Cl, 10 mM MgCl 2 , 0.5 mM EDTA and 6 mM βME, 5% glycerol) and concentrated with an ultrafiltration unit using a 10-kDa cutoff membrane (Millipore). The concentrated protein was flash-frozen in liquid nitrogen and stored at −80 °C. 70S ribosomes were prepared from E. coli (MRE600), and stored in the ribosome-storage buffer (20 mM Tris•HCl (pH 7.0), 100 mM NH 4 Cl, 12.5 mM MgCl 2 , 0.5 mM EDTA, 6 mM βME) at −80 °C 18 . Ribosomal 30S and 50S subunits were purified using sucrose gradient (10–35%) in a ribosome-dissociation buffer (20 mM Tris•HCl (pH 7.0), 500 mM NH 4 Cl, 1.5 mM MgCl 2 , 0.5 mM EDTA, 6 mM βME). The fractions containing 30S and 50S subunits were collected separately, concentrated and stored in the ribosome-storage buffer at −80 °C.
Preparation of charged tRNAs and mRNA Native
E. coli tRNA fMet was purchased from Chemical Block and was aminoacylated as described (Lancaster and Noller, 2005). Native E. coli tRNA Pro (UGG) was over-expressed in E. coli from an IPTG-inducible proM gene encoded by the pKK223-3 plasmid. Total tRNA was isolated using differential centrifugation and tRNA Pro (UGG) was isolated using a complementary biotinylated oligonucleotide attached to streptavidin-sepharose, yielding approximately 40 nmoles tRNA Pro (UGG) from 1 liter of culture. tRNA Pro (UGG) (10 µM) was aminoacylated in the charging buffer (50 mM Hepes (pH 7.5), 50 mM KCl, 10 mM MgCl 2 , 10 mM DTT) in the presence of 40 µM L-proline, 2 µM prolyl-tRNA synthetase, 0.625 mM ATP and 15 µM elongation factor EF-Tu. EF-Tu was purified as described 47 . The mixture was incubated for 10 minutes at 37 °C. To stabilize the charged Pro-tRNA Pro in the form of Pro-tRNA Pro •EF-Tu•GTP ternary complex, 0.25 mM GTP was added to the mixture. The mixture was incubated for 3 minutes at 37 °C. Model mRNA, containing the Shine-Dalgarno sequence and a linker to place the AUG start codon (underlined) in the P site and proline (bolded) in the A site (GGC AAG GAG GUA AAA AUG CCA AGU UCU AAA AAA AAA AAA) was synthesized by IDT. Preparation of the 70S translocation complex with EF-G•GTP The 70S•mRNA•fMet-tRNA fMet •Pro-tRNA Pro •EF-G•GTP reactions were prepared as follows. First, a pre-translocation complex with fMet-Pro-tRNA Pro in the A site was assembled. 0.33 µM 30S subunit (all concentrations are specified for the final solution) were pre-activated at 42 °C for 5 minutes in the ribosome-reconstitution buffer (20 mM HEPES (pH 7.5), 120 mM NH 4 Cl, 20 mM MgCl 2 , 2 mM spermidine, 0.05 mM spermine, 6 mM βME). 0.33 µM 50S subunit with 1.33 µM mRNA were added to the 30S solution and incubated for 10 minutes at 37 °C. To form the 70S initiation-like complex, 0.33 µM fMet-tRNA fMet was added, and the solution was incubated for 3 minutes at 37 °C. To deliver Pro-tRNA Pro to the A site, the pre-incubated ternary complex (Pro-tRNA Pro at 0.33 µM; EF-Tu at 0.5 µM; GTP at 0.25 mM) was added to the solution and incubated for 10 minutes at 37 °C, as described 18 . Translocation complexes with EF-G were formed by addition of the mixture of ice-cooled 5.3 µM EF-G and 0.66 mM GTP to the ice-cooled pre-translocation complex, on ice. No EF-G and GTP were added to the 0-s time point reaction, which was applied to a grid and blotted as described below. The 10-µL reaction with EF-G was mixed and an aliquot was immediately applied on the grid, blotted and plunged into a cryogen, as described below, resulting in the 25-s time-point sample. The 3600-s sample was obtained by incubation of the pre-translocation complex with EF-G and GTP for 60 minutes on ice followed by grid blotting and plunging. To form a viomycin-bound pre-translocation complex (Structure III-vio), 0.13 mM viomycin was added to the pre-translocation complex and incubated for 3 minutes at 37 °C. 5.3 µM EF-G and 0.66 mM GTP were added to the solution, incubated for 5 minutes at 37 °C, cooled down to room temperature, applied to a grid and plunged into a cryogen. Cryo-EM grid preparation, data collection, and image processing QUANTIFOIL R 2/1 grids with 2-nm carbon layer (Cu 200, Quantifoil Micro Tools) were glow discharged with 25 mA with negative polarity for 60 s in a PELCO easiGlow glow discharge unit. 2.5 μl of each complex was separately applied to the grids. Grids were blotted at blotting force 10 for 4 s at 5 °C, 95% humidity, and plunged into liquid ethane using a Vitrobot MK4 (FEI). Grids were stored in liquid nitrogen. 25-s dataset — Data collection and processing of all datasets were performed similarly to those for the 25-s data set (Supplementary Fig. 1 and Table 1 ), with differences outlined below. Cryo-EM data were collected at the Cryo-EM Center, University of Massachusetts Medical School. From a grid with the 70S•mRNA•fMet-tRNA fMet •Pro-tRNA Pro complex that was cryogen-plunged 25 s after mixing with EF-G•GTP, 4,943 movies were collected on a Titan Krios microscope operating at 300 kV (FEI/ThermoFisher) equipped with a K3 Summit camera system (Gatan), with the defocus range of −0.8 to −2.0 μm. Multi-shot multi-hole data acquisition was performed by recording four shots per grid hole from four holes at a time 78 , using SerialEM (vs. 3.6) 79 with beam-image shift. Each exposure was acquired with continuous frame streaming at 33 frames per 1.977 s yielding a total dose of 47.58 e - /Å 2 . The dose rate was 16.54 e - /pixel/s at the camera. The nominal magnification was 105,000 and the calibrated super-resolution pixel size at the specimen level was 0.415 Å. The movies were motion-corrected, and frame averages were calculated using all frames within each movie, after multiplying by the corresponding gain reference in IMOD (vs. 4.9.0) 80 . During motion correction, the movies were binned to the pixel size of 0.83 Å (termed unbinned or 1× binned). cisTEM (vs. 1.0-beta) 81 was used to determine defocus values for each frame average and to pick ribosome particles. 238 movies with large drift, low signal, heavy ice contamination, or very thin ice were excluded from further analysis after inspection of the averages and the power spectra computed by CTFFIND4 within cisTEM. The stack of 475,746 particles and particle parameter files were assembled in cisTEM with the binnings of 1×, 2×, 4×, and 8× and the box size of 448 unbinned pixel 3 . FREALIGNX was used for particle alignment, refinement and final reconstruction steps. FREALIGN v9.11 was used for 3D classification steps 82 , as shown in Supplementary Fig. 1 . The 8x-binned image stack was initially aligned to a 70S ribosome reference (PDB 5U9F) 83 using 5 cycles of mode 3 alignment (global search), including data in the resolution range of 300–30 Å until the convergence of the average score. Subsequently, the 8× binned stack was aligned against the common reference resulting from the previous step, using mode 1 (refine) in the resolution range 300–18 Å (3 cycles of mode 1). The 2× binned image stack was then aligned against the common reference using mode 1 (refine) in several steps, in which the high-resolution limits gradually increased to 8 Å (5 cycles per each resolution limit). 3D density reconstruction was obtained using 60% particles with the highest scores. Subsequently, the refined particle parameters were used for classification of the 2× binned stack into 16 classes in 100 cycles, using the resolution range of 300–8 Å. This classification revealed 9 high-resolution classes, 4 low-resolution (junk) classes, and 3 classes representing only 50S subunit (Supplementary Fig. 1a ). The particles assigned to the high-resolution classes were extracted from the 2× binned stack (with > 50% occupancy and > 0 score) using merge_classes.exe (part of FREALIGN distribution), resulting in the stack of 262,085 particles. Classification of this stack was performed for 100 cycles using a spherical mask (40 Å radius) focused to cover most of the ribosomal A and P sites. Classification into 16 classes yielded two 70S maps, each of which contained densities for two tRNAs and EF-G. To better resolve the positions of tRNAs and EF-G, these maps were subject to additional classification. To this end, the particles assigned to these two classes were extracted from the 2× binned stack into two sub-stacks (with > 50% occupancy and scores > 0) using merge_classes.exe, resulting in stack-1 and stack-2 with 7173, and 12,327 particles, respectively. Prior to classification, stack-1 was re-refined, as described above, using the high-resolution cutoff of 6 Å. Classification was performed for 100 cycles, using the same A site focused mask. Classification yielded into 2 classes yielded a 3.3 Å class (Structure IV) which contained both tRNAs and EF-G, and a class containing a rotated ribosome with P/E tRNA. An additional classification of stack-1 using a separate masking strategy was performed (Supplementary Fig. 1b ). Classification of stack-1 was performed for 100 cycles, using a focused spherical mask with the radius of 35 Å, covering the GTPase domain of EF-G. Classification into 2 classes yielded a 3.3 Å class (Structure IV gtpase ) which contained both tRNAs and EF-G, and a heterogenous class requiring further classification. Subsequent classification of the second class into 2 classes using a focused mask of 30 Å around the 50S E site produced a 3.9 Å class with two tRNAs and EF-G (Structure V), and a heterogenous class requiring additional classification. A final classification of the heterogenous class for 100 cycles with a 35-Å spherical focused mask around the translocase domain of EF-G produced a 3.8 Å class that contained the 70S ribosome with a swiveled head, two tRNAs, and no EF-G (Structure VI). Stack-2 exhibited heterogeneity at the EF-G binding site and 30S domain conformation, so it was first classified into 2 classes for 100 cycles, using a 3D mask covering the shoulder domain, filtered to 30 Å and down-weighted to 0.1. The class containing EF-G was used to create a substack of 5,379 particles (stack-2a) which was subjected to a 100-cycle classification into 3 classes using the original 40 Å A site mask. This classification produced a 3.8 Å class of 1,657 particles containing a pre-translocation 70S•2tRNA•EFG state (Structure III). An additional classification of stack-2a using a separate masking strategy was performed (Supplementary Fig. 1c ). Classification of stack-2a was performed for 100 cycles, using a focused spherical mask with the radius of 35 Å, covering the GTPase domain of EF-G. Classification into 3 classes yielded a 3.7 Å class of 1,884 particles containing a pre-translocation 70S•2tRNA•EFG state (Structure III gtpase ). 0-s dataset — Data collection and processing for the 0-s time point pre-translocation 70S•mRNA•fMet-tRNA fMet •Pro-tRNA Pro complex were performed as follows. Two data sets containing 1,161 and 4,217 movies were collected with nearly identical parameters on the Titan Krios microscope described above, with the −0.5 to −1.5 μm defocus range. Multi-shot multi-hole data acquisition was performed using SerialEM as described above. Each exposure was acquired with continuous frame streaming at 25 frames per ~1 s yielding a total dose of ~40 e - /Å 2 (Supplementary Table 1 ). The movies were motion-corrected and frame averages were calculated using all frames in IMOD. The nominal magnification was 105,000 and the calibrated super-resolution pixel size at the specimen level was 0.415 Å. During motion-correction, the movies were binned to the pixel size of 0.83 Å (termed unbinned or 1× binned). The initial alignment, refinement and 3D classification of both stacks of 137,421 (stack-1) and 686,850 (stack-2) particles into 16 classes for 100 cycles was performed, as described for the 25-s dataset above, with the exception of an ab initio model generated from 50% of the particles of stack-1 was used for initial alignment. After excluding the low-resolution (junk) classes and classes representing the 50S subunit, the extracted particles were combined into 2×-binned substack-1 (91,638 particles) and substack-2 (346,334 particles, respectively) and classified into 16 classes using a 40-Å focused spherical mask placed between the A and P sites (as in the 25-s data set) to resolve the pre-translocation classes. Seven classes from substack-1 containing non-rotated pre-translocation ribosomes were combined (37,252 particles) and refined resulting in Structure I. 5 classes of rotated ribosomes from substack-1 and 2 classes of rotated ribosomes from substack-2 were combined into a new stack of 122,977 particles (stack-3). Initial alignment and refinement were repeated on stack-3. 2x-binned stack-3 was classified into 24 classes using the same A site 40-Å focused spherical mask. Singles classes of 7,257 and 6,895 particles containing rotated pre-translocation ribosomes with P/E tRNA and either A/A or A/P* tRNA were separated and refined resulting in Structures II-A and II-B, respectively. 6 classes from stack-3 which contained A-site density were combined into a substack of 22,731 to be further inspected for the anticipated A/P and P/E tRNA state. Several masking strategies could not isolate this state and we suspect it exists in very low abundance due to the unique tRNA dynamics of tRNA Pro . 3600-s dataset —2574 movies were collected for the 3600-s 70S•mRNA•fMet-tRNA fMet •Pro-tRNA Pro •EF-G•GTP complex on a Talos Arctica microscope operating at 200 kV (FEI), equipped with a K3 Summit camera system (Gatan), with the defocus range of −0.5 to −1.5 μm. Multi-shot data collection was performed by recording shots from four holes at a time, using SerialEM, as described above. Each exposure was acquired with continuous frame streaming at 27 frames per 1.13 s, yielding a total dose of 30.4 e - /Å 2 . The dose rate was 16.48 e - /pixel/s at the camera. The movies were motion-corrected and frame averages were calculated using all frames within each movie after multiplying by the corresponding gain reference in IMOD. The nominal magnification for the dataset was 45,000 and the calibrated super-resolution pixel size at the specimen level was 0.435 Å. During motion correction, the movies were binned to the pixel size of 0.87 Å. The initial alignment, refinement and 3D classification of the original 170,799-particle stack into 16 classes were performed as described for the 25-s dataset. After excluding the low-resolution classes and classes representing the 50S subunit, the extracted particles were combined into a 2x-binned substack (132,070 particles) and classified into 16 classes using a 40-Å focused spherical mask positioned between the A and P sites, as in the 0- and 25-s data sets. Post-translocation states were combined into a single stack of 55,457 particles and refined using a 6 Å resolution cutoff, resulting in the 2.9 Å map (Structure VII). We had sufficient resolution to identify the P-site codon. Particles were assigned as substrate (70S containing A-site Pro-tRNA Pro ), EF-G bound intermediate, and product (70S containing P-site Pro-tRNA Pro ) in our quantification of all data sets. Dataset for the viomycin-bound complex For the viomycin-bound 70S•mRNA•fMet-tRNA fMet •Pro-tRNA Pro •EF-G•GTP pre-translocation complex, a dataset of 4,740 movies was collected on a Talos Arctica microscope operating at 200 kV (FEI) equipped with a K3 Summit camera system (Gatan), with the defocus range of −0.5 to −1.5 μm. Multi-shot data collection was performed by recording shots from four holes at a time, using SerialEM, as described above. Each exposure was acquired with continuous frame streaming at 27 frames per 1.618 s yielding a total dose of 30.48 e - /Å 2 . The dose rate was 14.30 e - /pixel/s at the camera. The nominal magnification was 45,000 and the calibrated super-resolution pixel size at the specimen level was 0.435 Å. The movies were motion-corrected and frame averages were calculated using all frames within each movie after multiplying by the corresponding gain reference in IMOD. During motion correction in IMOD the movies were binned to pixel size 0.87 Å (termed unbinned or 1× binned). cisTEM was used to determine defocus values for each frame average and for particle picking. 114 movies with large drift, low signal, heavy ice contamination, or very thin ice were excluded from further analysis after inspection of the averages and the power spectra computed by CTFFIND4 within cisTEM. The stack of 517,847 particles and the particle parameter files were assembled in cisTEM with the binnings of 1×, 2×, 4×, and 8× and the box size of 448 unbinned pixel. Particle alignment and refinement against the the 8×-binned and 2×-binned stacks were performed as described for the 25-s dataset. The 2× binned stack was classified into 16 classes in 50 cycles, using the resolution range of 300–8 Å. This classification revealed 9 high-resolution classes, 5 low-resolution (junk) classes and 2 classes representing the 50S subunit (Supplementary Fig. 2 ). Particles assigned to the high-resolution classes were extracted from the 2× binned stack (with > 50% occupancy and scores > 0) using merge_classes.exe (part of the FREALIGN distribution), and merged into a stack containing 322,549 particles. Classification of this stack was performed for 50 cycles using a focused spherical mask with the 30-Å radius, covering most of the A and P sites. Classification into 16 classes yielded 3 high-resolution classes, each of which contained two tRNAs and EF-G. The particles assigned to the 3 high-resolution classes were extracted from the 2× binned stack (with > 50% occupancy and scores > 0) using merge_classes.exe (part of the FREALIGN distribution), and merged into a stack containing 48,345 particles. Classification of this stack was performed for 50 cycles using a focused spherical mask at the A site (30 Å radius, as implemented in FREALIGN). Classification into 3 classes yielded a single high-resolution class, which contained two tRNAs and EF-G. Additional classification of each class into more classes did not yield other unique high-resolution structures with EF-G. For the class of interest (Structure III-vio, 20,167 particles), particles with > 50% occupancy and scores > 0 were extracted from the 2× binned stack. Refinement to 6 Å resolution using mode 1 (5 cycles) of the 1× binned stack using 95% of particles with highest scores resulted in a 3.4 Å map (FSC = 0.143). Beamtilt correction to the Nyquist limit (beamtilt(x,y)mrad = −0.0198 −0.0290; particle shift x,y (A) = 0.0849, 0.1189) has further improved map quality, yielding a 3.2 Å map (FSC = 0.143).
Map filtering and resolution
Local-resolution filtering was applied to the resulting cryo-EM maps by a previously optimized procedure 36 , using blocres and blocfilt from the Bsoft (vs. 1.9.1) package 84 , followed by sharpening the blocfiltered maps with bfactor.exe using a constant B-factor of −50 Å 2 to the average resolution determined by FSC_part. These maps were used for model building and structure refinements. Maps sharpened or softened with different B-factors (from −125 to +50 Å 2 ) were also used to interpret high-resolution details or lower-resolution features. FSC curves were calculated by FREALIGN for even and odd particle half-sets (Supplementary Figs. 1 – 2 ).
Model building and refinement
Cryo-EM structure of E. coli 70S•fMet-tRNA Met •Phe-tRNA Phe •EF-Tu•GDPCP Structure III 47 , excluding EF-Tu and tRNAs, was used as a starting model for structure refinements. The structures of EF-G were created by homology modeling and map fitting, using ribosome-bound EF-G structures including PDB 4V7D (Brilot et al. 2013, PNAS), PDB 7K51, PDB 4V9H, PDB 4W29 13 and the crystal structure of EF-G-2 (PDB 1WDT) as references. Initial protein and ribosome domain fitting into cryo-EM maps was performed using Chimera 85 , followed by manual modeling using Pymol (vs. 1.7.x) 86 . The linkers between the domains and parts of the domains that were not well defined in the cryo-EM maps (e.g. ribosomal proteins or loops of EF-G) were not modeled. Atomic models were refined against corresponding cryo-EM maps by real-space simulated-annealing refinement using atomic electron scattering factors in RSRef (2000) 87 . Secondary-structure restraints, comprising hydrogen-bonding restraints for ribosomal proteins and base-pairing restraints for RNA molecules, were employed as described 88 . Refinement parameters, such as the relative weighting of stereochemical restraints and experimental energy term, were optimized to produce stereochemically optimal models that closely agree with the corresponding maps. In the final stage, the structures were refined using phenix.real_space_refine (vs. 1.14_3260) 89 , followed by a round of refinement in RSRef applying harmonic restraints to preserve protein backbone geometry while improving RNA geometry, and lastly by atomic B-factor refinement in phenix.real_space_refine. The refined structural models closely agree with the corresponding maps, as indicated by low real-space R-factors of ~0.25 and Correlation Coefficients of ~0.75 (Supplementary Table 1 ) and visual inspection of the models and maps. The resulting models have excellent stereochemical parameters as indicated by the low MolProbity scores of ~2, low deviations from ideal bond lengths and angles, low number of protein and RNA outliers and other structure-quality statistics (Supplementary Table 1 ). Structure quality was validated using MolProbity. Structure superpositions and distance calculations were performed in Pymol. To calculate an angle of the 30S body or head rotation with respect to Structure VII, 23S rRNA (body rotation) or the 16S rRNA excluding the head domain (i.e. residues 2–920 and 1398–1540; head rotation) were aligned with the corresponding rRNA from Structure VII using PyMOL, and the angles between 16S body or head regions were measured in Chimera (vs. 1.13). Figures were prepared in PyMOL, GraphPad Prism 8, and Chimera 85 , 86 . Buried surface area (contact area) for EF-G domains was calculated in Pymol using the refined EF-G structures (III, IV, and V) with generated hydrogen atoms in the presence and absence of the ribosome components.
Assessment of GTP and GDP•Pi models fit into cryo-EM maps
To differentiate between the stages of GTP hydrolysis in the EF-G GTPase center, we quantitatively assessed the local fit of the alternative structural models (pre-hydrolysis GTP or post-hydrolysis GDP•Pi) into density maps for pre-translocation states in this work (III and III-vio) and in the recent study that captured ribosome•EF-G with spectinomycin and reported a structural model with GTP 65 . The cryo-EM map from the latter study has a visually better fit for the γ-phosphate separated from the β-phosphate (Supplementary Figs. 6 l–n), and the structural model for GTP contained stereochemical outliers indicating overfitting (e.g. RMS deviation from ideal bond lengths of ~0.03 Å and RMS deviation from ideal bond angles of ~6°; Supplementary Table 3 ). To this end, the original nucleotide models were used as starting models. In addition, high-resolution reference models of GTP and GDP•Pi from a 1.5 Å crystal structure of aIF2 (PDB 4RD1; termed aIF2 nucleotide) were fit into the maps by aligning the GTPase domain of aIF2 onto EF-G GTPase. B-factors were set to a uniform value (80) for all structural models prior to refinement. The corresponding maps were carved around the modeled nucleotide using phenix.map_box_1.14-3260. The nucleotides were refined using phenix.real_space_refine at an optimal weight resulting in a good fit of the nucleotide/Pi into the map and good stereochemical parameters, as reported in Supplementary Table 3 . With all three maps and different starting models, GDP•Pi structural models produced a superior fit over GTP. Reporting summary Further information on research design is available in the Nature Research Reporting Summary linked to this article.
Supplementary information Supplementary Information Peer Review File Description of Additional Supplementary Files Supplementary Movie 1 Reporting Summary
📊 Figures
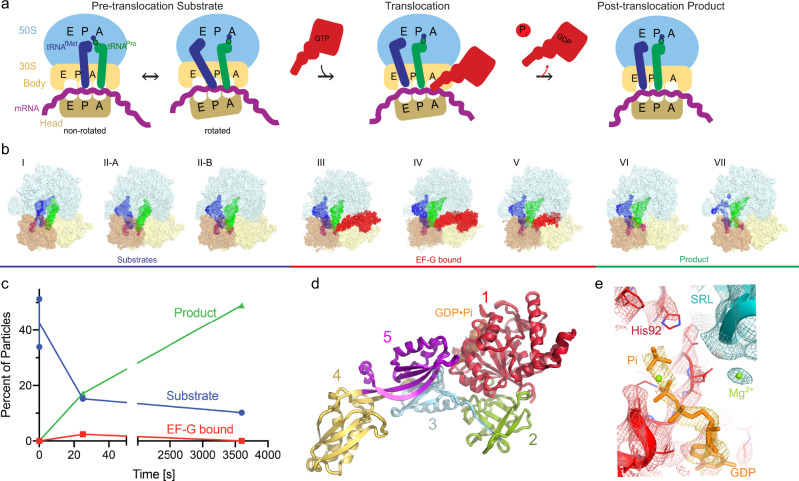
Fig. 1
Time-resolved cryo-EM of translocation with EF-G and GTP.
a Scheme of the translocation reaction of the 70Su2022mRNAu2022fMet-tRNA fMet u2022Pro-tRNA Pro complex with EF-Gu2022GTP. b Segmented cryo-EM maps of 8 states of the translocation reaction, and their...
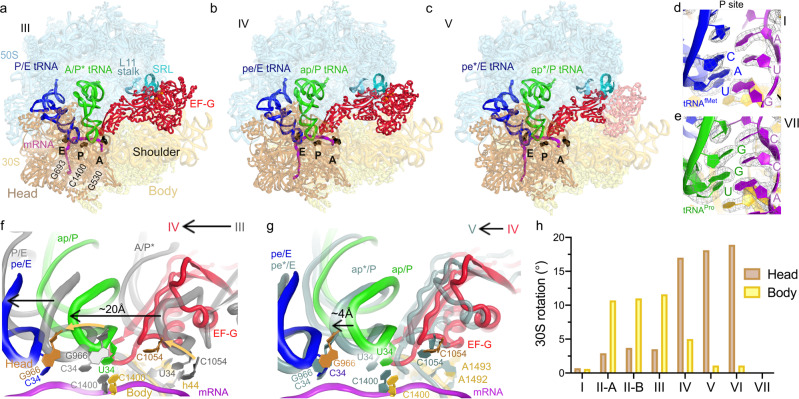
Fig. 2
Structures of translocation intermediates with EF-G.
a u2013 c Structures III, IV and V with EF-G. 16S nucleotides at the A, P, and E sites (G530, C1400 and G693, respectively) are shown as black surfaces for reference. Unresolved part of EF-G in Struct...
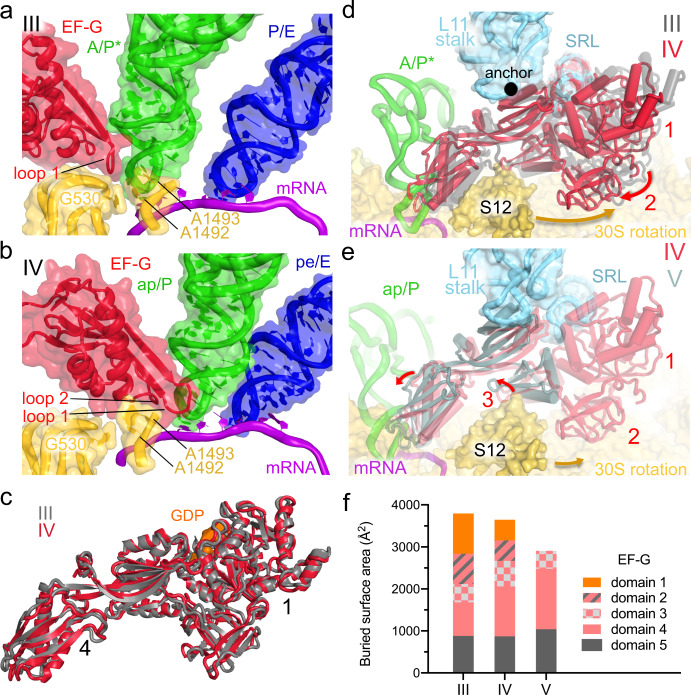
Fig. 3
Positions and interactions of EF-G in translocation intermediates.
a u2013 b Positions of EF-G and tRNAs relative to the decoding center (yellow) in Structures III and IV. c Superposition of EF-G in Structures III and IV demonstrates an overall similar extended confo...
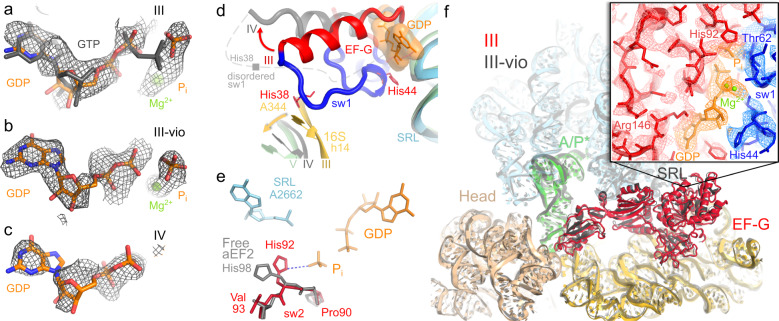
Fig. 4
The GTPase center of EF-G in translocation Structures III, III-vio and IV.
a u2013 c Cryo-EM densities are consistent with GDPu2022Pi in Structures III and III-vio, and with GDP in Structure IV. Grey model shows GTP for reference (1WDT). d Positions of sw-I in Structure III ...
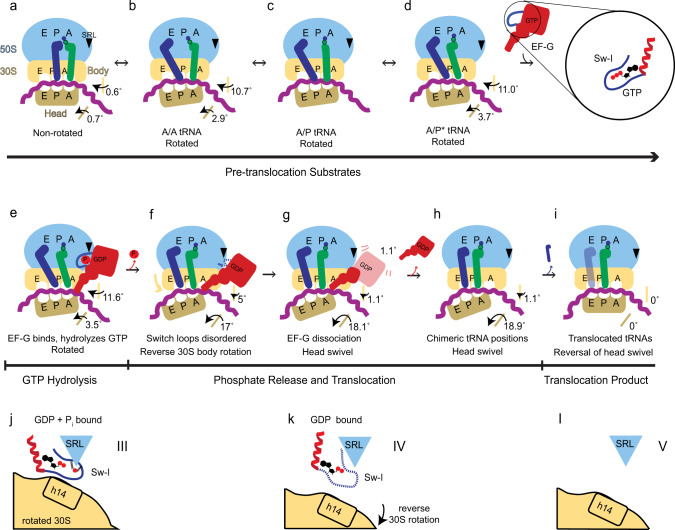
Fig. 5
Schematic of ribosomal translocation catalyzed by EF-G and GTP.
a u2013 i Progression of translocation and rearrangements of ribosomal subunits, EF-G and tRNAs. j u2013 l Rearrangement of EF-G GTPase switch loop I, showing the coupling of Pi release with 30S rotat...
Figure images are served from the NIH/NLM PubMed Central Open Access Subset or Europe PMC; copyright remains with the publishers and authors.
💬 Discussion
0 commentsNo comments yet. Be the first to start a discussion!
Leave a Comment