Abstract
The bacterium MNU16 was isolated from contaminated soils of coal mine and subsequently screened for different plant growth promoting (PGP) activities. The isolate was further identified by 16S rRNA sequencing as Bacillus subtilis MNU16 with IAA concentration (56.95 ± 0.43 6μg/ml), siderophore unit (9.73 ± 2.05%), phosphate solubilization (285.13 ± 1.05 μg/ml) and ACC deaminase activity (116.79 ± 0.019 μmoles α-ketobutyrate/mg/24 h). Further, to evaluate the metal resistance profile of bacterium, the isolate was screened for multi-metal resistance (viz. 900 mg/L for Cr, 600 mg/L for As, 700 mg/L for Ni and 300 mg/L for Hg). Additionally, the resistance pattern of B. subtilis MNU16 against Cr(VI) (from 50 to 300 mg/L) treatments were evaluated. An enriched population was observed at 0-200 mg/L Cr(VI) concentration while slight reductions were observed at 250 and 300 mg/L Cr(VI). Further, the chromium reduction ability at 50 mg/L of Cr(VI) highlighted that the bacterium B. subtilis MNU16 reduced 75% of Cr(VI) to 13.23 mg/L within 72 h. The localization of electron dense precipitates was observed in the TEM images of B. subtilis MNU16 which is might be due to the reduction of Cr(VI) to Cr(III). The data of fluorescence microscopy and flow cytometry with respect to Cr(VI) treatments (50-300 mg/L) showed a similar pattern and clearly revealed the less toxic effect of hexavalent chromium upto 200 mg/L Cr(VI) concentration. However, toxicity effects were more pronounced at 300 mg/L Cr(VI). Therefore, the present study suggests that the plant growth promoting potential and resistance efficacy of B. subtilis MNU16 will go a long way in developing an effective bioremediation approach for Cr(VI) contaminated soils.
🔬 Techniques
💻 Software
🧪 Sample Preparation
🏭 Microscope Brands
🧪 Reagent Suppliers
💻 Software Details
🏛️ Research Organizations (ROR)
Affiliated research institutions:
📋 Methods
Isolation and Characterization of Bacteria for PGP Traits
Samples were collected in triplicates from the degraded soils of coal mining site of Uttar Pradesh. Nutrient agar medium was used to isolate bacterial colonies by serial dilution technique and plates were observed after 24 h of incubation. Colonies were further purified by streak plate and preserved at 4°C for further experiments. Plant growth promoting characteristics of isolates were further identified by the standard procedure discussed below. The bacterial isolates were screened for indole-3-acetic acid (IAA) production using L-tryptophan and quantified colorimetrically by Salkowski method ( Loper and Scroth, 1986 ). The production of siderophore was initially screened on Chrome Azurol S (CAS) agar medium ( Schwyn and Neilands, 1987 ) and further estimated quantitatively by CAS shuttle assay as per described by Payne (1994) . An equal volume of culture supernatant was mixed with CAS reagent and absorbance was measured at 630 nm against the reference containing equal volume of uninoculated medium and CAS reagent. Percentage siderophore produced was calculated by using the formula: % siderophore units = ( Ar-As/Ar ) × 100 Where Ar = absorbance of the reference and As = absorbance of the sample. Bacterial isolates were further screened for phosphate solubilizing potential first qualitatively by growing isolates on Pikovskaya’s medium, and isolates showing clear zone were selected as potential phosphate solubilizer ( Premono et al., 1996 ). Bacterial isolates that have the highest solublization index were selected for the quantitative analysis done by using Pikovaskaya Broth and estimated spectrophotometrically using chlorostannous-reduced-molybdo-phosphoric acid method ( Yadav and Verma, 2012 ). The ACC deaminase activity of the isolates was further determined by the method of Saleh and Glick (2001) . The concentration of α- ketobutyrate produced by the action of ACC deaminase was determined spectrophotometrically and calculated with the help of standard curve. The amount of α- ketobutyrate produced is expressed as μ moles α-ketobutyrate/mg/24 h. Molecular Characterization of Potential Isolate The genomic DNA was isolated from the bacteria by enzymatic method using phenol/chloroform ( Maniatis et al., 1982 ). The DNA isolated was resuspended in TE buffer (pH 8.0) and amplified by PCR to obtain the 16S rRNA sequences. Universal primers, 8F (5′-AGAGTTTGATCCTGGCTCAG-3′) and 1492R (5′-AAGGAGGTGATCCAGCCGCA-3′) were used for DNA amplification. The PCR product was purified using QIAquick PCR Purification Kit (Qiagen). Purified PCR fragments were directly sequenced with Applied Biosystems, 3500XL Genetics Analyzer using the manufacturer’s instructions. Chromas Lite 2.0 software was used to read the sequences and the sequences were then aligned with the previous sequences available in the GenBank database by BLAST tool. A phylogenetic tree was created by the use of multiple sequence alignment tool, ClustalW and MEGA 6.06 software. Screening of Bacterial Isolates for Chromium(VI) Resistance The selected bacterium was further screened for its resistance to chromium (Cr VI) by agar well diffusion method ( Hassen et al., 1998 ). In addition the bacterium was also screened for resistance to various metals including Iron (Fe), Copper (Cu), Arsenic (As), Mercury (Hg), Cadmium (Cd) and Nickel (Ni). Various concentrations of metals were prepared by using their salts as: K 2 Cr 2 O 7 for Cr(VI), NaAsO 2 for As, HgCl 2 for Hg, CdCl 2 for Cd, FeCl 3 for Fe and Ni(NO 3 ) 2 for Ni in distilled water and sterilized by autoclaving. Sterile MHA plates were prepared and spreaded with the overnight grown bacterial culture. After this, approximate 7 mm diameter wells were punched with a sterile borer and filled with metals (100 μl) with various concentrations to determine the value of MIC. The plates were then incubated at 30°C for 24–48 h and zones around the wells were measured. Metal concentration which gave a clear zone of 1 mm or less than 1 mm was considered as the MIC and the bacterium resistant for that particular concentration ( Rani et al., 2010 ). Screening of Isolate for Cr (VI) Reduction The ability of bacterial isolate to reduce Cr(VI) into less toxic form was analyzed using diphenylcarbazide (DPC) method by estimating the decrease in concentration of hexavalent chromium ( Zahoor and Rehman, 2009 ). The 24 h old grown culture was inoculated in 100 ml of LB broth containing 50 mg/L of Cr(VI) as K 2 Cr 2 O 7 at 30°C to estimate the chromium reduction. The samples were collected by centrifugation at 10,000 rpm for 10 min. The remaining concentration of Cr(VI) in the supernatant was determined by measuring the absorbance of Cr(VI)-DPC complex at 540 nm using spectrophotometer at various time intervals. The percentage reduction of Cr(VI) was calculated by using the following formula: Cr ( VI ) reduction ( % ) = A-B B × 100 Where A- Absorbance of control; B- Absorbance of sample. Transmission Electron Microscopy (TEM) Analysis The bacterial strain was analyzed through the TEM to confirm the presence and accumulation of hexavalent chromium inside the cell and to detect the effect of metal on the bacterium. Samples were prepared according to the method described by Bano et al. (2013) with slight modifications. The bacterial cell without any treatment served as control and various concentrations of Cr(VI) were taken as treatments for TEM analysis. The 48 h grown bacterial culture was harvested and pellet was washed with 1 M phosphate buffer saline (PBS) buffer. The cells were fixed using fixative (2.5% glutaraldehyde and 2% paraformaldehyde in 1 M PBS) for 6 h at 4°C and then washed three times with PBS to remove the fixative solution. The pellet was then suspended in 1 M PBS buffer and sent to SAIF, AIIMS, New Delhi for TEM analysis.
Show full methods section
Isolation and Characterization of Bacteria for PGP Traits
Samples were collected in triplicates from the degraded soils of coal mining site of Uttar Pradesh. Nutrient agar medium was used to isolate bacterial colonies by serial dilution technique and plates were observed after 24 h of incubation. Colonies were further purified by streak plate and preserved at 4°C for further experiments. Plant growth promoting characteristics of isolates were further identified by the standard procedure discussed below. The bacterial isolates were screened for indole-3-acetic acid (IAA) production using L-tryptophan and quantified colorimetrically by Salkowski method ( Loper and Scroth, 1986 ). The production of siderophore was initially screened on Chrome Azurol S (CAS) agar medium ( Schwyn and Neilands, 1987 ) and further estimated quantitatively by CAS shuttle assay as per described by Payne (1994) . An equal volume of culture supernatant was mixed with CAS reagent and absorbance was measured at 630 nm against the reference containing equal volume of uninoculated medium and CAS reagent. Percentage siderophore produced was calculated by using the formula: % siderophore units = ( Ar-As/Ar ) × 100 Where Ar = absorbance of the reference and As = absorbance of the sample. Bacterial isolates were further screened for phosphate solubilizing potential first qualitatively by growing isolates on Pikovskaya’s medium, and isolates showing clear zone were selected as potential phosphate solubilizer ( Premono et al., 1996 ). Bacterial isolates that have the highest solublization index were selected for the quantitative analysis done by using Pikovaskaya Broth and estimated spectrophotometrically using chlorostannous-reduced-molybdo-phosphoric acid method ( Yadav and Verma, 2012 ). The ACC deaminase activity of the isolates was further determined by the method of Saleh and Glick (2001) . The concentration of α- ketobutyrate produced by the action of ACC deaminase was determined spectrophotometrically and calculated with the help of standard curve. The amount of α- ketobutyrate produced is expressed as μ moles α-ketobutyrate/mg/24 h. Molecular Characterization of Potential Isolate The genomic DNA was isolated from the bacteria by enzymatic method using phenol/chloroform ( Maniatis et al., 1982 ). The DNA isolated was resuspended in TE buffer (pH 8.0) and amplified by PCR to obtain the 16S rRNA sequences. Universal primers, 8F (5′-AGAGTTTGATCCTGGCTCAG-3′) and 1492R (5′-AAGGAGGTGATCCAGCCGCA-3′) were used for DNA amplification. The PCR product was purified using QIAquick PCR Purification Kit (Qiagen). Purified PCR fragments were directly sequenced with Applied Biosystems, 3500XL Genetics Analyzer using the manufacturer’s instructions. Chromas Lite 2.0 software was used to read the sequences and the sequences were then aligned with the previous sequences available in the GenBank database by BLAST tool. A phylogenetic tree was created by the use of multiple sequence alignment tool, ClustalW and MEGA 6.06 software. Screening of Bacterial Isolates for Chromium(VI) Resistance The selected bacterium was further screened for its resistance to chromium (Cr VI) by agar well diffusion method ( Hassen et al., 1998 ). In addition the bacterium was also screened for resistance to various metals including Iron (Fe), Copper (Cu), Arsenic (As), Mercury (Hg), Cadmium (Cd) and Nickel (Ni). Various concentrations of metals were prepared by using their salts as: K 2 Cr 2 O 7 for Cr(VI), NaAsO 2 for As, HgCl 2 for Hg, CdCl 2 for Cd, FeCl 3 for Fe and Ni(NO 3 ) 2 for Ni in distilled water and sterilized by autoclaving. Sterile MHA plates were prepared and spreaded with the overnight grown bacterial culture. After this, approximate 7 mm diameter wells were punched with a sterile borer and filled with metals (100 μl) with various concentrations to determine the value of MIC. The plates were then incubated at 30°C for 24–48 h and zones around the wells were measured. Metal concentration which gave a clear zone of 1 mm or less than 1 mm was considered as the MIC and the bacterium resistant for that particular concentration ( Rani et al., 2010 ). Screening of Isolate for Cr (VI) Reduction The ability of bacterial isolate to reduce Cr(VI) into less toxic form was analyzed using diphenylcarbazide (DPC) method by estimating the decrease in concentration of hexavalent chromium ( Zahoor and Rehman, 2009 ). The 24 h old grown culture was inoculated in 100 ml of LB broth containing 50 mg/L of Cr(VI) as K 2 Cr 2 O 7 at 30°C to estimate the chromium reduction. The samples were collected by centrifugation at 10,000 rpm for 10 min. The remaining concentration of Cr(VI) in the supernatant was determined by measuring the absorbance of Cr(VI)-DPC complex at 540 nm using spectrophotometer at various time intervals. The percentage reduction of Cr(VI) was calculated by using the following formula: Cr ( VI ) reduction ( % ) = A-B B × 100 Where A- Absorbance of control; B- Absorbance of sample. Transmission Electron Microscopy (TEM) Analysis The bacterial strain was analyzed through the TEM to confirm the presence and accumulation of hexavalent chromium inside the cell and to detect the effect of metal on the bacterium. Samples were prepared according to the method described by Bano et al. (2013) with slight modifications. The bacterial cell without any treatment served as control and various concentrations of Cr(VI) were taken as treatments for TEM analysis. The 48 h grown bacterial culture was harvested and pellet was washed with 1 M phosphate buffer saline (PBS) buffer. The cells were fixed using fixative (2.5% glutaraldehyde and 2% paraformaldehyde in 1 M PBS) for 6 h at 4°C and then washed three times with PBS to remove the fixative solution. The pellet was then suspended in 1 M PBS buffer and sent to SAIF, AIIMS, New Delhi for TEM analysis.
Assessment of Physiological
Changes in Bacteria under Different Cr(VI) Treatments Culture Preparations The bacteria were inoculated in nutrient broth medium at 28–30°C overnight under continuous shaking. Samples were collected from the bacterial suspension at exponential phase and the concentration was adjusted to nearly 2 × 10 6 bacteria/ml ( Walberg et al., 1997 ). The pellet of bacterial cells were then collected by centrifugation at 8000 rpm for 5 min, washed thrice with 0.1 M phosphate buffered saline (PBS) and resuspend the pellet in PBS to reach an optical density of 0.1 at 600 nm.
Exposure to Chromium Treatment
The bacterial cells were analyzed for their resistance pattern against various concentrations of chromium (VI) by studying CFU pattern and performing growth profile study by UV spectrometry, FM and FCM. The metal stress was generated by method described by Boswell et al. (1998) . Potassium dichromate (K 2 Cr 2 O 7 ) salt solution was prepared for generating chromium stress at concentration starting from 50, 100, 150, 200, 250, and 300 mg/L and the bacterial suspension was then exposed to different concentration of Cr(VI). A control was prepared without any metal exposure. The resistance pattern and bacterial responses in the presence of various Cr(VI) treatments were studied after 12 h of incubation.
Fluorescence Spectroscopy and Flow Cytometric Measurements
The bacterial suspension was further stained with PI, a nucleic acid staining dye, and analyzed through FM and FCM. After treatment, 10 μl PI (40 μg/ml) was added to 200 μl of bacterial suspension in the centrifuge tube and incubated for 15 min in dark to allow staining of the cells. The cells were immediately analyzed after the incubation period by FM and FCM. Flow cytometry study was carried out using a BD Accuri TM C6 Flow Cytometer with a red laser of 14.7 mW output and a constant wavelength excitation of 640 nm and a blue laser of 20 mW with excitation at a wavelength of 488 nm. The FCM instrument detects forward scatter (FSC) and side scatter (SSC) and is equipped with four different types of fluorescence detectors with optical filters. The red color (FL2, 585 nm; PE/PI) fluorescence detector was used for the current flow cytometric study. The optical detectors employed to collect the scattered laser light and fluorescent emissions, and electronics digitize these signals for computational analysis. The light scatter data gives a basic idea regarding cells relative size, and morphology. The fluorescence data reveals the cells’ auto fluorescence and/or labeling with fluorescent dyes, which can help characterize bacteria, resolve them from electronic noise and debris, and indicate cell viability and vitality. A detection limit of 10,000 bacteria was set for each sample and all experiments were conducted in triplicate.
Statistical Analysis
The data obtained from the study were statistically analyzed and presented with the appropriate standard deviation from the data obtained in triplicates. The data were standardized by one-way analysis of variance (ANOVA). The least significant differences among means were compared at P ≤ 0.05 significance level. The data analysis and preparation of graphs were done by using the software OriginPro 8. 3.
Supplementary Material The Supplementary Material for this article can be found online at: http://journal.frontiersin.org/article/10.3389/fpls.2017.00778/full#supplementary-material Click here for additional data file.
📊 Figures
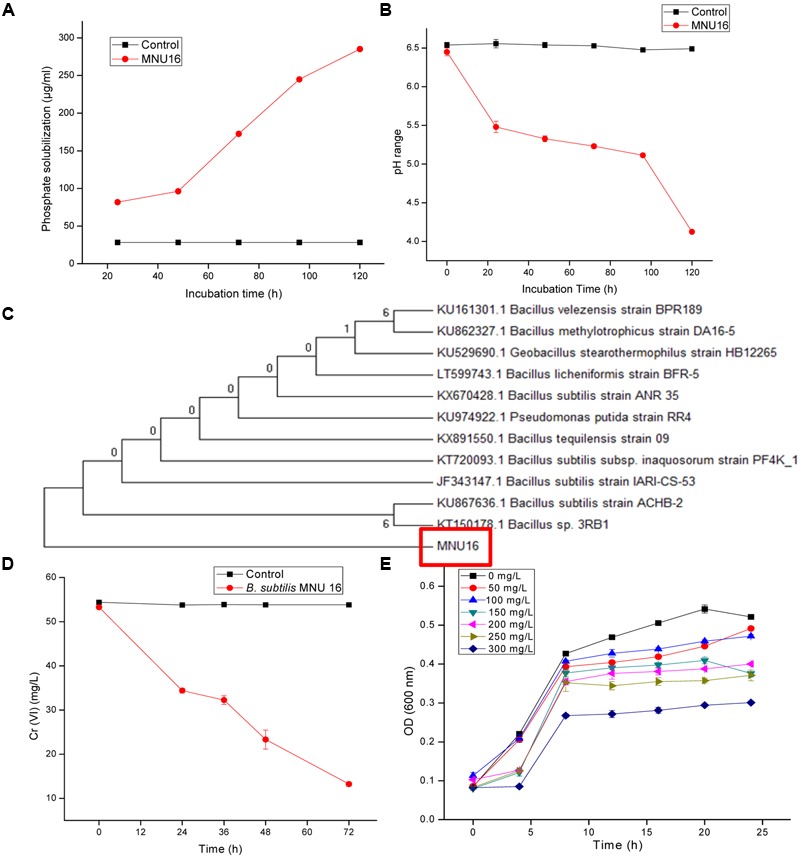
FIGURE 1
(A) Quantitative solubilization of phosphate by Bacillus sp. MNU16. (B) Lowering of pH in the broth due to P-solubilizing activity of Bacillus sp. MNU16. Data are average u00b1 standard deviation of e...
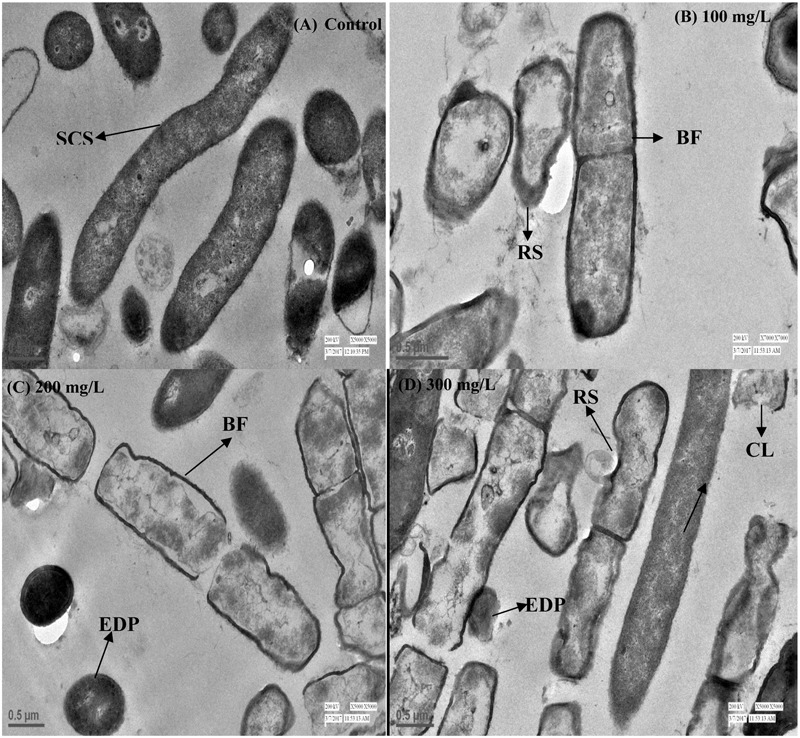
FIGURE 2
Transmission electron microscopy (TEM) images of cross sectioned B. subtilis MNU16 cells at (A) control (without treatment). (B) B. subtilis MNU16 cells at 100 mg/L of Cr(VI) (C) B. subtilis MNU16 cel...
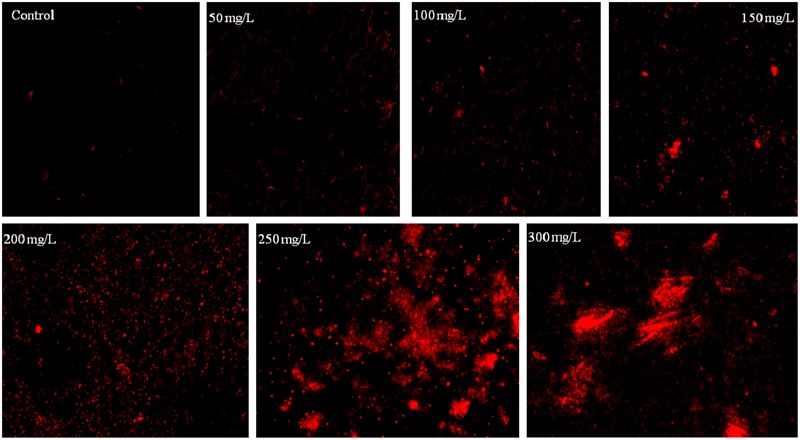
FIGURE 3
Fluorescence microscopy images of B. subtilis stained with PI incubated at different concentration of chromium .
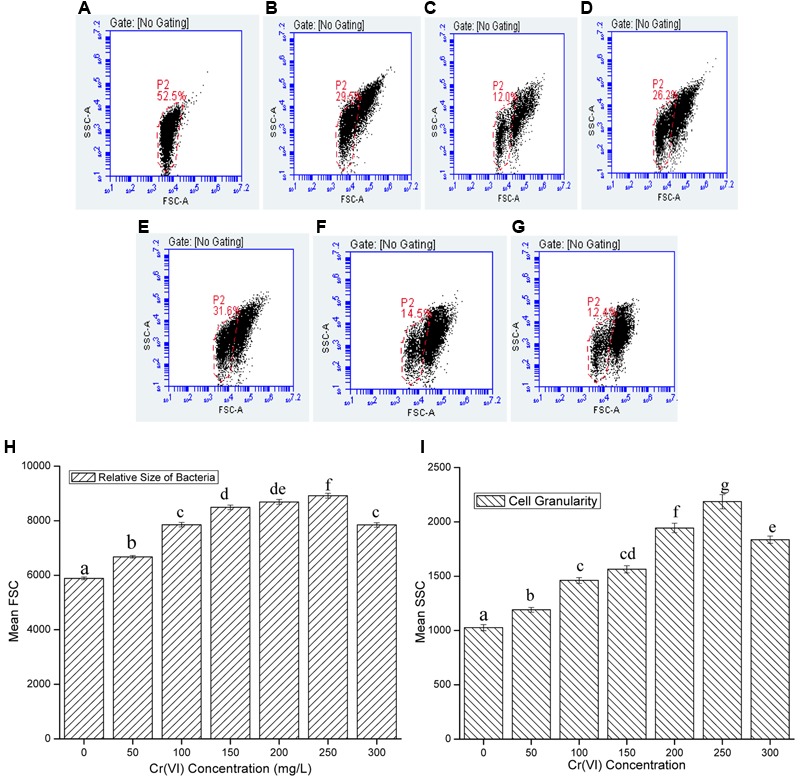
FIGURE 4
Representative dot-plots of cell size (FSC) and cell complexity (SSC) at various concentration of chromium (A) 0 mg/L; (B) 50 mg/L; (C) 100 mg/L; (D) 150 mg/L; (E) 200 mg/L; (F) 250 mg/L; (G) 300 mg/L...
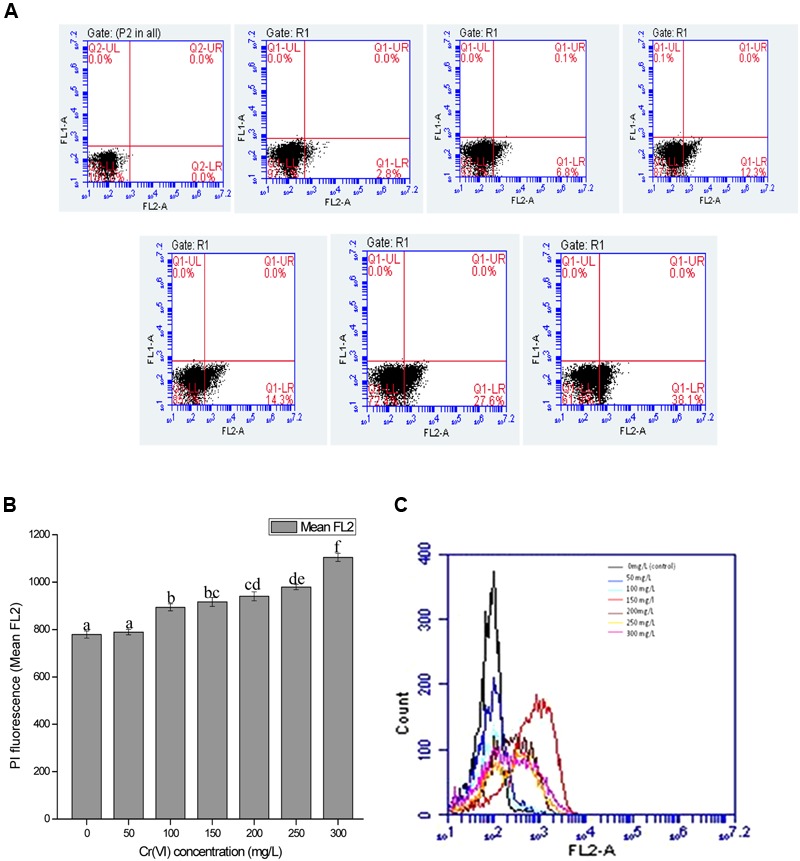
FIGURE 5
(A) Graph represents dot plots of mean FL2-A which shows the PI inclusion (% cell death) at various chromium (VI) concentrations ranged from 0 mg/L (control), 50, 100, 150, 200, 250, and 300 mg/L. (B)...
Figure images are served from the NIH/NLM PubMed Central Open Access Subset or Europe PMC; copyright remains with the publishers and authors.
💬 Discussion
0 commentsNo comments yet. Be the first to start a discussion!
Leave a Comment