Abstract
Transcription is regulated through binding factors to gene promoters to activate or repress expression, however, the mechanisms by which factors find targets remain unclear. Using single-molecule fluorescence microscopy, we determined in vivo stoichiometry and spatiotemporal dynamics of a GFP tagged repressor, Mig1, from a paradigm signaling pathway of Saccharomyces cerevisiae. We find the repressor operates in clusters, which upon extracellular signal detection, translocate from the cytoplasm, bind to nuclear targets and turnover. Simulations of Mig1 configuration within a 3D yeast genome model combined with a promoter-specific, fluorescent translation reporter confirmed clusters are the functional unit of gene regulation. In vitro and structural analysis on reconstituted Mig1 suggests that clusters are stabilized by depletion forces between intrinsically disordered sequences. We observed similar clusters of a co-regulatory activator from a different pathway, supporting a generalized cluster model for transcription factors that reduces promoter search times through intersegment transfer while stabilizing gene expression.
🔬 Techniques
🔭 Microscopes
🧬 Organisms
💻 Software
✨ Fluorophores
🧪 Sample Preparation
🔬 Cell Lines
🏭 Microscope Brands
🧪 Reagent Suppliers
🔴 Lasers
📷 Detectors
💻 Software Details
📋 Protocols
💻 Code & Software
💾 Data Repositories
🏛️ Research Organizations (ROR)
Affiliated research institutions:
📋 Methods
Strain construction and characterization
We developed Mig1 fluorescent protein strains based on strain YSH1351 ( Bendrioua et al., 2014 ) using eGFP in the first instance and also mGFP/GFPmut3 designed to inhibit oligomerization ( Zacharias et al., 2002 ), and photoswitchable mEos2 ( McKinney et al., 2009 ). Mig1-mGFP and Mig1-mEos2 fusions were constructed by introducing into YSH1351 (BY4741 wild type) cells the mGFP-HIS3 or mEOs2-HIS3 PCR fragment flanked on its 5′ end with 50 bp sequence of MIG1 3′ end and 50 bp downstream of MIG1 excluding the STOP codon. The mEOs2-HIS3 and mGFP-HIS3 fragment was amplified from mEOS-his plasmid (GeneArt, Life Technologies, Renfrew, UK) and pmGFP-S plasmid designed for this study by inserting the mGFP sequence into plasmid YDp-H. Modified strains in which the SNF1 gene was deleted, snf1∆ , were prepared by compromising the gene with an auxotrophic marker by providing the LEU2 fragment amplified from plasmid YDp-L and flanked with 50 bp of SNF1 upstream and downstream sequence on 5′ and 3′ ends, respectively, directly into cells. Strains in which Snf1 kinase activity can be inhibited by 25 µM 1NM-PP1 (Cayman Chemical, Ann Arbor, Michigan, USA) in DMSO were prepared by introducing into cells a plasmid with an ATP analog-sensitive version of Snf1 with I132G mutation ( Rubenstein et al., 2008 ). DMSO itself has been shown previously not to affect Mig1’s behavior under different glucose conditions ( Shashkova et al., 2017 ) similar to our own findings ( Figure 2—figure supplement 2 ). All transformations were performed using the lithium acetate protocol ( Gietz and Schiestl, 2007 ). Cell doubling times of all strains were calculated ( Warringer et al., 2011 ) ( Figure 1—figure supplement 2A ) based on OD 600 values obtained during cultivation in media supplemented with 4% or 0.2% glucose (Bioscreen analyser C). We quantified mRNA relative expression of the MIG1 gene using qPCR against the constitutive actin gene ACT1 in the wild type and the Mig1-mGFP strain in cells pre-grown in 4% glucose and then shifted to elevated (4%) and depleted (0.2%) extracellular glucose for 2 hr. mRNA isolation and cDNA synthesis were performed as described previously ( Geijer et al., 2013 ). For Msn2-GFP experiments we used the YSH2350 strain ( MATa msn2-GFP-HIS3 nrd1-mCherry-hphNT1 MET LYS) in BY4741 background.
Show full methods section
Strain construction and characterization
We developed Mig1 fluorescent protein strains based on strain YSH1351 ( Bendrioua et al., 2014 ) using eGFP in the first instance and also mGFP/GFPmut3 designed to inhibit oligomerization ( Zacharias et al., 2002 ), and photoswitchable mEos2 ( McKinney et al., 2009 ). Mig1-mGFP and Mig1-mEos2 fusions were constructed by introducing into YSH1351 (BY4741 wild type) cells the mGFP-HIS3 or mEOs2-HIS3 PCR fragment flanked on its 5′ end with 50 bp sequence of MIG1 3′ end and 50 bp downstream of MIG1 excluding the STOP codon. The mEOs2-HIS3 and mGFP-HIS3 fragment was amplified from mEOS-his plasmid (GeneArt, Life Technologies, Renfrew, UK) and pmGFP-S plasmid designed for this study by inserting the mGFP sequence into plasmid YDp-H. Modified strains in which the SNF1 gene was deleted, snf1∆ , were prepared by compromising the gene with an auxotrophic marker by providing the LEU2 fragment amplified from plasmid YDp-L and flanked with 50 bp of SNF1 upstream and downstream sequence on 5′ and 3′ ends, respectively, directly into cells. Strains in which Snf1 kinase activity can be inhibited by 25 µM 1NM-PP1 (Cayman Chemical, Ann Arbor, Michigan, USA) in DMSO were prepared by introducing into cells a plasmid with an ATP analog-sensitive version of Snf1 with I132G mutation ( Rubenstein et al., 2008 ). DMSO itself has been shown previously not to affect Mig1’s behavior under different glucose conditions ( Shashkova et al., 2017 ) similar to our own findings ( Figure 2—figure supplement 2 ). All transformations were performed using the lithium acetate protocol ( Gietz and Schiestl, 2007 ). Cell doubling times of all strains were calculated ( Warringer et al., 2011 ) ( Figure 1—figure supplement 2A ) based on OD 600 values obtained during cultivation in media supplemented with 4% or 0.2% glucose (Bioscreen analyser C). We quantified mRNA relative expression of the MIG1 gene using qPCR against the constitutive actin gene ACT1 in the wild type and the Mig1-mGFP strain in cells pre-grown in 4% glucose and then shifted to elevated (4%) and depleted (0.2%) extracellular glucose for 2 hr. mRNA isolation and cDNA synthesis were performed as described previously ( Geijer et al., 2013 ). For Msn2-GFP experiments we used the YSH2350 strain ( MATa msn2-GFP-HIS3 nrd1-mCherry-hphNT1 MET LYS) in BY4741 background.
Protein production and purification
His-tagged mCherry , eGFP and mGFP genes were amplified by PCR and cloned into pET vectors. An expression pRSET A plasmid containing 6xHis-Mig1-mGFP was obtained commercially (GeneArt, Life Technologies). Escherichia coli strain BL21(DE3) carrying the expression plasmid was grown in LB with 100 µg/ml ampicillin and 34 µg/ml chloramphenicol at 37°C to OD 600 0.7. Protein expression was induced by adding isopropyl-β-D-thiogalactopyranoside (IPTG) at final concentration of 1 mM for 3 hr at 30°C. Cells were suspended in 50 mM NaH 2 PO 4 , 10 mM Tris, 300 mM NaCl, 2 mM EDTA, 0.2 mM PMSF, 0.1% β-mercaptoethanol, pH 8.0, and lysed by sonication or by three passages through a chilled Emulsiflex (Avestin, Mannheim, Germany). Extracts were cleared (24,000 g, 30 min) and filtered (pore diameter 0.45 µm; Millipore, Bedford). All proteins were purified using Ni 2+ affinity chromatography on a 5 ml HisTrap FF column (GE Healthcare, Chicago, Illinois, USA). Mig1-mGFP was eluted with a linear gradient 0–0.4 M imidazole in lysis buffer. Mig1-mGFP was further purified by size-exclusion chromatography (Superdex 200 Increase 10/300, GE Healthcare) and concentrated (50 kDa molecular weight cutoff VIVASPIN 20 concentrator). Purity of the sample was confirmed by Coomassie stained SDS-PAGE gels (Simply Blue Safe Stain, Life Technologies, Carlsbad, California, United States ).
Media and growth conditions
Cells from frozen stocks were grown on plates with standard YPD media (10 g/l yeast extract, 20 g/l bacto-peptone, 20 g/l agar) supplemented with 4% glucose (w/v) at 30°C overnight. For the liquid cultures, the YPD was prepared as above but without agar, and the cells were grown at 30°C while shaking (180 rpm). For transformants that carried a plasmid with mutated SNF1 (p SNF1-I132G ) or PP7-2xGFP (pDZ276), minimal YNB media with –URA amino acid supplement was applied. For the growth rate experiments cells were grown on 100 well plates in YNB with complete amino acid supplement and 4% glucose (w/v) until logarithmic phase, subcultured into fresh medium on a new 100 well plate and grown until logarithmic phase again. 10 µl of each culture was resuspended in 250 µl of fresh YNB medium with 4% or 0.2% glucose (w/v) on a new plate and cultivated in Bioscreen analyser C for 96 hr at 30°C or 22°C. OD measurements at 600 nm were taken every 10 min with prior shaking. Each strain was represented in sextuplicates. For microscopy experiments on the BY4741 wild type and/or cells with genetically integrated fluorescent proteins, minimal YNB media (1.7 g/l yeast nitrogen base without amino acids and (NH 4 ) 2 SO 4 , 5 g/l (NH 4 ) 2 SO 4 , 0.79 g/l complete amino acid supplement as indicated by manufacturer) with appropriate glucose concentrations was used. In brief, cells were first streaked onto YPD plates, grown overnight at 30°C prior to culturing in liquid minimal YNB media with complete amino acid supplement and 4% glucose overnight, then sub-cultured into fresh YNB with 4% glucose for 4 hr with shaking at 30°C. Cultures were spun at 3,000 rpm, re-suspended into fresh YNB with (4%) or without (0%) glucose, immobilized in 1 μl spots onto an 1% agarose well perfused with YNB minimal media with an appropriate glucose concentration enclosed between a plasma-cleaned BK7 glass microscope coverslip and slide, which permitted cells to continue to grow and divide ( Reyes-Lamothe et al., 2010 ; Badrinarayanan et al., 2012 ) while being observed for up to several hours if required. Images were acquired not longer than 2 hr after the last media switch. SDS-PAGE 50 ml cultures of YSH1703 transformed with centromeric pMig1-HA and pSNF1-I132G-TAP or pSNF1-TAP plasmids were grown until mid-log phase in yeast nitrogen base, 4% glucose, uracil and histidine deficient. Each culture was separated into two new cultures with 4% and 0.05% glucose, respectively, and incubated for 30 min. The following procedure was adapted from Bendrioua et al ( Bendrioua et al., 2014 ). Cells were harvested by centrifugation (3,000 rpm, 50 s), suspended in 1 ml of 0.1M NaOH for 5 min and spun down. Pellets were suspended in 2 ml of 2M NaOH with 7% β- mercaptoethanol for 2 min and then 50% trichloroacetic acid was added. Samples were vortexed and spun down at 13,000 rpm. The pellets were washed in 0.5 ml of 1M Tris-HCl (pH 8.0), resuspended in 50 µl of 1x SDS sample buffer (62.5 mM Tris-HCl (pH 6.8), 3% SDS, 10% glycerol, 5% β-mercaptoethanol, and 0.004% bromophenol blue) and boiled for 5 min. The protein extracts were obtained by centrifuging at the maximal speed and collecting the supernatants. For western blotting, 50 μg of extracted proteins were resolved on a Criterion TGX 10% precast polyacrylamide gel, then transferred onto a nitrocellulose membrane (Trans-Blot Turbo Transfer Pack, Bio-Rad Laboratories, Hercules, California, USA) using Trans-Blot Turbo Transfer System (Bio-Rad). After transfer, the membrane was blocked in Odyssey Blocking buffer (LI-COR Biosciences, Lincoln, Nebraska, USA). Mig1 was detected using primary mouse anti-HA (1:2000) antibodies (Santa Cruz Biotechnology, Dallas,Texas, USA), then secondary goat anti-mouse IRDye-800CW (1:5000) antibodies (LI-COR Biosciences). The result was visualized using an infrared imager (Odyssey, LI-COR Biosciences), 800 nm channel. Native PAGE A 50 ml culture of the YSH2862 strain was grown until mid-log phase in rich media with 4% glucose, then, 25 ml of the culture was transferred into fresh YPD with 4% glucose, and the rest into YPD with 0.05% glucose for 30 min. The cultures were harvested by centrifugation, suspended in 0.1 ml of solubilization buffer (100 mM Tris-HCl, pH 6.8, 0.1 mM Na 3 VO 4 , 1x protease inhibitor cocktail (Roche, Mannheim, Germany), 0.1% Triton-X100). 400 µl of glass beads were added, and cells were broken by FastPrep, 6 m/s, 20 s. Protein extracts were obtained by adding 150 µl of solubilization buffer, centrifugation at 13,000 rpm, 5 min and collecting the supernatant. Protein quantification was performed by using Bradford with BSA standard (Bio-Rad). 250 µg of total protein extracts were run on a Criterion TGX Stain Free 10% precast polyacrylamide gel (Bio-Rad). Samples were diluted 1:1 with 2x Native Sample Buffer (Bio-Rad). Electrophoresis was performed at 4°C starting at 100V until the bromophenol blue line reached the end of the gel. The gel was transferred onto a nitrocellulose membrane (Trans-Blot Turbo Transfer Pack, Bio-Rad) using Trans-Blot Turbo Transfer System (Bio-Rad). After transfer, the membrane was blocked in Odyssey Blocking buffer (LI-COR Biosciences), analyzed by immunoblotting with mouse anti-GFP (1:500) antibodies (Roche) and visualized with goat anti-mouse IRDye-800CW (1:5,000) antibodies (LI-COR Biosciences) by using an infrared imager (Odyssey, LI-COR Biosciences), 800 nm channel. As a molecular weight reference, a NativeMark Unstained Protein Standards (Invitrogen) were used.
Slimfield microscopy
A dual-color bespoke laser excitation single-molecule fluorescence microscope was used ( Badrinarayanan et al., 2012 ; Wollman and Leake, 2015 ; Shashkova and Leake, 2017 ) utilizing narrow epifluorescence excitation of 10 μm full width at half maximum (FWHM) in the sample plane to generate Slimfield illumination. GFP and mCherry excitation used co-aligned linearly polarized 488 nm and 561 nm wavelength 50 mW lasers (CoherentInc., OBIS lasers, SantaClara, California, USA) respectively which could be attenuated independently via neutral density filters followed by propagation through an achromatic λ/2 plate to rotate the plane of polarization prior to separation into two independent paths generated by splitting into orthogonal polarization components by a polarization splitting cube to enable simultaneous Slimfield illumination and a focused laser bleach illumination path for fluorescence recovery after photobleaching (FRAP) when required. The two paths were reformed into a single common path via a second polarization cube, circularized for polarization via an achromatic λ/4 plate with fast axis orientated at 45° to the polarization axes of each path and directed at ~6 W/cm 2 excitation intensity onto the sample mounted on an xyz nanostage (Mad City Labs, the Dane County, Wisconsin, USA) via a dual-pass green/red dichroic mirror centered at long-pass wavelength 560 nm and emission filters with 25 nm bandwidths centered at 525 nm and 594 nm (Chroma Technology Corp., Rockingham, Vermont, USA). Fluorescence emissions were captured by a 1.49NA oil immersion objective lens (Nikon, Tokyo, Japan) and split into green and red detection channels using a bespoke color splitter utilizing a long-pass dichroic mirror with wavelength cut-off of 565 nm prior to imaging each channel onto separate halves of the same EMCCD camera detector (iXon DV860-BI, Andor Technology, UK) at a pixel magnification of 80 nm/pixel using 5 ms camera exposure time. We confirmed negligible measured crosstalk between GFP and mCherry signals to red and green channels respectively, using purified GFP and mCherry sampled in an in vitro surface immobilization assay (details below). Three color microscopy was performed on the same microscope, using a 50 mW 532 nm wavelength laser (Obis) to excite mKO2, coupled into the same optics as before with the addition of a 532 nm notch rejection filter (Semrock, Rochester, New York, UK) in both channels of the imaging path. This allowed 1 mW of laser excitation at the sample. Due to the high copy number of plasmid expressed PP7-2xGFP and the 48 RNA loci, the 488 nm wavelength laser was attenuated to ~10μW. Each fluorophore was separately excited in the following order: mCherry, mKO2 and GFP to prevent crosstalk. mCherry and mKO2 both emit in the ‘red’ channel of the microscope, while GFP appears in the ‘green’ with very limited crosstalk.
Microfluidics control of single cell imaging
To investigate time-resolved glucose concentration-dependent changes in Mig1-GFP localization in individual yeast cells, we used bespoke microfluidics and our bespoke control software CellBild (LabVIEW, National Instruments, Austin, Texas, United States ), enabling cell-to-cell imaging in response to environmental glucose changes. CellBild controlled camera acquisition synchronized to flow-cell environmental switches via a syringe pump containing an alternate glucose environment. Microfluidic flow-chambers were based on an earlier 4-channel design ( Gustavsson et al., 2012 ). Prior to each experiment flow-chambers were wetted and pre-treated for 15 min with 1 mg/ml of concanavalin A (ConA) which binds to the glass surface of the plasma cleaned flow-chamber. Cells were introduced via a side channel and were left to bind ConA for 15 min to immobilize cells on the surface. Any remaining ConA and unbound cells were washed out and a steady flow of YNB with 0% glucose provided to one of the central channels by gravity feed. A syringe pump synchronized with image acquisition introduced YNB with 4% glucose in the second central channel. The pumped alternate environment reaches cells within 1–2 s at a flow rate of 10 µl/min, enabling rapid change between two different glucose concentrations. Slimfield imaging was performed on a similar bespoke microscope setup at comparable laser excitation intensities and spectral filtering prior to imaging onto a Photometrics Evolve Delta 512 EMCCD camera at 200 frames per second. Alternating frame laser excitation (ALEX) was used to minimize any autofluorescence contamination in the red channel introduced by the blue excitation light. Around 1–4 cells were imaged in a single field of view for each glucose exchange. The same flow chamber was used for multiple fields of view such that each cell analyzed may have experienced up to four glucose exchange cycles. Foci detection, tracking and stoichiometry determination Foci were automatically detected using software written in MATLAB (Mathworks) ( Miller et al., 2015 ), lateral localization ~40 nm, enabling estimates of D and stoichiometry. Our bespoke foci detection and tracking software objectively identifies candidate bright foci by a combination of pixel intensity thresholding and image transformation to yield bright pixel coordinates. The intensity centroid and characteristic intensity, defined as the sum of the pixel intensities inside a 5 pixel radius region of interest around the foci minus the local background and corrected for non-uniformity in the excitation field are determined by iterative Gaussian masking. If the signal-to-noise ratio of the foci, defined as the characteristic intensity per pixel/background standard deviation per pixel, is >0.4 it is accepted and fitted with a 2D radial Gaussian function to determine its sigma width, which our simulations indicate single-molecule sensitivity under typical in vivo imaging conditions ( Wollman and Leake, 2015 ). Foci in consecutive image frames within a single point spread function (PSF) width, and not different in brightness or sigma width by more than a factor of two, are linked into the same track. The microscopic diffusion coefficient D is then estimated for each accepted foci track using mean square displacement analysis, in addition to several other mobility parameters. Cell and nuclear boundaries were segmented from GFP and mCherry fluorescence images respectively using a relative threshold pixel intensity value trained on simulated images of uniform fluorescence in idealized spherical compartments. An optimized threshold value of 0.3 times the mean compartment fluorescence intensity segmented the boundary to within 0.5 pixels. The characteristic brightness of a single GFP molecule was determined directly from in vivo data and corroborated using in vitro immobilized protein assays ( Leake et al., 2006 ). The intensity of tracked fluorescent foci in live cells was measured over time as described above ( Figure 1—figure supplement 3 ). These followed an approximately exponential photobleach decay function of intensity with respect to time. Every oligomeric Mig1-GFP complex as it photobleaches to zero intensity will emit the characteristic single GFP intensity value, I GFP , that is the brightness of a single GFP molecule, given in our case by the modal value of all foci intensities over time, and can potentially bleach in integer steps of this value at each sampling time point. This value of I GFP was further verified by Fourier spectral analysis of the pairwise distance distribution ( Leake et al., 2006 ) of all foci intensities which yields the same value to within measurement error in our system. All foci tracks found within 70 image frames of the start of laser illumination were included in the analysis and were corrected for photobleaching by weighting the measured foci intensity I at a time t following the start of laser illumination with a function exp(+ t/t b ) to correct for the exponential photobleach decay I 0 exp(- t/t b ), of each intensity trace with a fixed time constant, where I 0 is the initial unbleached intensity. This photobleach time constant t b was determined from exponential decay fits to the foci intensities and whole cell intensities over time to be 40 ± 0.6 ms. Stoichiometries were obtained by dividing the photobleach estimate for the initial intensity I 0 of a given foci by the characteristic single GFP molecule brightness value I GFP . Autofluorescence correction was applied to pool quantification by subtracting the red channel image from the green channel image multiplied by a correlation factor. By comparing wild type and GFP cell images we confirmed that when only the GFP exciting 488 nm wavelength laser was used the green channel image contained fluorescence intensity from GFP and autofluorescence, while the red channel contains only autofluorescence pixels, consistent with expectations from transmission spectra of known autofluorescent components in yeast cells. We measured the red channel autofluorescence pixels to be linearly proportional to the green channel autofluorescence pixels. The scaling factor between channels was determined by Slimfield imaging of the wild type yeast strain (i.e. non GFP) under the same conditions and comparing intensity values pixel-by-pixel in each channel. A linear relationship between pixels was found with scaling factor of 0.9 ± 0.1. Copy numbers of Mig1-GFP of the pool component were estimated using a previously developed CoPro algorithm ( Wollman and Leake, 2015 ). In brief, the cytoplasmic and nuclear pools were modelled as uniform fluorescence over spherical cells and nuclei using experimentally measured radii. A model PSF was integrated over these two volumes to create model nuclear and cytoplasmic images and then their relative contributions to the camera background and autofluorescence corrected GFP intensity image determined by solving a set of linear equations for each pixel. Dividing the contributions by the characteristic single GFP molecule intensity and correcting for out-of-plane foci yields the pool concentration. Stoichiometry distributions were rendered as objective kernel density estimations ( Leake et al., 2006 ) using a Gaussian kernel with bandwidth optimized for normally distributed data using standard MATLAB routines. Stochastic optical reconstruction microscopy (STORM) To photoswitch Mig1-mEos2, a 405 nm wavelength laser (Coherent Obis), attenuated to ~1 mW/ cm 2 was used in conjunction with the 488 nm and 561 nm lasers on the Slimfield microscope, similar to previous super-resolution imaging of yeast cells ( Puchner et al., 2013 ). The 405 nm laser light causes mEos2 to photoswitch from a green (excitable via the 488 nm laser) to a red (excitable by the 561 nm laser) fluorescent state. Using low intensity 405 nm light generates photoactive fluorophore foci, photobleached by the 561 nm laser at a rate which results in an approximately steady-state concentration density in each live cell studied. The bright foci were tracked using the same parameters and criteria for spot acceptance as the Slimfield data. The tracks were then used to generate a super-resolved image heat map with 20 nm pixel size by the summation of 2D Gaussian functions at each sub-pixel. Here, we assumed a sigma width of the 2D Gaussian function of 40 nm to match the measured lateral precision following automated particle tracking of Mig1-mEos2 foci ( Wollman and Leake, 2015 ).
Fluorescent protein brightness characterization
Fluorescent protein maturation time characterisations are described in more detail at Bio-Protocol ( Shashkova et al., 2018 ). We used a surface-immobilization assay described previously ( Badrinarayanan et al., 2012 ; Wollman and Leake, 2015 ) employing antibody conjugation to immobilize single molecules of GFP respectively onto the surface of plasma-cleaned BK7 glass microscope coverslips and imaged using the same buffer medium and imaging conditions as for live cell Slimfield experiments, resulting in integrated single-molecule peak intensity values for mGFP of 4,600 ± 3000 (±half width half maximum, HWHM) counts. Similar experiments on unmodified purified Clontech eGFP generated peak intensity values of 4,700 ± 2000 counts, statistically identical to that of mGFP (Student t -test, p=0.62) with no significant indication of multimerization effects from the measured distribution of foci intensity values. Similarly, Slimfield imaging and foci stoichiometry analysis on Mig1-mGFP and Mig1-eGFP cell strains were compared in vivo under high and low glucose conditions in two separate cell strains, resulting in distributions which were statistically identical (Pearson’s χ 2 test comparing KDEs, Figure 1—figure supplement 2E and F ). These results indicated no measurable differences between multimerization state or single-molecule foci intensity between mGFP and eGFP which enabled direct comparison between Mig1-eGFP cell strain data obtained from preliminary experiments here and from previous studies ( Bendrioua et al., 2014 ). Maturation effects of mCherry and GFP were investigated by adding mRNA translation inhibitor antibiotic cycloheximide, final concentration 100 µg/ml, for 1 hr ( Hartwell et al., 1970 ), photobleaching cells, then monitoring any recovery in fluorescence as a metric for newly matured fluorescent material in the cell. Cells were prepared for microscopy as before but using cycloheximide in all subsequent preparation and imaging media and imaged using a commercial mercury-arc excitation fluorescence microscope Zeiss Axiovert 200M (Carl Zeiss MicroImaging GmbH, Jena, Germany) onto an ApoTome camera using a lower excitation intensity than for Slimfield imaging but a larger field of view, enabling a greater number of cells to be imaged simultaneously. Surface-immobilized cells using strain YSH2863 were photobleached by continuous illumination for between 3 min 40 s to 4 min until dark using separate filter sets 38HE and 43HE for GFP and mCherry excitation, respectively. Fluorescence images were acquired at subsequent time intervals up to 120 min and analyzed using AxioVision software ( Figure 1—figure supplement 2C ). The background-corrected total cellular fluorescence intensity was quantified at each time point for each cell using ImageJ software. Comparison between Mig1-GFP fluorescence signal and the green channel signal from the parental strain BY4741, and the Nrd1-mCherry signal and the red channel signal from the parental strain, indicate fluorescence recovery after correction above the level of any autofluorescence contributions of 1 gold foci clustering together inside an area of effective diameter ~50 nm or less, with up to seven gold foci per cluster being observed.
Bioinformatics analysis and structural modeling
Bioinformatics analysis was used to identity candidate promoter sequences in the budding yeast genome. The Mig1 target pattern sequence was identified based on 14 promoter sequences ( Lundin et al., 1994 ) using the IUPAC nucleotide code. The entire S. cerevisiae S288c genome was scanned in order to find all sequences that matched the pattern. The scanning was performed by RNABOB software ( Riccitelli and Lupták, 2010 ), and collated for any further analysis and identification of the sequences lying within promoter regions. All information regarding S. cerevisiae genes was obtained from SGD database ( http://yeastgenome.org/ ).( Cherry et al., 2012 ) Using a consensus structural model for the budding yeast chromosome based on 3C data ( Duan et al., 2010 ) we explored various different models of Mig1 binding to the putative promoter sequence identified from the bioinformatics analysis. We generated simulated images from these models adding experimentally realistic levels of signal and noise, and ran these data through the same foci detection and analysis software as for the real live cell data using identical parameters throughout. We then compared these results to the measured experimental stoichiometry ( Figure 4C ). Monomer models assume that a single Mig1 molecule binds to a target promoter site, whereas cluster models assume that a cluster comprising 7 Mig1 molecules (based on our observations of stoichiometry periodicity) binds a single target promoter. Copy number analysis indicated 190 Mig1 molecules per cell on average associated with foci. In the monomer model ( Figure 4C ) all 109 promoter sites were assigned a Mig1 molecule and the remaining 81 Mig1 molecules were placed randomly in the 222 remaining Mig1 target binding sites within the rest of the genome. In the DNA cluster model ( Figure 4—figure supplement 1 ) we randomly assigned the observed 190 Mig1 molecules in foci into just 27 clusters to Mig1 target promoter sites. We also tested two nuclear envelope (NE) variants of both models, to account for the trans-nuclear tracks: here, typically ~7 Mig1 were observed translocating from the nucleus to the cytoplasm at glucose (+) within the microscope’s depth of field; extrapolating this value over the whole nucleus this indicates ~130 Mig1 molecules within the nucleus but less than a single PSF width from the nuclear envelope prior to export to the cytoplasm. We simulated this effect using either 130 Mig1 molecules as Mig1 monomers or as 18 (i.e. ~130/7) 7-mer clusters at random 3D coordinates at the simulated nuclear envelope position in the 3C model. Finally, to generate the best fit Mig1 cluster model, we obtained an optimized fit to the data with a mixed population model with 75% of cells in the NE cluster model and 25% in the DNA cluster model. We note here that the monomer model can produce higher apparent stoichiometry due to the increased density of resulting foci (although the same density of Mig1). We used bioinformatics to investigate the extent of intrinsic disorder in the amino acid sequence of budding yeast Mig1 and Msn2 proteins as well as the E. coli lac repressor LacI, employing the Predictor of Natural Disordered Regions (PONDR) algorithm ( Obradovic et al., 2005 ) (online tool http://www.pondr.com/cgi-bin/PONDR/pondr.cgi ) with a VL-XT algorithm. We also used the secondary structure prediction algorithm of PyMOL ( http://www.pymolwiki.org/index.php/Dss ) to highlight disordered and structured regions and display the unfolded protein chain, and used PSI-BLAST multiple sequence alignment to determine conserved structural features of Mig1 for the Zn finger motif in combination with the DISOPRED ( Ward et al., 2004 ) algorithm as a comparison to PONDR, which produced very similar results (online tool http://www.yeastrc.org/pdr/ ). Oligomerization state of Mig1-GFP in the ‘pool’ Experimental in vitro assays of surface immobilized GFP coupled to simulations trained on these single-molecule intensity measurements but using noise levels comparable to in vivo cellular imaging conditions ( Wollman and Leake, 2015 ) indicate single-molecule sensitivity of GFP detection under our millisecond imaging conditions. However, if the nearest neighbor separation of individual GFP ‘foci’ are less than the optical resolution limit w of our microscope (which we measure as ~230 nm for GFP imaging) then distinct fluorescent foci will not be detected and instead will be manifest as a diffusive ‘pool’. If each GFP ‘foci’ in the pool has a mean stoichiometry S then the mean number of GFP foci, F , in the pool is n pool / S and the ‘pool’ condition for nearest neighbor foci separation s indicates that s < w . The estimated range of mean total pool copy number from nucleus and cytoplasm combined, n pool , is ~590–1,100 molecules depending on extracellular glucose conditions. Approximating the cell volume as equal to the combined volumes of all uniformly separated foci in the pool (equal to the total number of foci multiplied by the volume of an equivalent sphere of radius r ) indicates that F .4π r 3 /3 = 4π d 3 /3, thus r = d / F 1/3 , where we use the mean measured cell diameter d of ~5 μm. However, mobile foci with a microscopic diffusion coefficient D will diffuse a mean two-dimensional distance b in focal plane of (4 D .Δ t ) 1/2 in a camera sampling time window Δ t of 5 ms. Using D ~ 6 μm 2 s −1 as a lower limit based on the measured diffusion of low stoichiometry cytoplasmic Mig1-GFP foci detected indicates b ~ 340 nm so the movement-corrected estimate for s is r-b , thus s < w indicates that r < b + w, or d / F 1/3 < b+w . Therefore, d ( S / n pool ) 1/3 < b+w , and S < n pool (( b + w )/ d ) 3 . Using ~590–1,100 molecules from the measured mean range of n pool indicates that the upper limit for S is in the range 0.8–1.4; in other words, Mig1-GFP foci in the pool are consistent with being a monomer.
Analysis of the mobility of foci
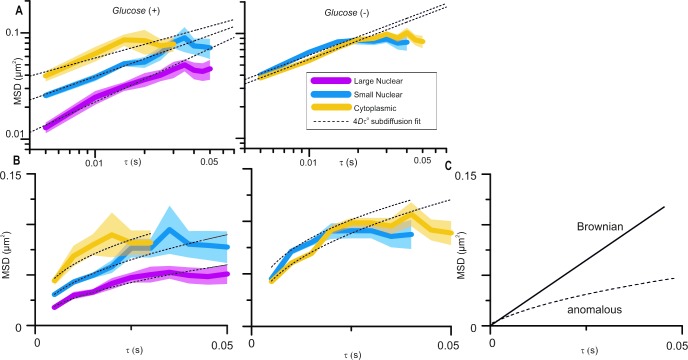
For each accepted foci track the mean square displacement (MSD) was calculated from the optimized intensity centroid at time t of ( x ( t ) , y ( t ) ) assuming a tracks of N consecutive image frames at a time interval τ = n Δ t is ( Gross and Webb, 1988 ; Michalet, 2010 ) where n is a positive integer is: M S D ( τ ) = M S D ( n Δ t ) = 1 N − 1 − n ∑ i = 1 N − 1 − n { [ x ( i Δ t + n Δ t ) − x ( i Δ t ) ] 2 + [ y ( i Δ t + n Δ t ) − y ( i Δ t ) ] 2 } = 4 D τ + 4 σ 2 Here σ is the lateral ( xy ) localization precision which we estimate as ~40 nm ( Wollman and Leake, 2015 ). The microscopic diffusion coefficient D was then estimated from the gradient of a linear fit to the first four time interval data points of the MSD vs τ relation for each accepted foci track. To determine the proportion of mobile and immobile Mig1-GFP fluorescent foci we adapted an approach based on cumulative probability-distance distribution analysis ( Gebhardt et al., 2013 ). Here we generated cumulative distribution functions (CDFs) for all nuclear and cytoplasmic tracks, such that the CDF in each dataset is the probability distribution function p c associated with r 2 , the square of the displacement between the first and second data points in each single track, which was generated for each track by calculating the proportion of all tracks in a dataset which have a value of r 2 less than that measured for that one track. The simplest CDF model assumes a Brownian diffusion propagator function f ( r 2 ) for a single effective diffusion coefficient component of: f ( r 2 ) = 1 4 π D Δ t exp ( r 2 4 D Δ t ) Here, D is the effective diffusion coefficient and Δ t is image sampling time per frame (i.e. in our case 5 ms). This gives a CDF single component solution of the form: p c ( r 2 ) = 1 − exp ( r 2 4 D Δ t ) We investigated both single and more complex multi-component CDF models using either 1,2 or 3 different D values in a weighted sum model of: p c ( r 2 ) = ∑ i = 1 n A i ( 1 − exp ( r 2 4 D i Δ t ) ) Here n is 1, 2 or 3. Multi-component fits were only chosen if they lowered the reduced χ 2 by >10%. For cytoplasmic foci at glucose (+/-) and for nuclear foci at glucose (−) this indicated single component fits for diffusion coefficient with a D of ~1–2 μm 2 /s, whereas nuclear foci at glucose (+) were fitted using two components of D, ~20% with a relatively immobile component, D ~ 0.1–0.2 μm 2 /s, and the remainder a relatively mobile component, D ~ 1–2 μm 2 /s, while using three components produced no statistically significant improvement to the fits. These values of D agreed to within experimental error to those obtained using a different method which fitted two analytical Gamma functions to the distribution of all calculated microscopic diffusion coefficients of tracked foci in the nucleus at glucose (+), which assumed a total probability distribution function p γ of the form: ( Stracy et al., 2015 ) p γ ( x , D ) = ∑ i = 1 2 A i ( m / D ) m x n − 1 exp ( − m x / D ) ( m − 1 ) ! Here, m is the number of steps in the MSD vs τ trace for each foci track used to calculate D (i.e. in our instance m = 4). We also probed longer time scale effects on foci mobility for each accepted foci trajectory. Here, average MSD values were generated by calculating mean MSD values for corresponding time interval values across all foci trajectories in each dataset, but pooling traces into low stoichiometry (≤20 Mig1-GFP molecules per foci) and high stoichiometry (>20 Mig1-GFP molecules per foci). We compared different diffusion models over a 30 ms time interval scale, corresponding to the shortest time interval range from any of the mean MSD trace datasets. We found in all cases that mean MSD traces could be fitted well (χ 2 values in the range 1–12) using a subdiffusion model of precision-corrected MSD = 4σ 2 + 4 Kτ α , where α the anomalous diffusion parameter and K is the transport parameter, analogous to the diffusion coefficient D in pure Brownian diffusion. Optimized fits indicated values of K in the range 0.08–0.2 µm 2 /s and those for α of ~0.4–0.8. Corresponding fits to a purely Brownian diffusion model (i.e. α = 1) generated much poorer fits (χ 2 values in the range 4–90). We used both short timescale CDF analysis and longer timescale MSD analysis of Mig1 tracks to try to gain as complete a picture of Mig1 mobility as possible. Short timescales avoid bias from photobleaching and diffusion out of the focal plane but longer timescales sample more of the cellular environment. Analyzing trans-nuclear tracks The segmentation boundary output for the nucleus was fitted with a smoothing spline function, with smoothing parameter p=0.9992 to sub-pixel precision. Trajectories which contained points on either side of the nuclear boundary were considered trans-nuclear. The crossing point on the nuclear boundary was found by linearly interpolating between the first pair of points either side of the nuclear boundary. Coordinates were normalized to this point and the crossing time and were rotated such that y′ and x′ lie perpendicular and parallel to the membrane crossing point. Investigating Mig1-GFP molecular turnover Turnover of Mig1-GFP was investigated using fluorescence recovery after photobleaching (FRAP). In brief a 200 ms 10 mW focused laser beam pulse of lateral width ~1 μm was used to photobleach the fluorescently-labelled nuclear contents on a cell-by-cell basis and then ≤10 Slimfield images were recorded over different timescales spanning a range from 100 ms to ~1,000 s. The copy number of pool and foci in each image at subsequent time points t post focused laser bleach was determined as described and corrected for photobleaching. These post-bleach photoactive Mig1-GFP copy number values C ( t ) could then be fitted using a single exponential recovery function: C ( t ) = C ( 0 ) ( 1 − exp ( − t / t R ) Where t R is the characteristic recovery (i.e. turnover) time ( Reyes-Lamothe et al., 2010 ). These indicated a value of 133 ± 20 s (±SEM) for nuclear foci at glucose (+), and 3 ± 14 s for nuclear pool at glucose (+) and (−). Modeling the effective diameter of clusters The effective diameter d of a cluster was estimated from the measured point spread function width pf foci (defined at twice sigma value of the equivalent Gaussian fit from our single particle tracking algorithm) corrected for the blur due to particle diffusion in the camera exposure time of Δ t as: d = p f o c i − p G F P − 4 D Δ t Where D is the measured microscopic diffusion coefficient for that track and p GFP is the measured point spread function width of surface-immobilized GFP (i.e. twice the sigma width of 230 nm measured in our microscope, or 460 nm). We explored a heuristic packing model of d ~ S a for Mig1-GFP monomers in each cluster, such that a tightly packed spherical cluster of volume V composed of S smaller ca. spherical monomers each of volume V 1 and diameter d 1 varied as V = S . V1 thus 4 π ( d /2) 3 = S .4 π ( d 1 /2) 3 , thus in the specific instance of a perfect spherical cluster model a = 1/3. In principle, for general shapes of clusters for different packing conformations we expect 0 ≤ a ≤ 1 such that for example if clusters pack as a long, thin rod of Mig1 monomers which rotates isotropically during time Δ t , then a = 1. Whereas, if Mig1 monomers bind to a putative additional ‘anchor’ type structure to occupy available binding sites in forming a cluster, such that the size of the cluster does not significantly change with S but is dependent on the size of the putative anchor structure itself, then a = 0. Our optimized fits indicate a = 0.32 ± 0.06 (±SEM), that is consistent with an approximate spherical shape cluster model. Modeling the probability of overlap in in vitro fluorescent protein characterization The probability that two or more fluorescent protein foci are within the diffraction limit of our microscope in the in vitro characterization assays was determined using a previously reported Poisson model ( Llorente-Garcia et al., 2014 ) to be ~10% at the in vitro protein concentrations used here. Such overlapping fluorescent proteins are detected as higher apparent stoichiometry foci. PP7 RNA labelling and overlap integral Similar Slimfield microfluidics experiments were performed on Mig1-mCherry and Mig1-mCherry ΔZnf strains containing 24 transcriptional reporter PP7 markers on the GYS1 gene and transformed with plasmids for the PP7 protein labelled with 2 GFPs. Mig1 foci are present at glucose (+) and upon switching to glucose (−) PP7 foci appear in similar locations to the Mig1 foci. Although Mig1 foci are mobile, the microscopic diffusion coefficient D for immobilized Mig1 is a putative overestimate for the equivalent D of the underlying target gene loci, 0.15 µm 2 /s from CDF. The plateau of the MSD vs tau plot in Figure 3B gives an estimate of the gene loci mobility range in space (although still an overestimate) and is ~0.05 µm 2 . The square root of this is less than PSF width, and so colocalization between Mig1 and PP7 foci is expected. The extent of colocalization between Mig1-mCherry and PP7-GFP detected foci was determined by calculating the overlap integral between each pair, whose centroids were within 5 pixels of each other. Assuming two normalized, 2D Gaussian intensity distributions g1 and g2, for green and red foci respectively, centered around ( x 1 , y 1 ) with sigma width σ 1 , and around ( x 2 , y 2 ) with width σ 2 , the overlap integral ν is analytically determined as: v = e x p ( − Δ r 2 2 ( σ 1 2 + σ 2 2 ) ) Where Δ r 2 = ( x 1 2 − x 2 2 ) 2 + ( y 1 2 − y 2 2 ) 2 Previous studies have used an overlap integral of over 0.75 as a criteria for colocalization ( Llorente-Garcia et al., 2014 ).
Software and DNA sequence access
All our bespoke software developed, and Mig1 secondary structure prediction 3D coordinates pymolMig1.pdb, are freely and openly accessible via https://sourceforge.net/projects/york-biophysics/ ( Wollman, 2016 ) (copy archived at https://github.com/elifesciences-publications/york-biophysics ). The bespoke plasmid sequence information for the GFP reporter is openly accessible via https://www.addgene.org/75360/.
Statistical tests and replicates
All statistical tests used are two-sided unless stated otherwise. For Slimfield imaging each cell can be defined as a biological replicate sampled from the cell population. We chose sample sizes of at least 30 cells which generated reasonable estimates for the sampled stoichiometry distributions, similar to those of previous in vivo Slimfied studies ( Reyes-Lamothe et al., 2010 ). Technical replicates are not possible with the irreversible photobleaching assay, however, the noise in all light microscopy experiments has been independently characterized for the imaging system used previously ( Wollman and Leake, 2015 ).
Additional files 10.7554/eLife.27451.026 Transparent reporting form
📊 Figures
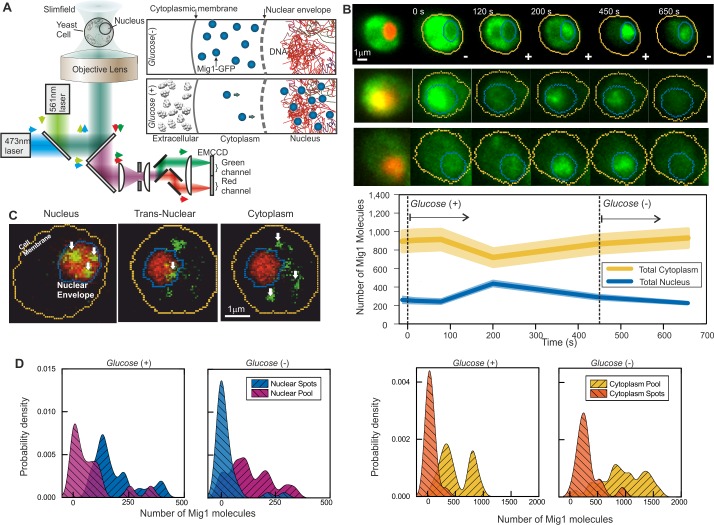
Figure 1.
Single-molecule Slimfield microscopy of live cells reveals Mig1 clusters.
( A ) Dual-color fluorescence microscopy assay. Mig1-GFP localization change (cyan, right panels) depending on glucose availability. ( B ) Example Slimfield micrographs of change of Mig1-GFP localizat...
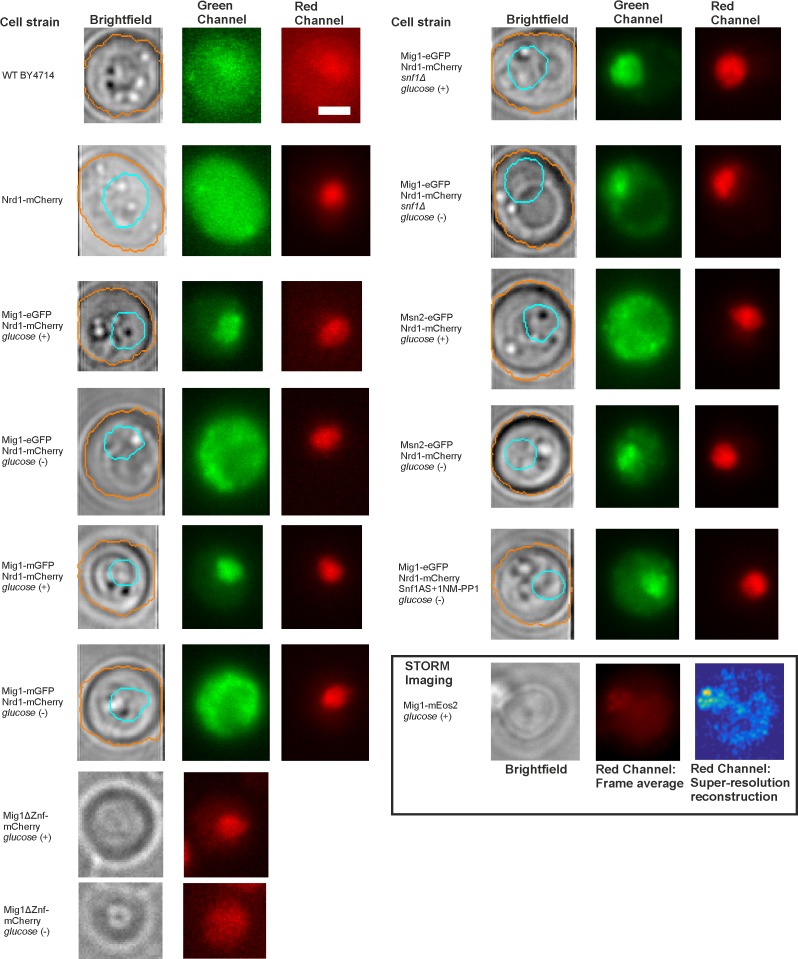
Figure 1u2014figure supplement 1.
Brightfield and fluorescence micrographs of key strains and glucose conditions.
Representative Slimfield fluorescence images obtained from the strains and different extracellular glucose conditions used in this study. Brightfield non-fluorescence images, segmentation perimeter in...
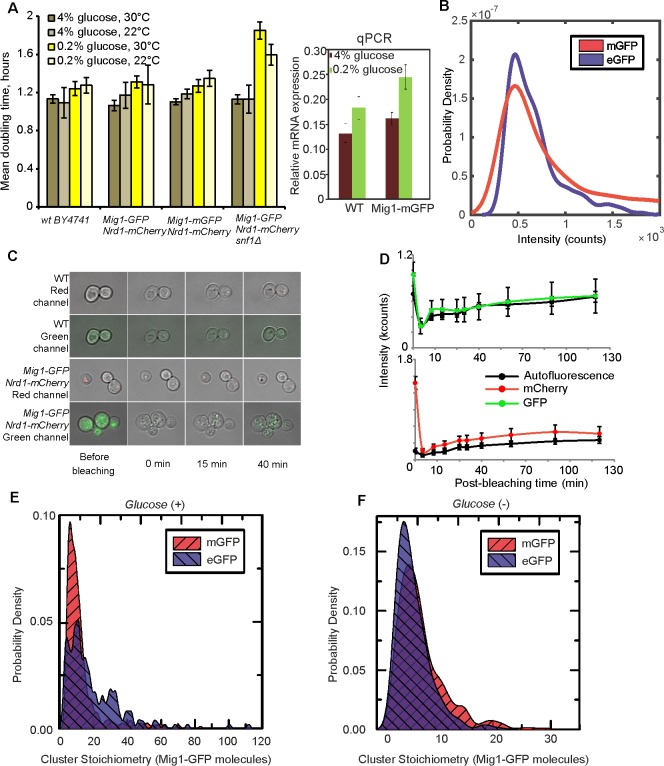
Figure 1u2014figure supplement 2.
Fluorescent reporter strains have similar viability to wild type, with relatively fast maturation of fluorescent protein, and no evidence for GFP-mediated oligomerization.
( A ) (left panel) Mean doubling timeu00a0u00b1SEM, number of cultures nu00a0=u00a06; (right panel) relative expression of MIG1 to constitutive ACT1 using qPCR in the wild type and Mig1-mGFP in cells ...
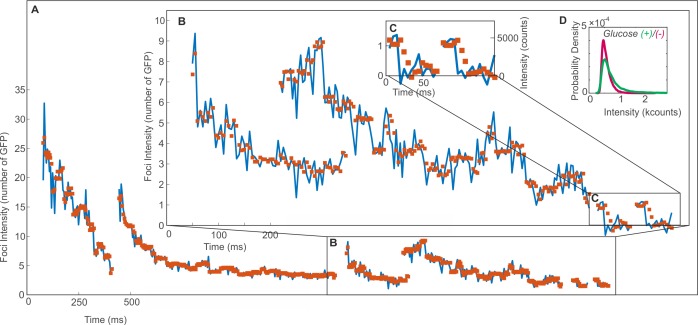
Figure 1u2014figure supplement 3.
In vivo Mig1-GFP foci intensity traces as a function of time.
Showing the raw tracked intensity (blue line) and filtered (red squares) using an edge preserving Chung-Kennedy filter ( Leake et al., 2004 ; Leake et al., 2003 ) (15 ms window) for ( A ) nuclear foci...
Video 1.
Dual-color fluorescence microscopy assay at glucose (+).
Example cell showing glucose ( + ) nuclear Mig1-GFP localization (green, distinct foci black arrows), Nrd1-mCherry (red) and segmented cell body (orange) and nuclear envelope (cyan) indicated, slowed ...
2.
Dual-color fluorescence microscopy assay at glucose (u2212).
Example cell showing glucose (u2212) Mig1-GFP localization (green, distinct foci black arrows), Nrd1-mCherry (red) and segmented cell body (orange) and nuclear envelope (cyan) indicated, slowed 200x.
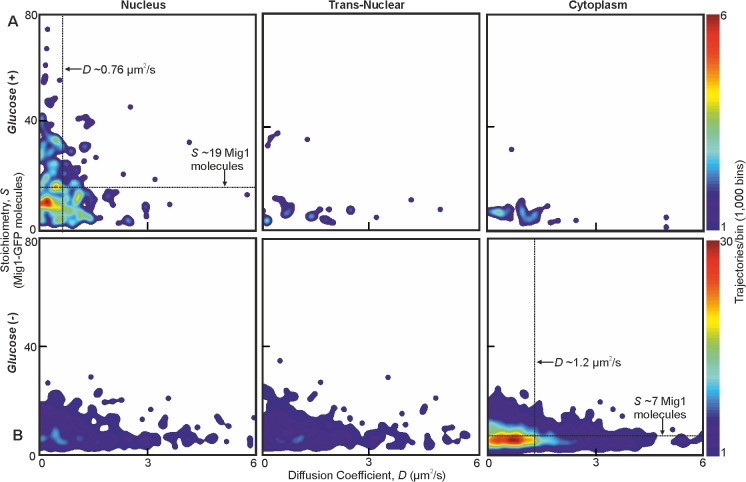
Figure 2.
Mig1 foci stoichiometry, mobility and localization depend on glucose.
Heat map showing dependence of stoichiometry of detected GFP-labeled Mig1 foci with D under ( A ) glucose (+) and ( B ) glucose (u2212) extracellular conditions. Mean values for glucose (+) nuclear an...
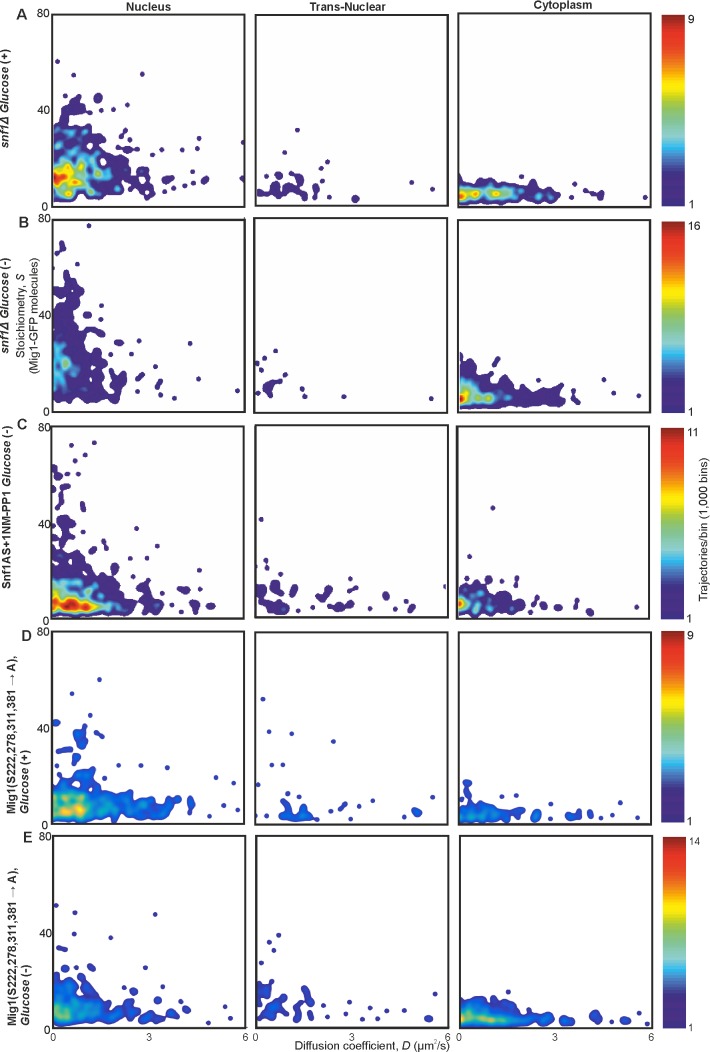
Figure 2u2014figure supplement 1.
Mig1 phosphorylation does not affect clustering but regulates localization.
Heat maps showing dependence of stoichiometry of detected GFP-labeled Mig1 foci with D in ( A,B ) SNF1 deletion strain, ( C ) strain with ATP analog sensitive variant of Snf1, Snf1-I132G, in presence ...
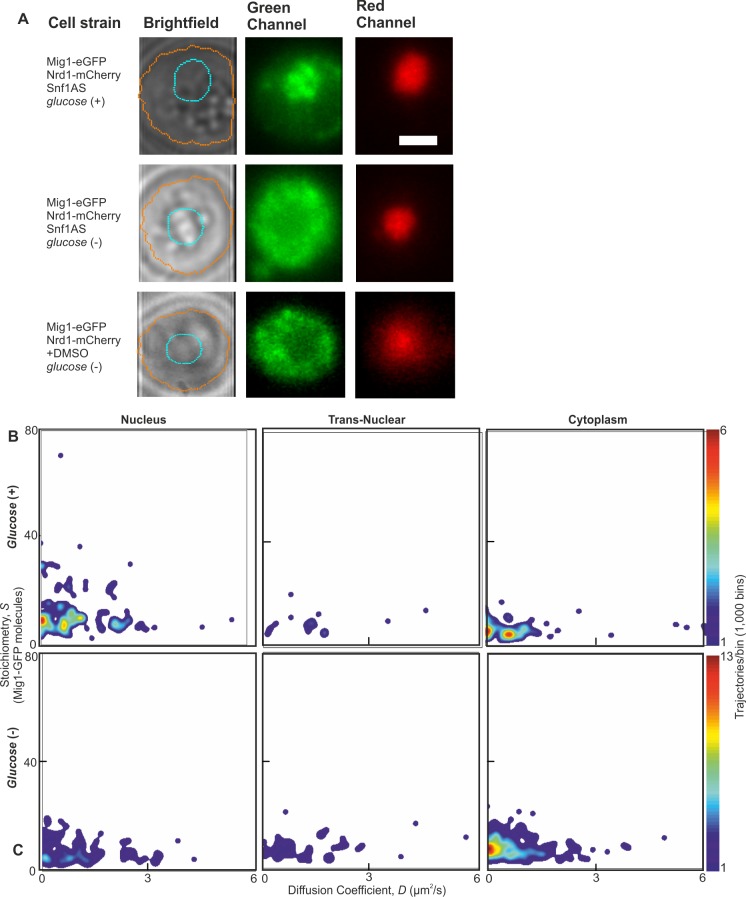
Figure 2u2014figure supplement 2.
Wild type Snf1 and analog sensitive have similar effect on Mig1.
( A ) Representative Slimfield fluorescence images showing expected Mig1 localization for a strain carrying an analog sensitive Snf1 and upon treatment with DMSO. ( B,C ) Heat maps showing dependence ...
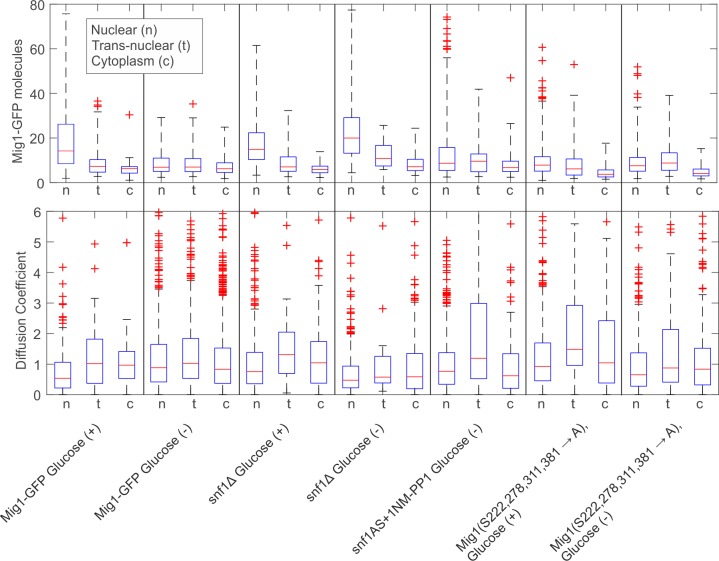
Figure 2u2014figure supplement 3.
Boxplot summary of wild type and mutant Mig1 stoichiometry and microscopic diffusion coefficient.
Boxplots for stoichiometry (top) and diffusion coefficient (bottom). Median in red, quartiles in blue. Black dotted lines mark the extrema, limited to 4x and 2x upper quartile value for stoichiometry ...
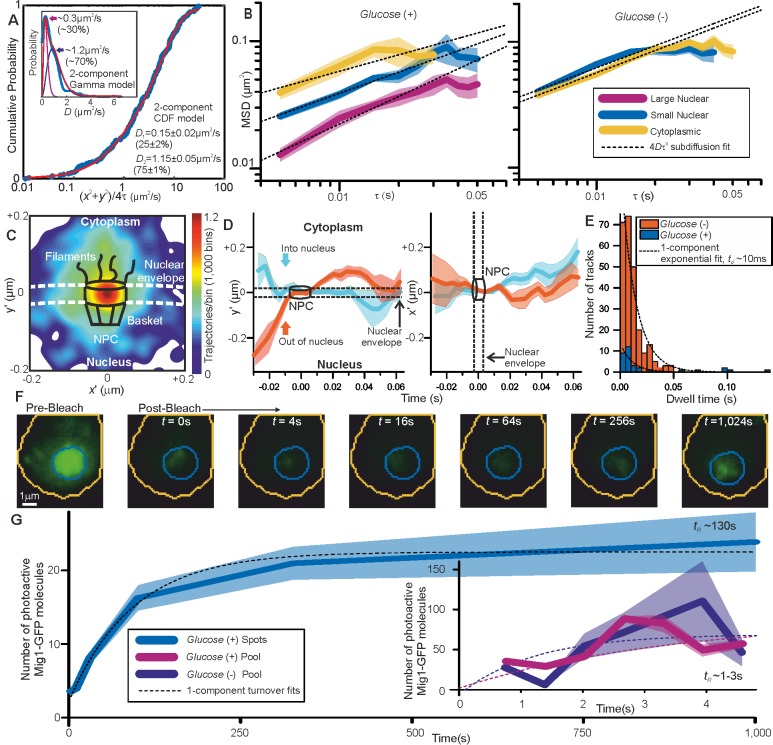
Figure 3.
Repressor clusters have heterogeneous mobility depending on localization.
( A ) Cumulative probability, glucose ( + ) nuclear tracks (blue) and two component exponential fit (red), with dual Gamma fit to D (inset) with similar parameters. ( B ) Mean MSD vs u03c4 (i.e. time ...
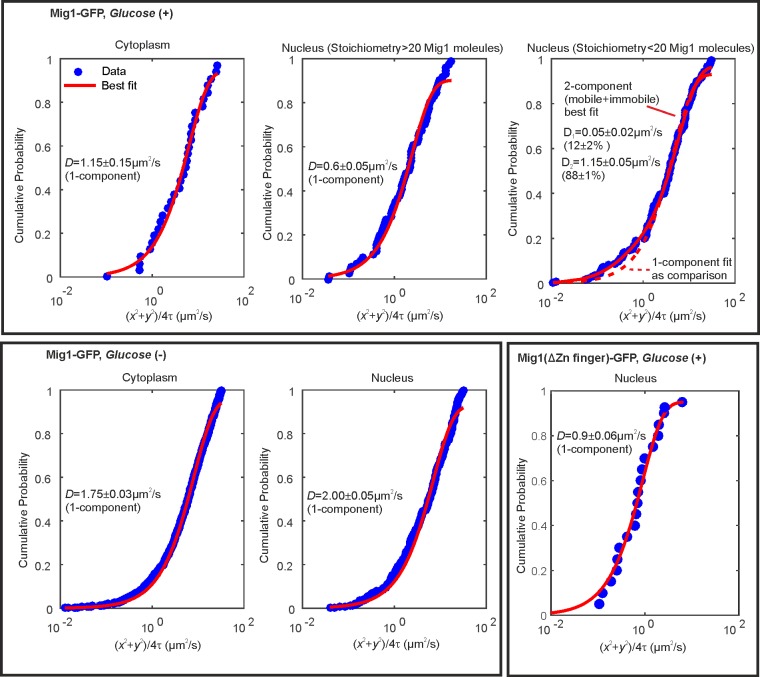
Figure 3u2014figure supplement 1.
Cumulative probability distance analysis reveals a single mobile population in the cytoplasm at glucose (+/-) and in the nucleus and glucose (u2212).
Cumulative density functions of first displacement in trajectories (blue) with appropriate fits (red). Bottom right panel indicates Mig1 mutant for which the Zn finger domain has been deleted.
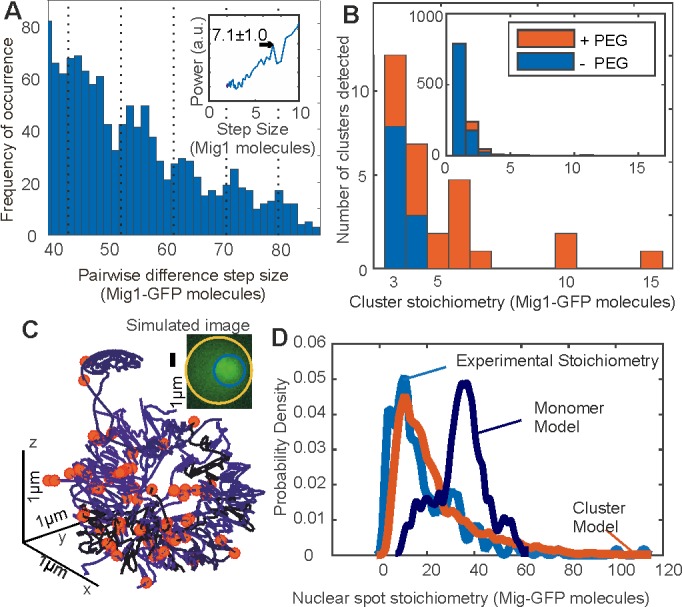
Figure 4.
Mig1 clusters are stabilized by depletion forces and bind to promoter targets.
( A ) Zoom-in on pairwise difference distribution for stoichiometry of Mig1-GFP foci, 7-mer intervals (dashed) and power spectrum (inset), mean and Gaussian sigma error (arrow). ( B ) Stoichiometry fo...
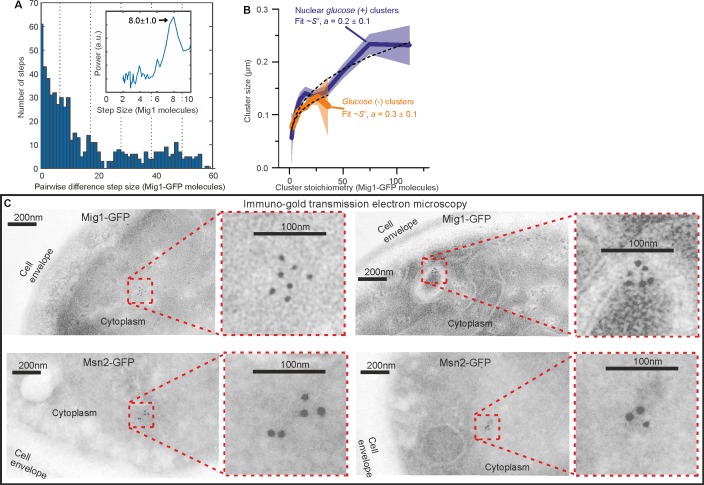
Figure 4u2014figure supplement 1.
Additional Mig1 cluster investigations.
( A ) Zoom-in on pairwise difference distribution for stoichiometry of GFP-labeled Mig1 foci detected during FRAP,u00a0~8 mer intervals (dashed lines) and power spectrum (inset) shown, mean and Gaussi...
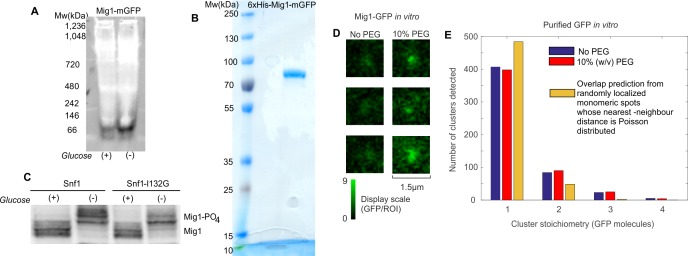
Figure 4u2014figure supplement 2.
In vitro cluster characterization.
( A ) Native PAGE of total cell protein extracts obtained from cells grown in 4% glucose (+) and 0.05% glucose (u2212) conditions followed by western blotting and probing with anti-GFP antibodies. ( B...
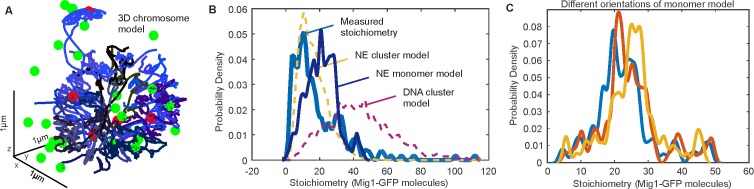
Figure 4u2014figure supplement 3.
Additional 3C modelling.
( A ) 3C model (blue) with overlaid bound Mig1 clusters to promoter binding sites from bioinformatics (red), and Mig1 clusters near the NE (green); ( B ) predicted stoichiometry distributions for GFP-...
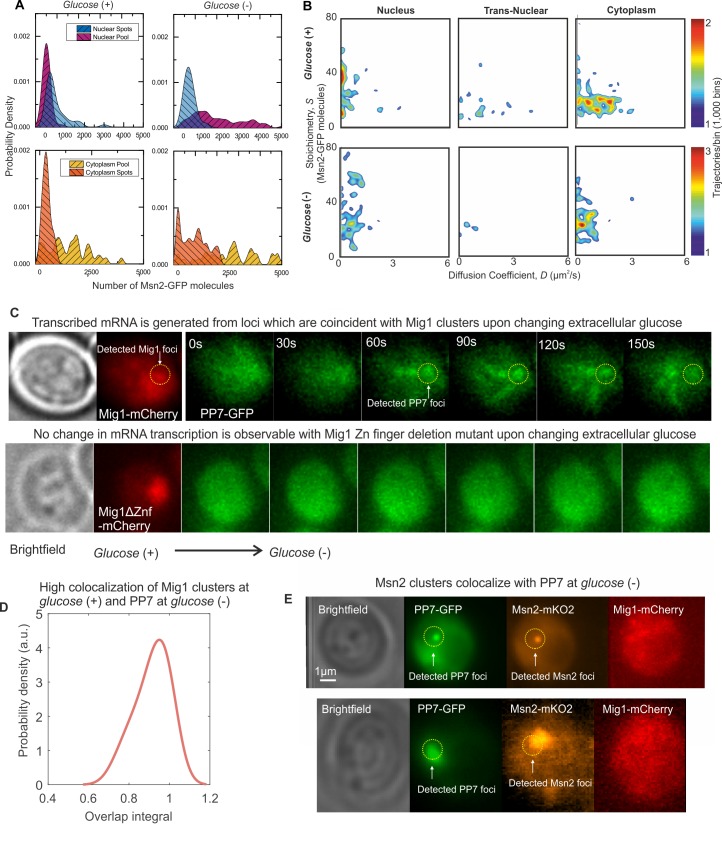
Figure 5.
Msn2 and Mig1 forms functional clusters colocalized to transcribed mRNA from their target genes.
( A ) Kernel density estimations for Msn2-GFP in pool and foci for cytoplasm and nucleus at glucose ( +/- ). ( B ) Heat maps showing dependence of stoichiometry and D of detected Msn2-GFP foci, nu00a0...
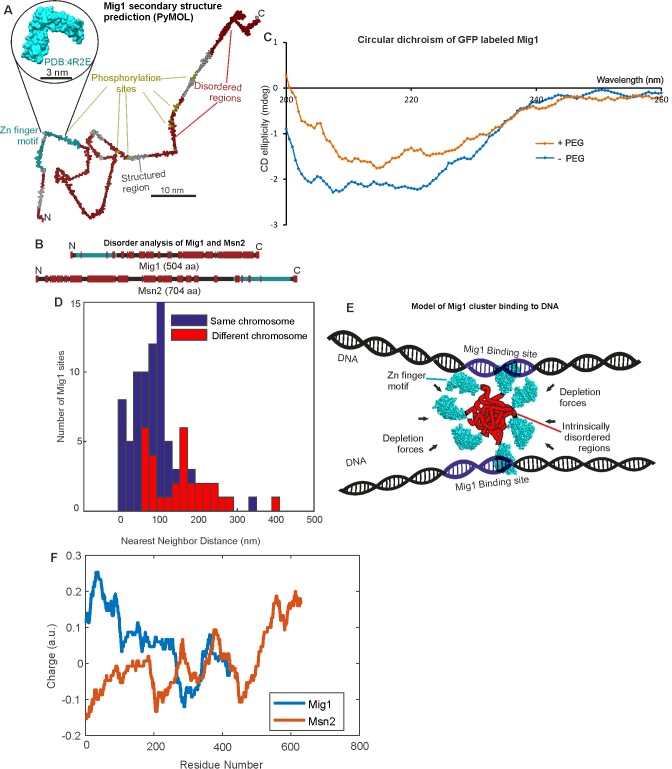
Figure 6.
Mig1 and Msn2 contain disordered sequences which may mediate cluster formation.
( A ) Structural prediction for Mig1; Zn finger motif (cyan), disordered sections (red) from PyMOL, beta sheet (gray), phosphorylation sites (yellow); zoom-in indicates structure of conserved Zn finge...
Author response image 1.
Figure images are served from the NIH/NLM PubMed Central Open Access Subset or Europe PMC; copyright remains with the publishers and authors.
💬 Discussion
0 commentsNo comments yet. Be the first to start a discussion!
Leave a Comment