Abstract
Background. Quantitative diagnostic ultrasound imaging has been proposed as a method of estimating muscle quality using measures of echogenicity. The Rectangular Marquee Tool (RMT) and the Free Hand Tool (FHT) are two types of editing features used in Photoshop and ImageJ for determining a region of interest (ROI) within an ultrasound image. The primary objective of this study is to determine the intrarater and interrater reliability of Photoshop and ImageJ for the estimate of muscle tissue echogenicity in older adults via grayscale histogram analysis. The secondary objective is to compare the mean grayscale values obtained using both the RMT and FHT methods across both image analysis platforms. Methods. This cross-sectional observational study features 18 community-dwelling men (age = 61.5 ± 2.32 years). Longitudinal views of the rectus femoris were captured using B-mode ultrasound. The ROI for each scan was selected by 2 examiners using the RMT and FHT methods from each software program. Their reliability is assessed using intraclass correlation coefficients (ICCs) and the standard error of the measurement (SEM). Measurement agreement for these values is depicted using Bland-Altman plots. A paired t-test is used to determine mean differences in echogenicity expressed as grayscale values using the RMT and FHT methods to select the post-image acquisition ROI. The degree of association among ROI selection methods and image analysis platforms is analyzed using the coefficient of determination (R (2)). Results. The raters demonstrated excellent intrarater and interrater reliability using the RMT and FHT methods across both platforms (lower bound 95% CI ICC = .97-.99, p < .001). Mean differences between the echogenicity estimates obtained with the RMT and FHT methods was .87 grayscale levels (95% CI [.54-1.21], p < .0001) using data obtained with both programs. The SEM for Photoshop was .97 and 1.05 grayscale levels when using the RMT and FHT ROI selection methods, respectively. Comparatively, the SEM values were .72 and .81 grayscale levels, respectively, when using the RMT and FHT ROI selection methods in ImageJ. Uniform coefficients of determination (R (2) = .96-.99, p < .001) indicate strong positive associations among the grayscale histogram analysis measurement conditions independent of the ROI selection methods and imaging platform. Conclusion. Our method for evaluating muscle echogenicity demonstrated a high degree of intrarater and interrater reliability using both the RMT and FHT methods across 2 common image analysis platforms. The minimal measurement error exhibited by the examiners demonstrates that the ROI selection methods used with Photoshop and ImageJ are suitable for the post-acquisition image analysis of tissue echogenicity in older adults.
🔬 Techniques
💻 Software
🧪 Sample Preparation
💻 Software Details
🏛️ Research Organizations (ROR)
Affiliated research institutions:
📋 Methods
Study design and setting
This cross-sectional observational study was conducted to determine the reliability and agreement of echogenicity measures at the rectus femoris of older male veterans at a VA Medical Center. Image acquisition was completed in a clinical environment within an outpatient unit of a Physical Medicine and Rehabilitation department. Post-image acquisition analysis was undertaken within a laboratory at the medical center.
Participants
Eighteen community-dwelling older adults were enrolled for participation in the study at the Washington DC Veterans Affairs Medical Center (DC VAMC). All of the participants were generally healthy, community-dwelling older male veterans ( n = 18, age = 61.5 ± 2.32 years; BMI: 27.6 ± 1.15). The study was approved by the DC VAMC Research and Development Institutional Review Board (IRB; #01671), and registered with Clinicaltrials.gov ( NCT02277236 ). Signed informed consent was obtained from all study participants prior to data collection. The novice examiners involved in the post-image acquisition analysis were two research associates in a laboratory associated with a Physical Medicine and Rehabilitation department with active protocols involving quantitative ultrasound. The background of these examiners included physical therapy (B.A.S.) and exercise science (C.T.). The examiners were trained over a three-month period by a clinical sonographer and a rehabilitation scientist (both with over ten years of sonography experience) regarding ultrasound image capture, sonographic artifacts, and software-aided image analysis. Deidentified sample images were analyzed with an instructor using both software programs prior to data collection. 10.7717/peerj.1721/fig-1 Figure 1 Participant positioning during ultrasound scanning procedure. The scanning site on the anterior surface of the thigh (dominant side) was located by obtaining a measurement in cm from the anterior superior iliac spine (A) and the superior pole of the patella (B). This measurement distance was bisected (C) and the midpoint of line was marked with an indelible marker. The participant was then positioned on a plinth in supine with the leg fully supported. A linear ultrasound transducer was placed at the marked scanning site (D) and the transducer was positioned to capture a longitudinal view of the rectus femoris as depicted in the figure. A sufficient amount of water-soluble transmission gel was used during scanning for optimal acoustic contact with the imaging site, and minimal pressure was applied to the sound transducer in order to limit tissue deformation.
Show full methods section
Study design and setting
This cross-sectional observational study was conducted to determine the reliability and agreement of echogenicity measures at the rectus femoris of older male veterans at a VA Medical Center. Image acquisition was completed in a clinical environment within an outpatient unit of a Physical Medicine and Rehabilitation department. Post-image acquisition analysis was undertaken within a laboratory at the medical center.
Participants
Eighteen community-dwelling older adults were enrolled for participation in the study at the Washington DC Veterans Affairs Medical Center (DC VAMC). All of the participants were generally healthy, community-dwelling older male veterans ( n = 18, age = 61.5 ± 2.32 years; BMI: 27.6 ± 1.15). The study was approved by the DC VAMC Research and Development Institutional Review Board (IRB; #01671), and registered with Clinicaltrials.gov ( NCT02277236 ). Signed informed consent was obtained from all study participants prior to data collection. The novice examiners involved in the post-image acquisition analysis were two research associates in a laboratory associated with a Physical Medicine and Rehabilitation department with active protocols involving quantitative ultrasound. The background of these examiners included physical therapy (B.A.S.) and exercise science (C.T.). The examiners were trained over a three-month period by a clinical sonographer and a rehabilitation scientist (both with over ten years of sonography experience) regarding ultrasound image capture, sonographic artifacts, and software-aided image analysis. Deidentified sample images were analyzed with an instructor using both software programs prior to data collection. 10.7717/peerj.1721/fig-1 Figure 1 Participant positioning during ultrasound scanning procedure. The scanning site on the anterior surface of the thigh (dominant side) was located by obtaining a measurement in cm from the anterior superior iliac spine (A) and the superior pole of the patella (B). This measurement distance was bisected (C) and the midpoint of line was marked with an indelible marker. The participant was then positioned on a plinth in supine with the leg fully supported. A linear ultrasound transducer was placed at the marked scanning site (D) and the transducer was positioned to capture a longitudinal view of the rectus femoris as depicted in the figure. A sufficient amount of water-soluble transmission gel was used during scanning for optimal acoustic contact with the imaging site, and minimal pressure was applied to the sound transducer in order to limit tissue deformation.
Procedures
Quantitative ultrasound scanning and image capture were completed using a diagnostic sonography machine (SonoSite M-Turbo 1.1.2; SonoSite, Inc., Bothell, WA, USA) with a 13.6 MHz linear array transducer and B-mode scanning. The ultrasound machine was operated using its default gain levels and compression was governed by the factory presets (i.e., the “resolution” setting in the “musculoskeletal” scanning preset). The scanning site on the anterior surface of the thigh (dominant side) was located by bisecting the distance in cm between the anterior superior iliac spine and the superior pole of the patella, and then marked with an indelible marker ( Fig. 1 ). This approach facilitated the consistent image capture of the rectus femoris within the field of view and has been used in previous studies ( Ismail et al., 2015 ; Hernandez et al., 2015 ). Longitudinal view image capture was completed with the participant lying supine on a plinth and positioning the ultrasound transducer to be oriented 90° to the muscle bundles. A sufficient amount of water-soluble transmission gel was used during scanning for optimal acoustic contact with the imaging site, and minimal pressure was applied to the transducer in order to limit tissue deformation. Scanning was completed by a separate examiner from the laboratory with at least one year of quantitative ultrasound experience. The examiner responsible for scanning is part of a laboratory that has demonstrated strong interrater measurement consistency, exhibiting a coefficient of variation of ≤2.9% for morphometry using a calibration phantom, and high interrater reliability (ICC 2, k = .992, p < .001) for the assessment of echogenicity at the rectus femoris via grayscale histogram analysis ( Harris-Love et al., 2015 ). The two examiners responsible for post-image acquisition analysis independently measured the echogenicity of the rectus femoris in the longitudinal view. Mean grayscale values were obtained for each scan using two image editing programs: Photoshop (version 6.0) and ImageJ (version 1.48). Each examiner selected the ROI for each scan using the Rectangular Marquee Tool (RMT) and the Free Hand Tool (FHT). The measurement procedure included obtaining the ROI within the superior and inferior fascial borders of the muscle and the lateral borders of the muscle defined by the field of view, as adapted from Pillen and associates ( 2003 ). In select instances when a portion of a fascial border was poorly visualized, the examiner used the trajectory of the visible fascial border to complete the ROI selection. Additionally, the geometric configuration of the RMT ROI was not expected to perfectly conform to the fascial planes of the rectus femoris. Therefore, the examiners were instructed to maximize the congruency between the selected ROI using the RMT and the superior and inferior fascial borders of the muscle ( Fig. 2 ). All intrasession grayscale measures were completed twice and the mean value was used for the data analysis. The assessment order for each image was separately randomized for each examiner to minimize measurement bias (VassarStats random number generator) ( Lowry, 2004 ), and the assessment sessions were separated by one week to minimize the effects of recall on the selection of the ROI. Masking was employed regarding the initial measurement values, and no information concerning the results of the grayscale histogram analysis was shared between the examiners during the data collection period. 10.7717/peerj.1721/fig-2 Figure 2 Image analysis ROI selections and the corresponding grayscale histogram values. The exemplar longitudinal images of the rectus femoris feature an overlay graphic of the ROI selection using the Rectangular Marquee Tool (A) and Free Hand Tool (B) provided by the ImageJ software. The corresponding grayscale histogram analysis data for each sonographic image shows similar estimates of rectus femoris echogenicity using both ROI selection methods. (ROI, region of interest. Post-analysis image enhancement used only to emphasize the ROI selection borders in the figure.)
Data analysis
All data and variance distributions are normal based on the Shapiro–Wilk and Levene’s tests, and conveyed as means and standard deviations. Echogenicity levels are expressed as grayscale values (0–255, unitless values). The relative reliability of the examiners for the grayscale histogram analysis is estimated using intraclass correlation coefficients (ICC). The ICC 2, k is used to determine the interrater reliability using a 2-way mixed model absolute agreement approach, and the ICC 3, k is used to determine the intrarater reliability using a 2-way random model consistency approach ( Portney & Watkins, 2009 ). Portney & Watkins (2009) report that clinical measurements should attain a coefficient of ≥.75 for adequate reliability, although some assessments may need to exceed this standard depending on the application. Munro (2001) has stated that statistical estimates based on non-random sampling may compromise inferences from a given data set. Therefore, we will examine the lower bound point estimate of the reliability coefficients featured in this report (i.e., 95% CI of the ICCs) to account for the inherent uncertainty associated with samples of convenience ( Eliasziw et al., 1994 ). The Portney & Watkins (2009) criteria is used to interpret the ICC findings: 00–.49 = poor reliability, .50–.74 = moderate reliability, and .75–1.00 = excellent reliability. The standard error of the measurement (SEM) is calculated to provide an estimate of absolute reliability of the examiners’ grayscale histogram analysis (within the given scale of measurement). Measurement agreement for these values is depicted visually using the 95% limits of agreement method as suggested by Bland and Altman ( Giavarina, 2015 ). The paired t -test is used to determine mean differences in echogenicity expressed as grayscale values using the RMT and FHT methods to select the post-image acquisition ROI. The degree of association among ROI selection methods and image analysis platforms is displayed visually as a scatter plot and analyzed using the coefficient of determination ( R 2 ). Statistical analyses were performed using PASW Statistics for Windows, Version 18.0 (SPSS Inc., Chicago, IL, USA). The α level was set at .05, and two-tailed p values < .05 were considered significant for all inferential statistics.
Procedures
Quantitative ultrasound scanning and image capture were completed using a diagnostic sonography machine (SonoSite M-Turbo 1.1.2; SonoSite, Inc., Bothell, WA, USA) with a 13.6 MHz linear array transducer and B-mode scanning. The ultrasound machine was operated using its default gain levels and compression was governed by the factory presets (i.e., the “resolution” setting in the “musculoskeletal” scanning preset). The scanning site on the anterior surface of the thigh (dominant side) was located by bisecting the distance in cm between the anterior superior iliac spine and the superior pole of the patella, and then marked with an indelible marker ( Fig. 1 ). This approach facilitated the consistent image capture of the rectus femoris within the field of view and has been used in previous studies ( Ismail et al., 2015 ; Hernandez et al., 2015 ). Longitudinal view image capture was completed with the participant lying supine on a plinth and positioning the ultrasound transducer to be oriented 90° to the muscle bundles. A sufficient amount of water-soluble transmission gel was used during scanning for optimal acoustic contact with the imaging site, and minimal pressure was applied to the transducer in order to limit tissue deformation. Scanning was completed by a separate examiner from the laboratory with at least one year of quantitative ultrasound experience. The examiner responsible for scanning is part of a laboratory that has demonstrated strong interrater measurement consistency, exhibiting a coefficient of variation of ≤2.9% for morphometry using a calibration phantom, and high interrater reliability (ICC 2, k = .992, p < .001) for the assessment of echogenicity at the rectus femoris via grayscale histogram analysis ( Harris-Love et al., 2015 ). The two examiners responsible for post-image acquisition analysis independently measured the echogenicity of the rectus femoris in the longitudinal view. Mean grayscale values were obtained for each scan using two image editing programs: Photoshop (version 6.0) and ImageJ (version 1.48). Each examiner selected the ROI for each scan using the Rectangular Marquee Tool (RMT) and the Free Hand Tool (FHT). The measurement procedure included obtaining the ROI within the superior and inferior fascial borders of the muscle and the lateral borders of the muscle defined by the field of view, as adapted from Pillen and associates ( 2003 ). In select instances when a portion of a fascial border was poorly visualized, the examiner used the trajectory of the visible fascial border to complete the ROI selection. Additionally, the geometric configuration of the RMT ROI was not expected to perfectly conform to the fascial planes of the rectus femoris. Therefore, the examiners were instructed to maximize the congruency between the selected ROI using the RMT and the superior and inferior fascial borders of the muscle ( Fig. 2 ). All intrasession grayscale measures were completed twice and the mean value was used for the data analysis. The assessment order for each image was separately randomized for each examiner to minimize measurement bias (VassarStats random number generator) ( Lowry, 2004 ), and the assessment sessions were separated by one week to minimize the effects of recall on the selection of the ROI. Masking was employed regarding the initial measurement values, and no information concerning the results of the grayscale histogram analysis was shared between the examiners during the data collection period. 10.7717/peerj.1721/fig-2 Figure 2 Image analysis ROI selections and the corresponding grayscale histogram values. The exemplar longitudinal images of the rectus femoris feature an overlay graphic of the ROI selection using the Rectangular Marquee Tool (A) and Free Hand Tool (B) provided by the ImageJ software. The corresponding grayscale histogram analysis data for each sonographic image shows similar estimates of rectus femoris echogenicity using both ROI selection methods. (ROI, region of interest. Post-analysis image enhancement used only to emphasize the ROI selection borders in the figure.)
Examiner agreement based on ROI selection method and image analysis platform The Bland-Altman plots in Fig. 3 depict the agreement between the grayscale measurements across the two image analysis platforms for Examiner 1. The limits of agreement for grayscale measures obtained using the FHT method for ROI selection were wider than comparable measures obtained using the RMT method. The mean difference between the echogenicity estimates obtained with the RMT and FHT methods was .87 grayscale levels (95% CI [.54–1.21]; p < .0001) using data obtained with both Photoshop and ImageJ. 10.7717/peerj.1721/fig-3 Figure 3 Intrarater Bland-Altman plots across image processing platforms. Bland-Altman plots for agreement between grayscale analysis measures for the rectus femoris muscle using Photoshop and ImageJ are shown. The mean of two measures obtained from both image processing platforms, as assessed by Examiner 1, is depicted on the x -axis. The difference between the means of these measures are depicted on the y -axis. The mean difference and limits of agreement (1.96 ⋅ standard deviation) are represented by the horizontal lines parallel to the x -axis. (RMT, Rectangular Marquee Tool; FHT, Free Hand Tool; diff., difference; grayscale level range = 0–255.) The Bland-Altman plots in Fig. 4 show the agreement between the grayscale measurements for both examiners using each ROI selection method during image analysis in Photoshop or ImageJ. The observed limits of agreement were wider for both the RMT and FHT ROI selection method when using Photoshop in comparison to ImageJ. Considering the data from both examiners, the mean difference between the echogenicity estimates obtained with the RMT method in Photoshop versus ImageJ was .44 grayscale levels (95% CI [.06–.82]; p < .03). In comparison, the mean difference between the echogenicity estimates obtained with the FHT method in Photoshop versus ImageJ was .66 grayscale levels (95% CI [.21–1.10]; p < .001). Visual analysis of the Bland-Altman plots in Figs. 3 and 4 reveal that ≤ 2 measurements were outside the limits of agreement, and no systematic errors were observed. In addition, the matrix scatter plots ( Fig. 5 ) depict uniform coefficients of determination ( R 2 = .96 to .99, p < .001) that indicate strong positive associations among the grayscale histogram analysis measurement conditions independent of the ROI selection methods and imaging platform. 10.7717/peerj.1721/fig-4 Figure 4 Interrater Bland-Altman plots for two examiners. The Bland-Altman plots depict the agreement between two novice examiners obtaining the grayscale analysis measures for the rectus femoris muscle. Plots are provided showing the observed measurement agreement using both of the image processing platforms, and ROI selection methods. The mean of the measures obtained from both examiners is depicted on the x -axis. The difference between the means of these measures are depicted on the y -axis. The mean difference and limits of agreement (1.96 ⋅ standard deviation) are represented by the horizontal lines parallel to the x -axis. (ROI, region of interest; PS, Photoshop; IJ, ImageJ; RMT, Rectangular Marquee Tool; FHT, Free Hand Tool; diff., difference; grayscale level range = 0–255.) 10.7717/peerj.1721/fig-5 Figure 5 Matrix scatter plots across both image processing platforms and ROI selection methods. The matrix scatter plots show the relationships among the grayscale values obtained by Examiner 1 using both of the image processing platforms and ROI selection methods. The coefficient of determination ( R 2 ) values for all linear regression analyses within the matrix were .96–.99 ( p < .001). Specific matrix combinations such as RMT PS × RMT IJ and FHT PS × FHT IJ suggest that similar ROI selection methods were highly associated across imaging platforms. Also, matrix combinations such as RMT PS x FHT PS and RMT IJ × FHT IJ indicate that differing ROI selection methods using Photoshop or ImageJ yield significant positive relationships. (ROI, region of interest; PS, Photoshop; IJ, ImageJ; RMT, Rectangular Marquee Tool; FHT, Free Hand Tool.)
Supplemental Information 10.7717/peerj.1721/supp-1 Supplemental Information 1 Flowchart of the study Click here for additional data file.
📊 Figures
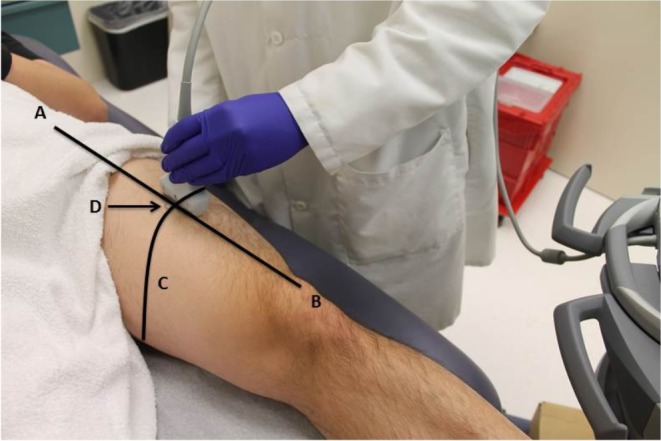
Figure 1
Participant positioning during ultrasound scanning procedure.
The scanning site on the anterior surface of the thigh (dominant side) was located by obtaining a measurement in cm from the anterior superior iliac spine (A) and the superior pole of the patella (B)....
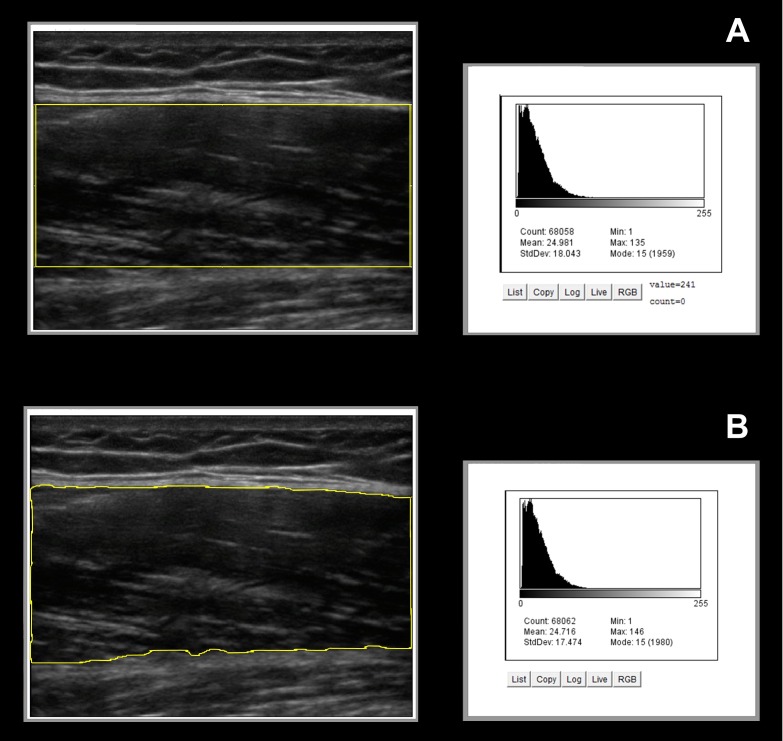
Figure 2
Image analysis ROI selections and the corresponding grayscale histogram values.
The exemplar longitudinal images of the rectus femoris feature an overlay graphic of the ROI selection using the Rectangular Marquee Tool (A) and Free Hand Tool (B) provided by the ImageJ software. Th...
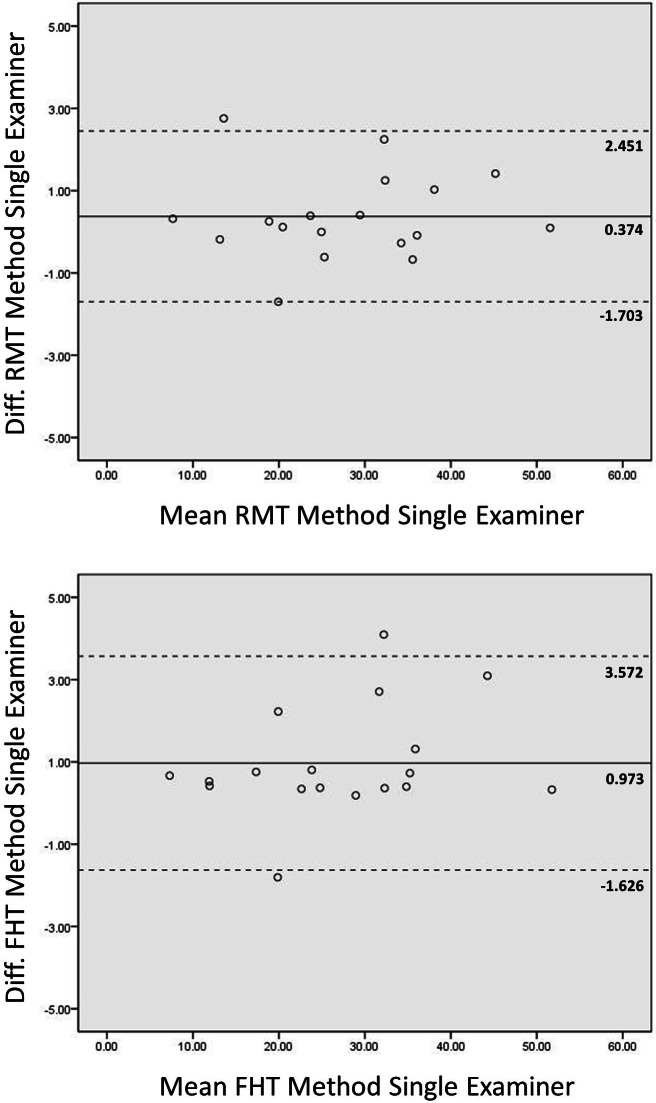
Figure 3
Intrarater Bland-Altman plots across image processing platforms.
Bland-Altman plots for agreement between grayscale analysis measures for the rectus femoris muscle using Photoshop and ImageJ are shown. The mean of two measures obtained from both image processing pl...
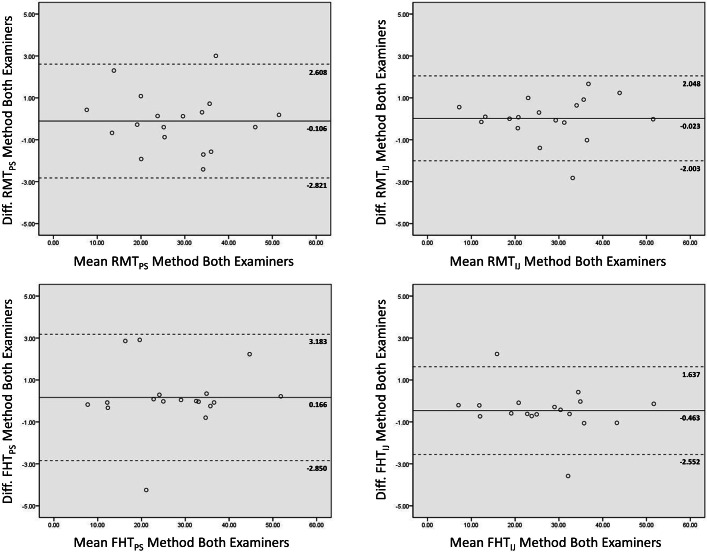
Figure 4
Interrater Bland-Altman plots for two examiners.
The Bland-Altman plots depict the agreement between two novice examiners obtaining the grayscale analysis measures for the rectus femoris muscle. Plots are provided showing the observed measurement ag...
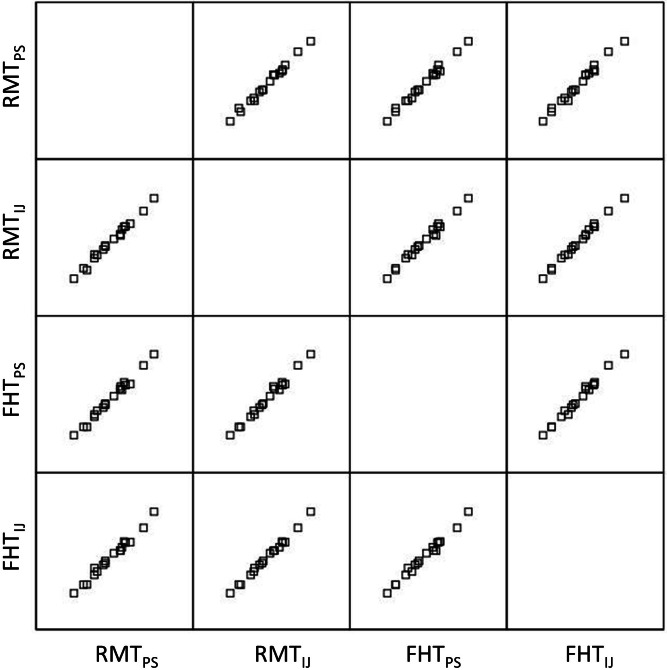
Figure 5
Matrix scatter plots across both image processing platforms and ROI selection methods.
The matrix scatter plots show the relationships among the grayscale values obtained by Examiner 1 using both of the image processing platforms and ROI selection methods. The coefficient of determinati...
Figure images are served from the NIH/NLM PubMed Central Open Access Subset or Europe PMC; copyright remains with the publishers and authors.
💬 Discussion
0 commentsNo comments yet. Be the first to start a discussion!
Leave a Comment