Abstract
The hyperpolarization-activated cyclic nucleotide-gated (HCN) channel is a voltage-gated cation channel that mediates neuronal and cardiac pacemaker activity. The HCN channel exhibits reversed voltage dependence, meaning it closes with depolarization and opens with hyperpolarization. Different from Na+, Ca2+, and Kv1-Kv7 channels, the HCN channel does not have domain-swapped voltage sensors. We introduced a reversible, metal-mediated cross bridge into the voltage sensors to create the chemical equivalent of a hyperpolarized conformation and determined the structure using cryoelectron microscopy (cryo-EM). Unlike the depolarized HCN channel, the S4 helix is displaced toward the cytoplasm by two helical turns. Near the cytoplasm, the S4 helix breaks into two helices, one running parallel to the membrane surface, analogous to the S4-S5 linker of domain-swapped voltage-gated channels. These findings suggest a basis for allosteric communication between voltage sensors and the gate in this kind of channel. They also imply that voltage sensor movements are not the same in all voltage-gated channels.
🔬 Techniques
✨ Fluorophores
🧪 Sample Preparation
🏭 Microscope Brands
🧪 Reagent Suppliers
💻 Software Details
💾 Data Repositories
🏛️ Research Organizations (ROR)
Affiliated research institutions:
📋 Methods
LEAD CONTACT AND MATERIALS AVAILABILITY
Further information and requests for reagents should be directed to the lead contact Roderick MacKinnon ( mackinn@rockefeller.edu ). All unique/stable reagents generated in this study are available from the lead contact with a completed Material Transfer Agreement.
EXPERIMENTAL MODEL AND SUBJECT DETAILS Cell lines Chinese hamster ovary
(CHO)-K1 cells were cultured in DMEM/F-12 medium supplemented with 10% fetal bovine serum. Sf9 cells were cultured in Sf-900 II SFM medium (Gibco) at 28 °C. HEK293S GnTI − cells were cultured in Freestyle 293 medium supplemented with 2% fetal bovine serum at 37 °C.
METHOD DETAILS Electrophysiological recording
CHO-K1 cultured in 35 mm petri dishes were transiently transfected with 2 μg HCN1 EM DNA plasmid using Lipofectamine 3000 according to the manufacturer’s instructions. After 48–96 h, the medium was replaced with the bath solution (55 mM KCl, 100 mM NaCl, 1 mM CaCl2, 10 mM glucose, and 10 mM HEPES pH 7.4; 310 mOsm). When indicated, 100 μM Cd 2+ was added into the bath solution. For whole-cell recording, polished borosilicate micropipettes (resistance of 2–5 MΩ) were filled with the pipette solution (85 mM KCl, 70 mM KF, 5 mM EGTA, and 10 mM HEPES pH 7.2; 297 mOsm), and the recordings were obtained at room temperature (~23 °C) using an Axopatch 200B amplifier, a Digidata 1550 digitizer and pCLAMP. The recordings were low-pass filtered at 1 kHz and sampled at 20 kHz. The average current amplitude of HCN F186C/S264C is similar to the wild type channel. Protein Expression and purification HCN1 EM mutants were expressed in HEK293S GnTI − cells ( Goehring et al., 2014 ). Cells in suspension were grown at 37 °C to a density of ~3 × 10 6 cells/ml and then baculoviruses carrying HCN genes were added to initiate the transduction. After 10 h, 10 mM sodium butyrate was added to cells and the culture temperature was shifted to 30 °C. Cells were harvested at 58 h post-transduction. HCN mutants express to similar extents as the wild type does ( Figure S1B ). Protein purification was performed at 4 °C. The infected cell pellet from 1 L culture was resuspended in 200 ml hypotonic lysis buffer (20 mM KCl, 0.5 mM MgCl 2 , 5 μM cAMP, 0.1 mg/ml DNase, 10 mM Tris pH 8 and protease inhibitors) for 25 min, and the lysate was spun at 39800 × g for 35 min to sediment crude membranes. The membrane pellet was mechanically homogenized and solubilized in the extraction buffer (10 mM lauryl maltose neopentyl glycol, 2 mM cholesteryl hemisuccinate, 300 mM KCl, 5 μM cAMP, 20 mM Tris pH 8 and protease inhibitors) for 1.5 h. Solubilized membranes were clarified by centrifugation at 39800 × g for 55 min. The supernatant was applied to the GFP nanobody-coupled Sepharose resin (Kirchhofer et al., 2010), which was subsequently washed with 10 column volumes of the wash buffer (0.05 % digitonin, 300 mM KCl, 5 μM cAMP, 20 mM Tris pH 8 and protease inhibitors). The washed resin was incubated overnight with human rhinovirus 3C protease at a target protein to protease ratio of 40:1 (w/w) to cleave off GFP. The protein was eluted with the wash buffer, concentrated and purified through gel-filtration chromatography in the SEC buffer (0.05 % digitonin, 150 mM KCl, 5 μM cAMP and 20 mM Tris pH 8). Peak fractions were pooled and concentrated to 5–6 mg/ml. Prior to EM grid preparation, 5 mM cAMP was spiked to the protein sample. For HCN F186C/S264C sample, 200 μM HgCl 2 was also added at this stage.
Show full methods section
LEAD CONTACT AND MATERIALS AVAILABILITY
Further information and requests for reagents should be directed to the lead contact Roderick MacKinnon ( mackinn@rockefeller.edu ). All unique/stable reagents generated in this study are available from the lead contact with a completed Material Transfer Agreement.
EXPERIMENTAL MODEL AND SUBJECT DETAILS Cell lines Chinese hamster ovary
(CHO)-K1 cells were cultured in DMEM/F-12 medium supplemented with 10% fetal bovine serum. Sf9 cells were cultured in Sf-900 II SFM medium (Gibco) at 28 °C. HEK293S GnTI − cells were cultured in Freestyle 293 medium supplemented with 2% fetal bovine serum at 37 °C.
METHOD DETAILS Electrophysiological recording
CHO-K1 cultured in 35 mm petri dishes were transiently transfected with 2 μg HCN1 EM DNA plasmid using Lipofectamine 3000 according to the manufacturer’s instructions. After 48–96 h, the medium was replaced with the bath solution (55 mM KCl, 100 mM NaCl, 1 mM CaCl2, 10 mM glucose, and 10 mM HEPES pH 7.4; 310 mOsm). When indicated, 100 μM Cd 2+ was added into the bath solution. For whole-cell recording, polished borosilicate micropipettes (resistance of 2–5 MΩ) were filled with the pipette solution (85 mM KCl, 70 mM KF, 5 mM EGTA, and 10 mM HEPES pH 7.2; 297 mOsm), and the recordings were obtained at room temperature (~23 °C) using an Axopatch 200B amplifier, a Digidata 1550 digitizer and pCLAMP. The recordings were low-pass filtered at 1 kHz and sampled at 20 kHz. The average current amplitude of HCN F186C/S264C is similar to the wild type channel. Protein Expression and purification HCN1 EM mutants were expressed in HEK293S GnTI − cells ( Goehring et al., 2014 ). Cells in suspension were grown at 37 °C to a density of ~3 × 10 6 cells/ml and then baculoviruses carrying HCN genes were added to initiate the transduction. After 10 h, 10 mM sodium butyrate was added to cells and the culture temperature was shifted to 30 °C. Cells were harvested at 58 h post-transduction. HCN mutants express to similar extents as the wild type does ( Figure S1B ). Protein purification was performed at 4 °C. The infected cell pellet from 1 L culture was resuspended in 200 ml hypotonic lysis buffer (20 mM KCl, 0.5 mM MgCl 2 , 5 μM cAMP, 0.1 mg/ml DNase, 10 mM Tris pH 8 and protease inhibitors) for 25 min, and the lysate was spun at 39800 × g for 35 min to sediment crude membranes. The membrane pellet was mechanically homogenized and solubilized in the extraction buffer (10 mM lauryl maltose neopentyl glycol, 2 mM cholesteryl hemisuccinate, 300 mM KCl, 5 μM cAMP, 20 mM Tris pH 8 and protease inhibitors) for 1.5 h. Solubilized membranes were clarified by centrifugation at 39800 × g for 55 min. The supernatant was applied to the GFP nanobody-coupled Sepharose resin (Kirchhofer et al., 2010), which was subsequently washed with 10 column volumes of the wash buffer (0.05 % digitonin, 300 mM KCl, 5 μM cAMP, 20 mM Tris pH 8 and protease inhibitors). The washed resin was incubated overnight with human rhinovirus 3C protease at a target protein to protease ratio of 40:1 (w/w) to cleave off GFP. The protein was eluted with the wash buffer, concentrated and purified through gel-filtration chromatography in the SEC buffer (0.05 % digitonin, 150 mM KCl, 5 μM cAMP and 20 mM Tris pH 8). Peak fractions were pooled and concentrated to 5–6 mg/ml. Prior to EM grid preparation, 5 mM cAMP was spiked to the protein sample. For HCN F186C/S264C sample, 200 μM HgCl 2 was also added at this stage.
EM data acquisition
Aliquots of 3.5 μl purified HCN sample were applied to glow-discharged Quantifoil R1.2/1.3 400 mesh Au grids. After 15 s, the grids were blotted for 1.5 s and plunged into liquid ethane using a Vitrobot Mark IV (FEI) operated at 16 °C and 100% humidity. The grids were loaded onto a 300 kV Titan Krios transmission electron microscope with the K2 Summit detector. Micrographs were recorded in super-resolution mode using SerialEM ( Mastronarde, 2005 ). Images have a physical pixel size of 1.03 Å (super-resolution pixel size of 0.515 Å) and a nominal defocus range of 1.2 to 2.3 μm. A dose rate of 8 electrons per pixel per second was used. The exposure time for each image was 10 s, with 0.2 s per frame. This gave a total cumulative dose of ~75 electrons per Å 2 (1.51 electrons per Å 2 per frame).
Image processing
Super-resolution image stacks were gain-normalized, binned by 2, and corrected for beam-induced motion using MotionCor2 ( Zheng et al., 2017 ). Contrast transfer function parameters were estimated from motion-corrected summed images without dose-weighting using GCTF ( Zhang, 2016 ). All subsequent processing was performed on motion-corrected summed images with dose-weighting. Particles were picked using Gautomatch (written by Kai Zhang). 2D and 3D classification were performed in RELION 3.0 ( Scheres, 2012 ). The major classes of particles were refined and subjected to Bayesian particle polishing in RELION ( Zivanov et al., 2019 ), followed by a final round of refinement using cryoSPARC2 ( Punjani et al., 2017 ). The mask-corrected FSC curves were calculated in cryoSPARC2 and reported resolutions were based on the FSC = 0.143 criterion ( Scheres and Chen, 2012 ). Local resolutions of density maps were estimated by Blocres ( Cardone et al., 2013 ). Model building An initial model was obtained by docking the cAMP-bound HCN1 EM structure (PDB code: 5U6P) into the density map using Chimera ( Pettersen et al., 2004 ). The models were then refined iterative iteratively in Coot ( Emsley et al., 2010 ) and Phenix ( Afonine et al., 2018 ). The quality of final models was evaluated by MolProbity ( Chen et al., 2010 ). The S4 helix geometry was analyzed using HELANAL-Plus ( Kumar and Bansal, 2012 ). Figures were prepared using PyMOL ( Schrödinger LLC, 2017 ) and Chimera. DATA AND CODE AVAILABILITY Data Resources Cryo-EM density maps of the cross-linked HCN1 F186C/S264C and HCN1 Y289D have been deposited in the electron microscopy data bank under accession code EMD-20846 and 20847, respectively. Atomic coordinates of the cross-linked HCN1 F186C/S264C and HCN1 Y289D have been deposited in the protein data bank under accession code 6UQF and 6UQG, respectively.
LEAD CONTACT AND MATERIALS AVAILABILITY
Further information and requests for reagents should be directed to the lead contact Roderick MacKinnon ( mackinn@rockefeller.edu ). All unique/stable reagents generated in this study are available from the lead contact with a completed Material Transfer Agreement.
EXPERIMENTAL MODEL AND SUBJECT DETAILS Cell lines Chinese hamster ovary
(CHO)-K1 cells were cultured in DMEM/F-12 medium supplemented with 10% fetal bovine serum. Sf9 cells were cultured in Sf-900 II SFM medium (Gibco) at 28 °C. HEK293S GnTI − cells were cultured in Freestyle 293 medium supplemented with 2% fetal bovine serum at 37 °C.
METHOD DETAILS Electrophysiological recording
CHO-K1 cultured in 35 mm petri dishes were transiently transfected with 2 μg HCN1 EM DNA plasmid using Lipofectamine 3000 according to the manufacturer’s instructions. After 48–96 h, the medium was replaced with the bath solution (55 mM KCl, 100 mM NaCl, 1 mM CaCl2, 10 mM glucose, and 10 mM HEPES pH 7.4; 310 mOsm). When indicated, 100 μM Cd 2+ was added into the bath solution. For whole-cell recording, polished borosilicate micropipettes (resistance of 2–5 MΩ) were filled with the pipette solution (85 mM KCl, 70 mM KF, 5 mM EGTA, and 10 mM HEPES pH 7.2; 297 mOsm), and the recordings were obtained at room temperature (~23 °C) using an Axopatch 200B amplifier, a Digidata 1550 digitizer and pCLAMP. The recordings were low-pass filtered at 1 kHz and sampled at 20 kHz. The average current amplitude of HCN F186C/S264C is similar to the wild type channel. Protein Expression and purification HCN1 EM mutants were expressed in HEK293S GnTI − cells ( Goehring et al., 2014 ). Cells in suspension were grown at 37 °C to a density of ~3 × 10 6 cells/ml and then baculoviruses carrying HCN genes were added to initiate the transduction. After 10 h, 10 mM sodium butyrate was added to cells and the culture temperature was shifted to 30 °C. Cells were harvested at 58 h post-transduction. HCN mutants express to similar extents as the wild type does ( Figure S1B ). Protein purification was performed at 4 °C. The infected cell pellet from 1 L culture was resuspended in 200 ml hypotonic lysis buffer (20 mM KCl, 0.5 mM MgCl 2 , 5 μM cAMP, 0.1 mg/ml DNase, 10 mM Tris pH 8 and protease inhibitors) for 25 min, and the lysate was spun at 39800 × g for 35 min to sediment crude membranes. The membrane pellet was mechanically homogenized and solubilized in the extraction buffer (10 mM lauryl maltose neopentyl glycol, 2 mM cholesteryl hemisuccinate, 300 mM KCl, 5 μM cAMP, 20 mM Tris pH 8 and protease inhibitors) for 1.5 h. Solubilized membranes were clarified by centrifugation at 39800 × g for 55 min. The supernatant was applied to the GFP nanobody-coupled Sepharose resin (Kirchhofer et al., 2010), which was subsequently washed with 10 column volumes of the wash buffer (0.05 % digitonin, 300 mM KCl, 5 μM cAMP, 20 mM Tris pH 8 and protease inhibitors). The washed resin was incubated overnight with human rhinovirus 3C protease at a target protein to protease ratio of 40:1 (w/w) to cleave off GFP. The protein was eluted with the wash buffer, concentrated and purified through gel-filtration chromatography in the SEC buffer (0.05 % digitonin, 150 mM KCl, 5 μM cAMP and 20 mM Tris pH 8). Peak fractions were pooled and concentrated to 5–6 mg/ml. Prior to EM grid preparation, 5 mM cAMP was spiked to the protein sample. For HCN F186C/S264C sample, 200 μM HgCl 2 was also added at this stage.
EM data acquisition
Aliquots of 3.5 μl purified HCN sample were applied to glow-discharged Quantifoil R1.2/1.3 400 mesh Au grids. After 15 s, the grids were blotted for 1.5 s and plunged into liquid ethane using a Vitrobot Mark IV (FEI) operated at 16 °C and 100% humidity. The grids were loaded onto a 300 kV Titan Krios transmission electron microscope with the K2 Summit detector. Micrographs were recorded in super-resolution mode using SerialEM ( Mastronarde, 2005 ). Images have a physical pixel size of 1.03 Å (super-resolution pixel size of 0.515 Å) and a nominal defocus range of 1.2 to 2.3 μm. A dose rate of 8 electrons per pixel per second was used. The exposure time for each image was 10 s, with 0.2 s per frame. This gave a total cumulative dose of ~75 electrons per Å 2 (1.51 electrons per Å 2 per frame).
Image processing
Super-resolution image stacks were gain-normalized, binned by 2, and corrected for beam-induced motion using MotionCor2 ( Zheng et al., 2017 ). Contrast transfer function parameters were estimated from motion-corrected summed images without dose-weighting using GCTF ( Zhang, 2016 ). All subsequent processing was performed on motion-corrected summed images with dose-weighting. Particles were picked using Gautomatch (written by Kai Zhang). 2D and 3D classification were performed in RELION 3.0 ( Scheres, 2012 ). The major classes of particles were refined and subjected to Bayesian particle polishing in RELION ( Zivanov et al., 2019 ), followed by a final round of refinement using cryoSPARC2 ( Punjani et al., 2017 ). The mask-corrected FSC curves were calculated in cryoSPARC2 and reported resolutions were based on the FSC = 0.143 criterion ( Scheres and Chen, 2012 ). Local resolutions of density maps were estimated by Blocres ( Cardone et al., 2013 ). Model building An initial model was obtained by docking the cAMP-bound HCN1 EM structure (PDB code: 5U6P) into the density map using Chimera ( Pettersen et al., 2004 ). The models were then refined iterative iteratively in Coot ( Emsley et al., 2010 ) and Phenix ( Afonine et al., 2018 ). The quality of final models was evaluated by MolProbity ( Chen et al., 2010 ). The S4 helix geometry was analyzed using HELANAL-Plus ( Kumar and Bansal, 2012 ). Figures were prepared using PyMOL ( Schrödinger LLC, 2017 ) and Chimera.
Supplementary Material FigS1 Figure S1. Functional and biochemical analysis of HCN mutants, Related to Figure 2 and 4 ( A ) Cd 2+ effects on the single or double cysteine HCN mutants. Current decay at 0 mV was used as a measure of Cd 2+ crosslinking (mean ± SEM; n = 3 to 6). ( B ) Representative size-exclusion chromatography traces of HCN wild type (WT) and F186C/S264C. Peak fractions were used for cryo-EM analysis. FigS2 Figure S2.
Cryo-EM reconstructions of the cross-linked HCN
F186C/S264C channel, Related to Figure 4 ( A ) Local resolution of density map estimated by Blocres. ( B ) Angular distribution of particles for the final 3D reconstruction. ( C ) Fourier shell correlation (FSC) curves: half map 1 versus half map 2 (black), model versus summed map (blue). ( D ) Representative cryo-EM densities of the transmembrane regions. ( E ) Summary of refinement statistics. FigS3 Figure S3. Metal ion pathway in the HCN voltage sensor, from the extracellular solution to the binding site, Related to Figure 4 ( A ) Stereo view of the HCN sensor in a hyperpolarized conformation, viewed parallel to the membrane. Polar residues lining the pathway are labeled. The side chain of D222 is not modelled due to the absence of cryo-EM density. ( B ) Pathway to the metal ion binding site, viewed from the extracellular side. FigS4 Figure S4.
Cryo-EM reconstructions of the HCN
Y289D channel, Related to Figure 7 ( A ) Local resolution of density map estimated by Blocres. ( B ) Angular distribution of particles for the final 3D reconstruction. ( C ) Fourier shell correlation (FSC) curves: half map 1 versus half map 2 (black), model versus summed map (blue). ( D ) Summary of refinement statistics.
📊 Figures
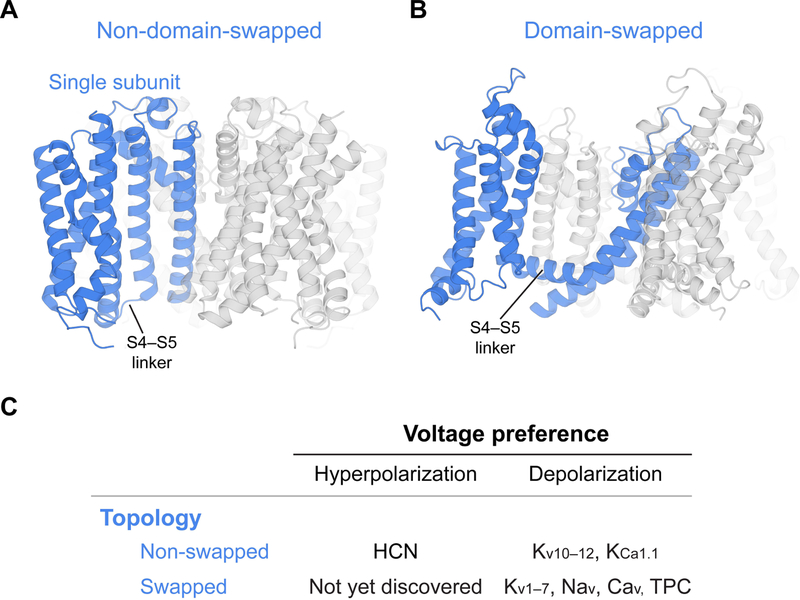
Figure 1.
Domain arrangements of voltage-gated ion channels
( A ) Non-domain-swapped channel. A single subunit of the channel tetramer is highlighted in blue. For this type of channels, the voltage sensor domain interacts with the pore domain from the same sub...
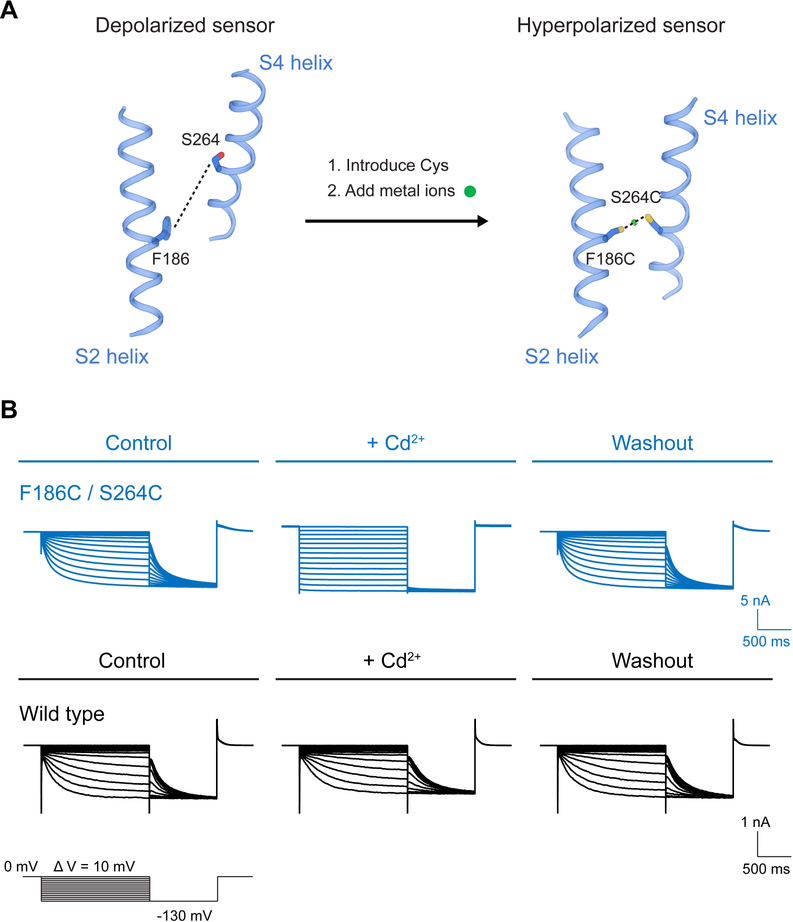
Figure 2.
Stabilizing HCN towards a hyperpolarized conformation
( A ) Strategy to stabilize the HCN voltage sensor in a hyperpolarized conformation. ( B ) Whole cell currents show reversible crosslinking of HCN F186C/S264C. The formation of Cd 2+ cross link locks ...
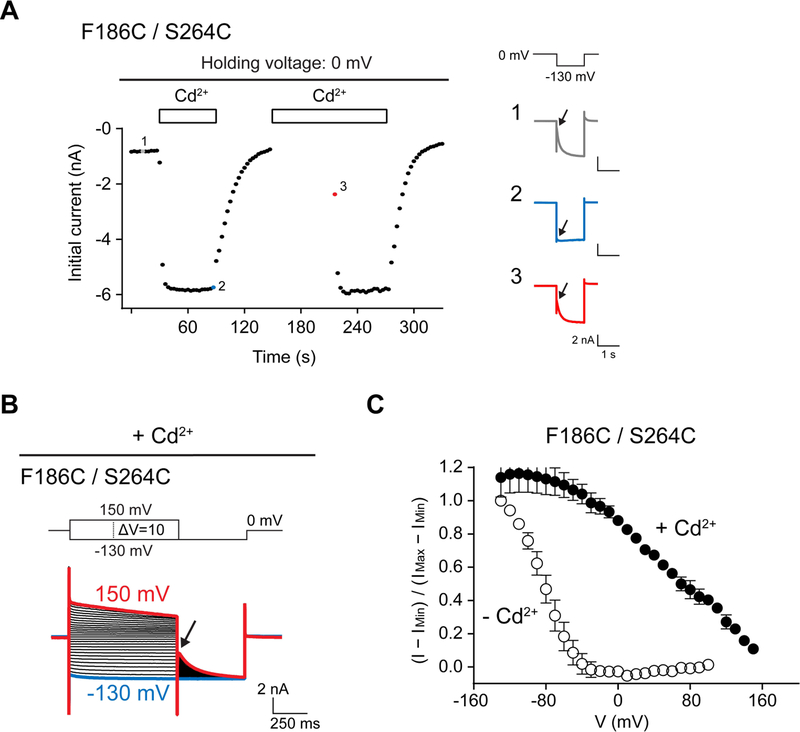
Figure 3.
Crosslinking of HCN F186C/S264C depends on the state of the channel
( A ) Cd 2+ effect is more prominent when the channels are opened by hyperpolarization. In the first Cd 2+ application, Cd 2+ quickly increases the initial current recorded from hyperpolarizing square...
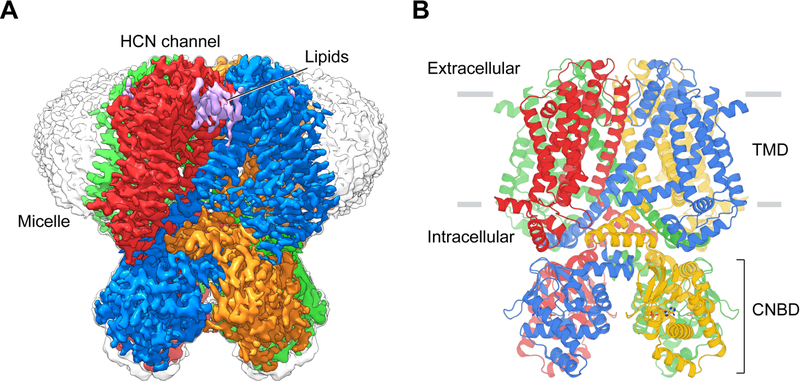
Figure 4.
Structure of the cross-linked HCN channel
( A ) Cryo-EM density map of the cross-linked HCN F186C/S264C channel. Each channel subunit is shown in a different color. ( B ) Structure of the cross-linked HCN F186C/S264C channel. TMD, transmembra...
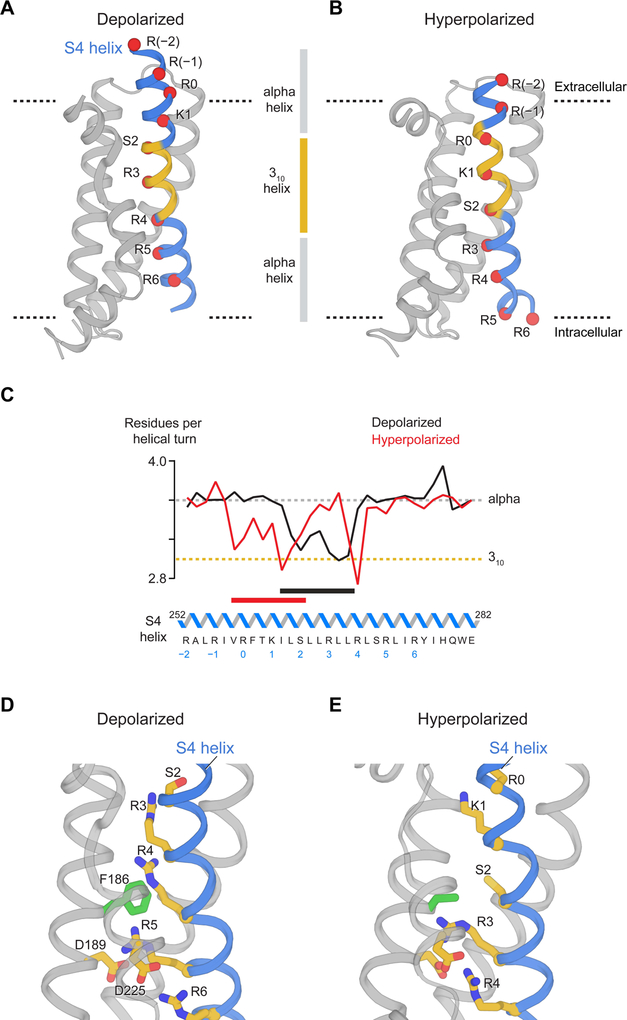
Figure 5.
Movement of S4 in the voltage sensor
( A and B ) Helical geometry of S4 in depolarized and hyperpolarized conformations. The black dash lines represent approximate boundaries of the membrane bilayer. Red spheres denote Cu03b1 positions o...
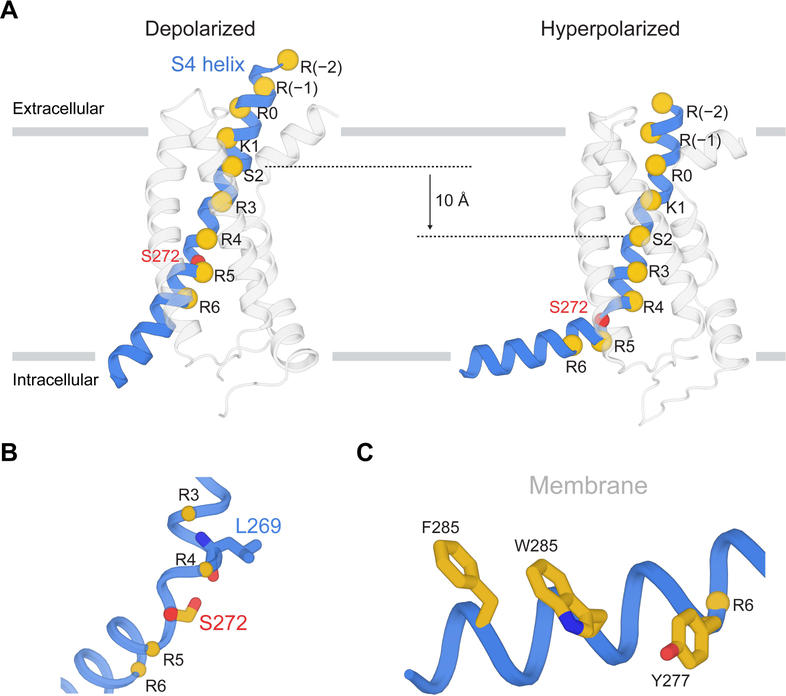
Figure 6.
Interfacial S4 helix created by hyperpolarization
( A ) Vertical translation of the S4 helix from depolarization to hyperpolarization. Spheres denote Cu03b1 positions of positive-charged residues, Ser264 (S2) and Ser272. The gray bars represent appro...
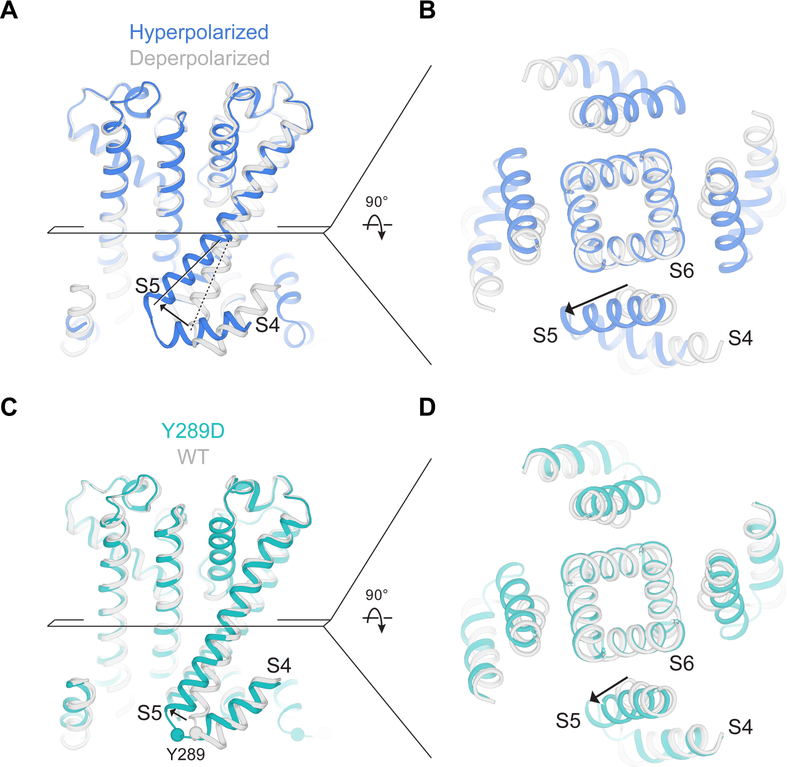
Figure 7.
Activation mechanism of the HCN channel
( A and B ) Movement of the S5 helix during hyperpolarization. Superposition of HCN in hyperpolarized (blue) and depolarized conformations (gray, PDB ID 5U6P, determined at a resolution of 3.5 u00c5)....
Figure images are served from the NIH/NLM PubMed Central Open Access Subset or Europe PMC; copyright remains with the publishers and authors.
💬 Discussion
0 commentsNo comments yet. Be the first to start a discussion!
Leave a Comment