Abstract
AbstractHuman induced pluripotent stem cell-derived cardiomyocytes (hiPSC-CMs) have become a powerful tool for human disease modeling and therapeutic testing. However, their use remains limited by their immaturity and heterogeneity. To characterize the source of this heterogeneity, we applied complementary single-cell RNA-seq and bulk RNA-seq technologies over time during hiPSC cardiac differentiation and in the adult heart. Using integrated transcriptomic and splicing analysis, more than half a dozen distinct single-cell populations were observed, several of which were coincident at a single time-point, day 30 of differentiation. To dissect the role of distinct cardiac transcriptional regulators associated with each cell population, we systematically tested the effect of a gain or loss of three transcription factors (NR2F2, TBX5, and HEY2), using CRISPR genome editing and ChIP-seq, in conjunction with patch clamp, calcium imaging, and CyTOF analysis. These targets, data, and integrative genomics analysis methods provide a powerful platform for understanding in vitro cellular heterogeneity.
🔬 Techniques
🔭 Microscopes
💻 Software
✨ Fluorophores
🧪 Sample Preparation
🔬 Cell Lines
🏭 Microscope Brands
🧪 Reagent Suppliers
📷 Detectors
🔎 Objectives
💻 Software Details
🏛️ Research Organizations (ROR)
Affiliated research institutions:
📋 Methods
Generation of human induced pluripotent stem cells
A skin punch biopsy was performed and dermal fibroblasts were acquired from this biopsy under informed consent as outlined in and approved by Stanford’s Institutional Review Board (IRB) protocols. Fibroblasts were grown in DMEM supplemented with 10% fetal bovine serum (FBS) and 1% pen/strep on gelatin-coated flasks. Fibroblasts were passaged using trypsin and 1 × 10 6 fibroblasts were electroporated using 10 µg of reprogramming episomal vectors 35 using the Neon® Transfection System. Fibroblasts were plated onto Matrigel™-coated 10 cm culture wells in DMEM supplemented with 10% FBS, 1% pen/strep, and hydrocortisone. Fibroblasts were then grown using Essential 7 (E7) media [Essential 6 (Invitrogen) with FGF2 (50 µg/L)] and sodium butyrate (0.2 mM NaB) (B5887 diluted in DMSO, Sigma) for thirteen days and then switched to Essential 8 (E8) media (Invitrogen) until hiPSC colonies were formed. hiPSC colonies were picked and expanded until passage 10 before being used in experiments outlined below. hiPSCs were tested to be mycoplasma negative using the Mycoalert Mycoplasma testing kits (LT07-318, Lonza).
Cardiomyocyte differentiation
Cardiomyocytes were differentiated using a monolayer method as previously described 11 with minor modification. hiPSCs (passage 24-35) were seeded at 1.2 × 10 5 per well in Matrigel™-coated 6 cm culture wells and grown for four days prior to starting hiPSC-CM differentiation. To initiate differentiation, B27 without insulin (A1895601, Life Technologies) in RPMI supplemented with 6 µM CHIR-99021 (CT99021, Selleckchem) was added to the hiPSCs for two days. CHIR was removed from the cultures and cells were incubated for one day in RPMI supplemented with B27 without insulin. Cultures were then treated with 5 µM IWR-1 (I0161, Sigma) in RPMI supplemented with B27 without insulin for two days and incubated for two days with RPMI containing B27 without insulin. For two days, cultures were maintained in RPMI with B27 with insulin (17504-044, Life Technologies) and glucose starved for three days (using RPMI minus glucose). After glucose starvation, hiPSC-CMs were maintained in RPMI with B27. Cardiomyocyte differentiation was repeated three additional times and the cells were then processed for RNA-seq. Overexpression of NR2F2 , TBX5 , and HEY2 in hiPSC-CMs To overexpress NR2F2 , TBX5 , and HEY2 in hiPSC-CMs, lentiviral particles were purchased for mGFP-tagged NR2F2 (Cat# RC206753L2V), TBX5 (Cat# RC216520L2V), HEY2 (Cat# RC202544L2V), and control GFP Lent-ORF particles (Cat# PS100071V5) from Origene. Two sets of day 30 hiPSC-CMs were infected with 1 or 2 MOI of each lentivirus and maintained in culture for 1 week. RNA from NR2F2 , TBX5 , HEY2 , and GFP infected hiPSC-CMs was extracted and RNA-sequenced using Illumina’s HiSeq 4000 2 × 150 paired end sequencing (Novogene). RNA-sequencing RNA-seq of cardiomyocyte differentiation ( N = 3 separate differentiations) from hiPSCs was performed as follows: total RNA was isolated using the miRNeasy Micro Kit (Qiagen). 100 ng of RNA was converted to cDNA using the Ovation® RNA-Seq System V2 kit (NuGEN) as outlined in the manufacture’s protocol. cDNA was fragmented using the Covaris S2 to an average fragment size of 300 bp and the fragmented cDNA was purified using Agencourt AMPure XP beads. End repair, dA tailing, and adapter ligation was performed using the NEBNext DNA Library Prep Master Mix Set for Illumina (E6040L, NEB) with 500 ng sheared cDNA input. Size selection was performed on the Pippen Prep using 2% DNA gels (12-100-506, Sage Science) to capture 300–360 bp DNA fragments. Bar-coded RNA-seq libraries were pooled and hybridized to one lane of an Illumina HiSeq 2000 flow cell using 2 × 100 paired end reads on the HiSeq 2000. Two hiPSC lines were obtained from the Stanford Cardiovascular Institute biobank (CVI0076, CVI0059). CVI0059 was processed for single cell RNA-seq at day 5, day 14, and day 45 of the cardiomyocyte differentiation protocol using the 10X Genomics single-cell RNA-seq v1 kit. CVI0076 was processed for single cell RNA-seq at day 0, day 5, day 14, and day 45 of the cardiomyocyte differentiation protocol using the 10X Genomics single-cell RNA-seq kit v2. Single-cell RNA-seq was performed as follows. Cells were trypsinized for 5 min and filtered through a 60 μm pore filter. Trypsin was removed by centrifugation and cells were washed three times with PBS + 0.04% BSA (Non Acetylated, Sigma B6917). Cells were submitted to the Stanford Functional Genomics facility for single-cell library preparation and sequencing. Briefly, Gel-Bead in Emulsions (GEMs) were generated using the 10X Chromium system (10X Genomics, Pleasanton, CA). Barcoded cDNA was extracted from the GEMs by Post-GEM RT-cleanup and amplified for 12 cycles. Amplified cDNA was sheared (target –200 BP, Covaris S2), and subjected to end-repair, poly A-tailing, adapter ligation, and 10X specific sample indexing as per manufacturer’s protocol. Libraries were quantified using Bioanalyzer (Agilent) and qPCR (KAPA) analysis. Libraries were sequenced on the NextSeq 500 (Illumina). Unsupervised cell population discovery analyses were performed with Seurat-CCA and the software ICGS available in AltAnalyze version 2.1.1 ( http://www.altanalyze.org ) 12 . For these analyses, only protein-coding genes were considered, applying a correlation cutoff of 0.3 and Euclidean column HOPACH clustering. Associated t-SNE visualizations were obtained in AltAnalyze using ICGS obtained dynamically regulated genes. Single-cell hiPSC-CMs (day 30 after differentiation began) were captured using 10–17 µM C1 Single-Cell Auto Prep IFC for mRNA-Seq (Cat# 5760, Fluidigm). Single-cell RNA-seq libraries were further generated according to the manufacturer’s protocol using the SMARTer Ultra Low RNA Kit for the Fluidigm C1 (Clontech) and Nextera XT DNA Sample Preparation Kit (FC-131-1096, Illumina). Each captured cell was labeled using a live and dead staining kit (L-3224, Life technologies) and imaged using florescence microscopy in the capture site to ensure viable, single cells were captured at each site and that these cells did not represent doublets or dead cells. Cells were captured in 85 of the 96 capture sites, 19 of which were considered dead based on the florescent ratio of the dead versus live stain and 15 sites with one or more cells observed (aka doublets, 18%). The observed number of doublets for a single medium C1 chip is similar to the expected rate suggested by the manufacturer (~30% with a standard deviation of 10%). Doublets were defined as two or more cells that reside in either the wings of the capture site or that are stacked on top of each other in the capture site nest, as per the manufacturer recommendations. ERCC spike-ins were included for further evaluation of sample quality. For the 51 libraries corresponding to single-live cells, libraries were pooled and sequenced using Illumina’s HiSeq 2000 using 2 × 100 paired-end sequencing (Macrogen, South Korea). Filtered reads were aligned to the reference genome hg19 using STAR 36 . Using STAR BAM files, AltAnalyze was used to generate exon read counts for gene expression analysis and junction read counts for splicing analysis (see below). All retained single-cell libraries were required to have a minimum of 1 million uniquely aligning paired-end fragments and > 40% aligned fragments, based on STAR analysis. The retained libraries had an average of ~3 million aligned fragments. Analysis of these same libraries using the Kallisto and TopHat2 workflows produced similar estimated and percentage aligned fragment statistics 37 , 38 . This filtering excluded only two of the 51 libraries, both of which had less than ~6,000 aligned fragments, with all retained cells having over one million aligned reads. In addition, we applied a stringent filtering of the cells based on the number of exon-exon junctions expressed ( > 400,000 junctions reads/cell). To calculate RPKM values for each gene, AltAnalyze was run on the junction and exon BED files using default settings. To identify discrete cell states, unsupervised clustering was initially performed to define predominant populations (ICGS module of AltAnalyze, Pearson correlation coefficient > 0.4). Although this analysis identified three initial populations, we augmented these results using a supervised analysis of cardiac transcription factors from our 10X Genomics identified using the ICGS supervised correlation option. In agreement with our Fluidigim C1 microscopy analyses, no gene expression signatures with evident “doublet cell” profiles (more than one cell population signature) were discerned from this analysis. Furthermore, ERCC spike-in expression (ERCC92.fa, Kallisto TPM) ratios indicated single-cell transcriptome profiles were being assessed. Using the obtained cell populations from this supervised analysis, the MarkerFinder algorithm in AltAnalyze was run to identify additional genes with population-restricted expression profiles (Pearson correlation coefficient > 0.4). RNA-seq libraries for control, NR2F2 GE1 , and HEY2 GE1 hiPSC-CMs were created using the Ion AmpliSeq™ Transcriptome Human Gene Expression Kit (Life Technologies). Each library was adjusted to a 100 pM concentration and Ion Template preparation was performed using the automated Ion Chef system. Templates were loaded on the Ion PI™ Chip Kit v3 (Life Technologies) and sequencing was performed using the Ion Proton sequencing platform with the Ion PI™ Hi-Q™ Sequencing 200 Kit (Life Technologies). Quantification of gene expression differences was performed using the Ion Torrent Suite software (Life Technologies) with the hg19_AmpliSeq_Transcriptome_21K_v1 reference. Additional differentiations were performed on NR2F2 GE1 ( N = 2), TBX5 GE1 ( N = 2) , HEY2 GE1 ( N = 2) , NR2F2 GE2 ( N = 4), TBX5 GE2 ( N = 3), and HEY2 GE2 ( N = 2) lines and sequenced using Illumina’s HiSeq 4000 2 × 150 paired end sequencing (Novogene). ChIP-sequencing Cardiomyocytes (day 20 of culture, N = 1) were crosslinked by 1% formaldehyde and sheared using tip sonicator (450D, Branson). A small portion of the crosslinked, sheared chromatin was saved as the input. Five micrograms of either anti-NR2F2 (61213, Active Motif), anti-HEY2 (10597-1-AP, Proteintech) or anti-TBX5 (SAB1411311, Sigma) was incubated with protein G Dynabeads (10003D, Invitrogen) for 12 h at 4°C and the remainder were incubated with the antibody conjugated Dynabeads. After overnight incubation at 4°C, the incubated beads were rinsed with sonication buffer (50 mM HEPES pH 7.9, 140 mM NaCl, 1 mM EDTA, 1% Triton X-100, 0.1% Na-deoxycholate, 0.1% SDS, 0.5 mM PMSF), high salt buffer (50 mM HEPES, pH 7.9, 500 mM NaCl, 1 mM EDTA, 1% Triton X-100, 0.1% Na-deoxycholate, 0.1% SDS, 0.5 mM PMSF), and LiCl buffer (20 mM Tris, pH 8.0, 1 mM EDTA, 250 mM LiCl, 0.5% NP-40, 0.5% Na-deoxycholate, 0.5 mM PMSF). The washed beads were incubated with elution buffer (50 mM Tris, pH 8.0, 1 mM EDTA, 1% SDS, 50 mM NaHCO 3 ) for 1 h at 65°C and then de-crosslinked with 5 M NaCl overnight at 65°C. The immunoprecipitated DNA was treated with RNase A and Proteinase K, and purified by ChIP DNA clean and concentrator (D5205, Zymo Research). 10 ng was used as input DNA into the NEBNext® Ultra™ DNA Library Prep kit to add on sequencing adapters, and a fragment size of 420–580 bp was isolated using the Pippen Prep (Sage Science). Bowtie was used to map the raw sequencing reads to the reference hg19 genome and peak calling was performed using MACS v2.0.10 39 . To annotate peaks to the nearest transcriptional start site, Bedtools (Quinlan and Hall, 2010) and HOMER ( http://homer.salk.edu/homer/ ) were used. Peak bed files were also used as input into GREAT to identify Biological Process Gene Ontology terms 16 . Lists of common ChIP-seq annotated genes and genes demonstrating a 2-fold change in expression between control versus each gene-edited line (RNA-seq) were generated to identify genes likely regulated by each transcription factor. Commonly called genes between ChIP-seq datasets and RNA-seq datasets were merged to generate a list of all transcription factor to gene interactions. Visualization of each interaction between all genes (transcription factor interaction maps) was generated with a modified code of the 3D Force layout using threejs ( http://d3js.org/ ). Nodes represented individual genes, the links represented an interaction between two genes, and the color of the link indicated either an upregulation (green) or a downregulation (red) observed in the RNA-seq datasets. Gene editing cardiac transcription factors TBX5 gene-edited line was previously created and described 17 . Briefly, TALEN binding sites were designed using the TAL Effector Nucleotide Targeter 2.0 having a repeat array length of 15 repeat variable di-residue domains and a spacer length of 14–18 nucleotides 40 . TBX5 TALEN was generated from a plasmid library through a five-piece subcloning ligation: three sequence-specific tetramer-recognition pieces, one trimer-recognition piece, and an expression vector backbone (pTAL) as previously described 41 . The forward construct (containing the TBX5 start and reverse TALENs) were subcloned into the pTAL_GFP and pTAL_RFP backbones. hiPSCs seeded at 2 × 10 6 cells were transfected with a pair of TALENs (1.0 μg of each TALEN) by nucleofection using the P3 Primary Cell Nucleofector Kit and program CM-150 per the manufacturer’s instructions on the Amaxa 4D Nucleofector system (Lonza). Double GFP + /RFP + cells were sorted by FACS (FACSAria II; BD Biosciences) and clonal selection was performed as described below. CRISPR guide RNAs were designed using the Zhang lab’s online CRISPR design tool ( http://crispr.mit.edu/ ). Guide regions were designed to represent exons shared by multiple transcript variants of each gene ( NR2F2 or HEY2 ) (Supplementary Fig. 4 ). Guides were cloned into the pSpCas9(BB)-2A-GFP vector (gift from Feng Zhang: #48138, Addgene) and 3 µg transfected into hiPSC cells using Lipofectamine® 3000 reagent. Two days after transfection, GFP expression was observed. GFP expressing hiPSCs were incubated for 5 min in Accutase to release hiPSCs from the culture plate. hiPSCs were passed through a 100 µm cell strainer and Accutase was removed by centrifugation at 300× g for 4 min. hiPSCs were resuspended in 250 µL of FACS wash buffer (1% BSA in PBS) and FACS was then performed using the FACSAria III cell sorter (BD Biosciences). Sorted cells were seeded at a density of 1000 cells per well of a 6-well culture plate and were clonally expanded for 7 days. To identify the genotype of each hiPSC clone, genomic DNA was isolated from each CRISPR targeted clone using the DNeasy Blood & Tissue Kit (Qiagen), and PCR was performed on the region spanning the CRISPR targeted site using PrimeSTAR® GXL DNA Polymerase (Clontech). Each PCR amplified region was Sanger-sequenced (Quintara Biosciences, San Francisco) to validate the targeted deletion. In addition, the PCR product was TOPO-cloned using a StrataClone Blunt PCR Cloning Kit (Agilent), and plasmids from six clones (per PCR product) was purified using QIAprep Spin Miniprep Kit (Qiagen) and sequenced using the T3 primer (Quintara Biosciences). Sequencing each clone identified a large 89 bp deletion in exon 2 of NR2F2 from chr15:96334128-96334216 ( NR2F2 GE ), as well as a 15 bp deletion in exon 2 of HEY2 from chr6:125751839-125751854 ( HEY2 GE ) (Supplementary Fig. 4B ). NR2F2 GE2 , TBX5 GE2 , and HEY2 GE2 lines were created using the background corresponding NR2F2 GE1 , TBX5 GE1 , and HEY2 GE1 cell lines. Two CRISPR guide-RNAs targeting sequences upstream of each exon (NR2F2: CAAACTGCCCCAACCGGAGT and ATTTGCTCCAACTCCGGTTG, TBX5: GTTGGCGCCATTGGGCAACC and TCACATGTGGTTGGCGCCAT, HEY2: AGTTGGGATTGTCTAGTGAG and GTTGGGATTGTCTAGTGAGA), as well as two guide-RNAs targeting sequences downstream of each exon (NR2F2: CAAGTTGTTCTGACCGACAC and AGCTAGAGGTACATAGACAC, TBX5: CAAGGCGAATTTAGAGGGCG and GCGGGGAGCAGGGTTTTATC, HEY2: AATGGCAGGATTGAACTCGT and TAATGGCAGGATTGAACTCG) were used to create large deletions within each transcr-iption factor using the same protocol outlined above. Clones were picked, and sequence verified to reveal successful excision of each exon. PCR was also used to verify deletions (using the primers: NR2F2: NR2F2-FGATCGTGGACGCCATTAC NR2F2-R GTGCGTTTCCATCATCTTTG, TBX5: TBX5-F TTAGCACCAGCTTCCAATC TBX5-R GTTCTCTCTTCCTCTTTCCTTC, HEY2: HEY2-F TTTGCTGTGGTGATCTTAGG HEY2-R ATTACCTCTAACCTCCTGTTTATG) within each region targeted (Supplementary Fig. 4C ).
Show full methods section
Generation of human induced pluripotent stem cells
A skin punch biopsy was performed and dermal fibroblasts were acquired from this biopsy under informed consent as outlined in and approved by Stanford’s Institutional Review Board (IRB) protocols. Fibroblasts were grown in DMEM supplemented with 10% fetal bovine serum (FBS) and 1% pen/strep on gelatin-coated flasks. Fibroblasts were passaged using trypsin and 1 × 10 6 fibroblasts were electroporated using 10 µg of reprogramming episomal vectors 35 using the Neon® Transfection System. Fibroblasts were plated onto Matrigel™-coated 10 cm culture wells in DMEM supplemented with 10% FBS, 1% pen/strep, and hydrocortisone. Fibroblasts were then grown using Essential 7 (E7) media [Essential 6 (Invitrogen) with FGF2 (50 µg/L)] and sodium butyrate (0.2 mM NaB) (B5887 diluted in DMSO, Sigma) for thirteen days and then switched to Essential 8 (E8) media (Invitrogen) until hiPSC colonies were formed. hiPSC colonies were picked and expanded until passage 10 before being used in experiments outlined below. hiPSCs were tested to be mycoplasma negative using the Mycoalert Mycoplasma testing kits (LT07-318, Lonza).
Cardiomyocyte differentiation
Cardiomyocytes were differentiated using a monolayer method as previously described 11 with minor modification. hiPSCs (passage 24-35) were seeded at 1.2 × 10 5 per well in Matrigel™-coated 6 cm culture wells and grown for four days prior to starting hiPSC-CM differentiation. To initiate differentiation, B27 without insulin (A1895601, Life Technologies) in RPMI supplemented with 6 µM CHIR-99021 (CT99021, Selleckchem) was added to the hiPSCs for two days. CHIR was removed from the cultures and cells were incubated for one day in RPMI supplemented with B27 without insulin. Cultures were then treated with 5 µM IWR-1 (I0161, Sigma) in RPMI supplemented with B27 without insulin for two days and incubated for two days with RPMI containing B27 without insulin. For two days, cultures were maintained in RPMI with B27 with insulin (17504-044, Life Technologies) and glucose starved for three days (using RPMI minus glucose). After glucose starvation, hiPSC-CMs were maintained in RPMI with B27. Cardiomyocyte differentiation was repeated three additional times and the cells were then processed for RNA-seq. Overexpression of NR2F2 , TBX5 , and HEY2 in hiPSC-CMs To overexpress NR2F2 , TBX5 , and HEY2 in hiPSC-CMs, lentiviral particles were purchased for mGFP-tagged NR2F2 (Cat# RC206753L2V), TBX5 (Cat# RC216520L2V), HEY2 (Cat# RC202544L2V), and control GFP Lent-ORF particles (Cat# PS100071V5) from Origene. Two sets of day 30 hiPSC-CMs were infected with 1 or 2 MOI of each lentivirus and maintained in culture for 1 week. RNA from NR2F2 , TBX5 , HEY2 , and GFP infected hiPSC-CMs was extracted and RNA-sequenced using Illumina’s HiSeq 4000 2 × 150 paired end sequencing (Novogene). RNA-sequencing RNA-seq of cardiomyocyte differentiation ( N = 3 separate differentiations) from hiPSCs was performed as follows: total RNA was isolated using the miRNeasy Micro Kit (Qiagen). 100 ng of RNA was converted to cDNA using the Ovation® RNA-Seq System V2 kit (NuGEN) as outlined in the manufacture’s protocol. cDNA was fragmented using the Covaris S2 to an average fragment size of 300 bp and the fragmented cDNA was purified using Agencourt AMPure XP beads. End repair, dA tailing, and adapter ligation was performed using the NEBNext DNA Library Prep Master Mix Set for Illumina (E6040L, NEB) with 500 ng sheared cDNA input. Size selection was performed on the Pippen Prep using 2% DNA gels (12-100-506, Sage Science) to capture 300–360 bp DNA fragments. Bar-coded RNA-seq libraries were pooled and hybridized to one lane of an Illumina HiSeq 2000 flow cell using 2 × 100 paired end reads on the HiSeq 2000. Two hiPSC lines were obtained from the Stanford Cardiovascular Institute biobank (CVI0076, CVI0059). CVI0059 was processed for single cell RNA-seq at day 5, day 14, and day 45 of the cardiomyocyte differentiation protocol using the 10X Genomics single-cell RNA-seq v1 kit. CVI0076 was processed for single cell RNA-seq at day 0, day 5, day 14, and day 45 of the cardiomyocyte differentiation protocol using the 10X Genomics single-cell RNA-seq kit v2. Single-cell RNA-seq was performed as follows. Cells were trypsinized for 5 min and filtered through a 60 μm pore filter. Trypsin was removed by centrifugation and cells were washed three times with PBS + 0.04% BSA (Non Acetylated, Sigma B6917). Cells were submitted to the Stanford Functional Genomics facility for single-cell library preparation and sequencing. Briefly, Gel-Bead in Emulsions (GEMs) were generated using the 10X Chromium system (10X Genomics, Pleasanton, CA). Barcoded cDNA was extracted from the GEMs by Post-GEM RT-cleanup and amplified for 12 cycles. Amplified cDNA was sheared (target –200 BP, Covaris S2), and subjected to end-repair, poly A-tailing, adapter ligation, and 10X specific sample indexing as per manufacturer’s protocol. Libraries were quantified using Bioanalyzer (Agilent) and qPCR (KAPA) analysis. Libraries were sequenced on the NextSeq 500 (Illumina). Unsupervised cell population discovery analyses were performed with Seurat-CCA and the software ICGS available in AltAnalyze version 2.1.1 ( http://www.altanalyze.org ) 12 . For these analyses, only protein-coding genes were considered, applying a correlation cutoff of 0.3 and Euclidean column HOPACH clustering. Associated t-SNE visualizations were obtained in AltAnalyze using ICGS obtained dynamically regulated genes. Single-cell hiPSC-CMs (day 30 after differentiation began) were captured using 10–17 µM C1 Single-Cell Auto Prep IFC for mRNA-Seq (Cat# 5760, Fluidigm). Single-cell RNA-seq libraries were further generated according to the manufacturer’s protocol using the SMARTer Ultra Low RNA Kit for the Fluidigm C1 (Clontech) and Nextera XT DNA Sample Preparation Kit (FC-131-1096, Illumina). Each captured cell was labeled using a live and dead staining kit (L-3224, Life technologies) and imaged using florescence microscopy in the capture site to ensure viable, single cells were captured at each site and that these cells did not represent doublets or dead cells. Cells were captured in 85 of the 96 capture sites, 19 of which were considered dead based on the florescent ratio of the dead versus live stain and 15 sites with one or more cells observed (aka doublets, 18%). The observed number of doublets for a single medium C1 chip is similar to the expected rate suggested by the manufacturer (~30% with a standard deviation of 10%). Doublets were defined as two or more cells that reside in either the wings of the capture site or that are stacked on top of each other in the capture site nest, as per the manufacturer recommendations. ERCC spike-ins were included for further evaluation of sample quality. For the 51 libraries corresponding to single-live cells, libraries were pooled and sequenced using Illumina’s HiSeq 2000 using 2 × 100 paired-end sequencing (Macrogen, South Korea). Filtered reads were aligned to the reference genome hg19 using STAR 36 . Using STAR BAM files, AltAnalyze was used to generate exon read counts for gene expression analysis and junction read counts for splicing analysis (see below). All retained single-cell libraries were required to have a minimum of 1 million uniquely aligning paired-end fragments and > 40% aligned fragments, based on STAR analysis. The retained libraries had an average of ~3 million aligned fragments. Analysis of these same libraries using the Kallisto and TopHat2 workflows produced similar estimated and percentage aligned fragment statistics 37 , 38 . This filtering excluded only two of the 51 libraries, both of which had less than ~6,000 aligned fragments, with all retained cells having over one million aligned reads. In addition, we applied a stringent filtering of the cells based on the number of exon-exon junctions expressed ( > 400,000 junctions reads/cell). To calculate RPKM values for each gene, AltAnalyze was run on the junction and exon BED files using default settings. To identify discrete cell states, unsupervised clustering was initially performed to define predominant populations (ICGS module of AltAnalyze, Pearson correlation coefficient > 0.4). Although this analysis identified three initial populations, we augmented these results using a supervised analysis of cardiac transcription factors from our 10X Genomics identified using the ICGS supervised correlation option. In agreement with our Fluidigim C1 microscopy analyses, no gene expression signatures with evident “doublet cell” profiles (more than one cell population signature) were discerned from this analysis. Furthermore, ERCC spike-in expression (ERCC92.fa, Kallisto TPM) ratios indicated single-cell transcriptome profiles were being assessed. Using the obtained cell populations from this supervised analysis, the MarkerFinder algorithm in AltAnalyze was run to identify additional genes with population-restricted expression profiles (Pearson correlation coefficient > 0.4). RNA-seq libraries for control, NR2F2 GE1 , and HEY2 GE1 hiPSC-CMs were created using the Ion AmpliSeq™ Transcriptome Human Gene Expression Kit (Life Technologies). Each library was adjusted to a 100 pM concentration and Ion Template preparation was performed using the automated Ion Chef system. Templates were loaded on the Ion PI™ Chip Kit v3 (Life Technologies) and sequencing was performed using the Ion Proton sequencing platform with the Ion PI™ Hi-Q™ Sequencing 200 Kit (Life Technologies). Quantification of gene expression differences was performed using the Ion Torrent Suite software (Life Technologies) with the hg19_AmpliSeq_Transcriptome_21K_v1 reference. Additional differentiations were performed on NR2F2 GE1 ( N = 2), TBX5 GE1 ( N = 2) , HEY2 GE1 ( N = 2) , NR2F2 GE2 ( N = 4), TBX5 GE2 ( N = 3), and HEY2 GE2 ( N = 2) lines and sequenced using Illumina’s HiSeq 4000 2 × 150 paired end sequencing (Novogene). ChIP-sequencing Cardiomyocytes (day 20 of culture, N = 1) were crosslinked by 1% formaldehyde and sheared using tip sonicator (450D, Branson). A small portion of the crosslinked, sheared chromatin was saved as the input. Five micrograms of either anti-NR2F2 (61213, Active Motif), anti-HEY2 (10597-1-AP, Proteintech) or anti-TBX5 (SAB1411311, Sigma) was incubated with protein G Dynabeads (10003D, Invitrogen) for 12 h at 4°C and the remainder were incubated with the antibody conjugated Dynabeads. After overnight incubation at 4°C, the incubated beads were rinsed with sonication buffer (50 mM HEPES pH 7.9, 140 mM NaCl, 1 mM EDTA, 1% Triton X-100, 0.1% Na-deoxycholate, 0.1% SDS, 0.5 mM PMSF), high salt buffer (50 mM HEPES, pH 7.9, 500 mM NaCl, 1 mM EDTA, 1% Triton X-100, 0.1% Na-deoxycholate, 0.1% SDS, 0.5 mM PMSF), and LiCl buffer (20 mM Tris, pH 8.0, 1 mM EDTA, 250 mM LiCl, 0.5% NP-40, 0.5% Na-deoxycholate, 0.5 mM PMSF). The washed beads were incubated with elution buffer (50 mM Tris, pH 8.0, 1 mM EDTA, 1% SDS, 50 mM NaHCO 3 ) for 1 h at 65°C and then de-crosslinked with 5 M NaCl overnight at 65°C. The immunoprecipitated DNA was treated with RNase A and Proteinase K, and purified by ChIP DNA clean and concentrator (D5205, Zymo Research). 10 ng was used as input DNA into the NEBNext® Ultra™ DNA Library Prep kit to add on sequencing adapters, and a fragment size of 420–580 bp was isolated using the Pippen Prep (Sage Science). Bowtie was used to map the raw sequencing reads to the reference hg19 genome and peak calling was performed using MACS v2.0.10 39 . To annotate peaks to the nearest transcriptional start site, Bedtools (Quinlan and Hall, 2010) and HOMER ( http://homer.salk.edu/homer/ ) were used. Peak bed files were also used as input into GREAT to identify Biological Process Gene Ontology terms 16 . Lists of common ChIP-seq annotated genes and genes demonstrating a 2-fold change in expression between control versus each gene-edited line (RNA-seq) were generated to identify genes likely regulated by each transcription factor. Commonly called genes between ChIP-seq datasets and RNA-seq datasets were merged to generate a list of all transcription factor to gene interactions. Visualization of each interaction between all genes (transcription factor interaction maps) was generated with a modified code of the 3D Force layout using threejs ( http://d3js.org/ ). Nodes represented individual genes, the links represented an interaction between two genes, and the color of the link indicated either an upregulation (green) or a downregulation (red) observed in the RNA-seq datasets. Gene editing cardiac transcription factors TBX5 gene-edited line was previously created and described 17 . Briefly, TALEN binding sites were designed using the TAL Effector Nucleotide Targeter 2.0 having a repeat array length of 15 repeat variable di-residue domains and a spacer length of 14–18 nucleotides 40 . TBX5 TALEN was generated from a plasmid library through a five-piece subcloning ligation: three sequence-specific tetramer-recognition pieces, one trimer-recognition piece, and an expression vector backbone (pTAL) as previously described 41 . The forward construct (containing the TBX5 start and reverse TALENs) were subcloned into the pTAL_GFP and pTAL_RFP backbones. hiPSCs seeded at 2 × 10 6 cells were transfected with a pair of TALENs (1.0 μg of each TALEN) by nucleofection using the P3 Primary Cell Nucleofector Kit and program CM-150 per the manufacturer’s instructions on the Amaxa 4D Nucleofector system (Lonza). Double GFP + /RFP + cells were sorted by FACS (FACSAria II; BD Biosciences) and clonal selection was performed as described below. CRISPR guide RNAs were designed using the Zhang lab’s online CRISPR design tool ( http://crispr.mit.edu/ ). Guide regions were designed to represent exons shared by multiple transcript variants of each gene ( NR2F2 or HEY2 ) (Supplementary Fig. 4 ). Guides were cloned into the pSpCas9(BB)-2A-GFP vector (gift from Feng Zhang: #48138, Addgene) and 3 µg transfected into hiPSC cells using Lipofectamine® 3000 reagent. Two days after transfection, GFP expression was observed. GFP expressing hiPSCs were incubated for 5 min in Accutase to release hiPSCs from the culture plate. hiPSCs were passed through a 100 µm cell strainer and Accutase was removed by centrifugation at 300× g for 4 min. hiPSCs were resuspended in 250 µL of FACS wash buffer (1% BSA in PBS) and FACS was then performed using the FACSAria III cell sorter (BD Biosciences). Sorted cells were seeded at a density of 1000 cells per well of a 6-well culture plate and were clonally expanded for 7 days. To identify the genotype of each hiPSC clone, genomic DNA was isolated from each CRISPR targeted clone using the DNeasy Blood & Tissue Kit (Qiagen), and PCR was performed on the region spanning the CRISPR targeted site using PrimeSTAR® GXL DNA Polymerase (Clontech). Each PCR amplified region was Sanger-sequenced (Quintara Biosciences, San Francisco) to validate the targeted deletion. In addition, the PCR product was TOPO-cloned using a StrataClone Blunt PCR Cloning Kit (Agilent), and plasmids from six clones (per PCR product) was purified using QIAprep Spin Miniprep Kit (Qiagen) and sequenced using the T3 primer (Quintara Biosciences). Sequencing each clone identified a large 89 bp deletion in exon 2 of NR2F2 from chr15:96334128-96334216 ( NR2F2 GE ), as well as a 15 bp deletion in exon 2 of HEY2 from chr6:125751839-125751854 ( HEY2 GE ) (Supplementary Fig. 4B ). NR2F2 GE2 , TBX5 GE2 , and HEY2 GE2 lines were created using the background corresponding NR2F2 GE1 , TBX5 GE1 , and HEY2 GE1 cell lines. Two CRISPR guide-RNAs targeting sequences upstream of each exon (NR2F2: CAAACTGCCCCAACCGGAGT and ATTTGCTCCAACTCCGGTTG, TBX5: GTTGGCGCCATTGGGCAACC and TCACATGTGGTTGGCGCCAT, HEY2: AGTTGGGATTGTCTAGTGAG and GTTGGGATTGTCTAGTGAGA), as well as two guide-RNAs targeting sequences downstream of each exon (NR2F2: CAAGTTGTTCTGACCGACAC and AGCTAGAGGTACATAGACAC, TBX5: CAAGGCGAATTTAGAGGGCG and GCGGGGAGCAGGGTTTTATC, HEY2: AATGGCAGGATTGAACTCGT and TAATGGCAGGATTGAACTCG) were used to create large deletions within each transcr-iption factor using the same protocol outlined above. Clones were picked, and sequence verified to reveal successful excision of each exon. PCR was also used to verify deletions (using the primers: NR2F2: NR2F2-FGATCGTGGACGCCATTAC NR2F2-R GTGCGTTTCCATCATCTTTG, TBX5: TBX5-F TTAGCACCAGCTTCCAATC TBX5-R GTTCTCTCTTCCTCTTTCCTTC, HEY2: HEY2-F TTTGCTGTGGTGATCTTAGG HEY2-R ATTACCTCTAACCTCCTGTTTATG) within each region targeted (Supplementary Fig. 4C ).
Immunocytochemistry and immunohistochemistry
Human heart atrial and ventricular tissue was acquired under Stanford IRB approval. A 0.5 cm 2 piece of heart tissue was placed in 3.8% formalin for 5 h. After 5 h, samples were stored at 4°C in PBS and submitted to the Department of Comparative Medicine’s Histology Lab for paraffin embedding and tissue sectioning. 10 µM sections were fluorescently labeled as previously described 42 using the antibodies ATTO ® 550 conjugated anti-MLC2V (1:200, MYL2 : 310-111AT2, Synaptic Systems) and ATTO ® 647 N conjugated anti-MLC2A (1:200, MYL7 : 310-011AT1, Synaptic Systems). Sections were also stained using DAPI (1:1000) and imaged using a confocal microscope (Zeiss LSM-510) in the Neuroscience Microscopy Service Facility (Stanford University). hiPSC-CMs were trypsinized after cardiac differentiation (day 9) and seeded onto Matrigel®-coated 35 mm coverslips. hiPSC-CMs were maintained in RMPI/B27 media until day 14, day 30, or day 90 after differentiation and fixed using ice-cold 80% methanol/20% acetone at 4 °C for 20 min. Cells were rinsed with PBS for 5 min (repeated three times) and blocked using 3% Bovine Serum Albumin (BSA; BP1600-100, Fischer BioReagents). Cells were labeled with the same antibodies and concentrations used to label from the heart tissue immunohistochemistry section above. Single-cell CyTOF analysis of hESC-CM differentiation Human ESC-CMs (HES3, WiCell) 43 were collected at the indicated time points, labeled with IdU to assess cell proliferation, and with cisplatin for live–dead cell discrimination as previously described 44 , 45 (Supplementary Fig. 5A ). Cells were then treated with 1 × TrypLE (Invitrogen) for 4 min at 37°C, dissociated into single-cell suspension by trituration, filtered through a 40 um filter and fixed with 1.6% paraformaldehyde at room temperature for 10 min followed by two washes with Cell Staining Medium (CSM, PBS containing 0.5% BSA). Formaldehyde-fixed cell samples from different time points were individually mass tag barcoded as previously described 46 . Individual samples were then pooled and incubated with metal-conjugated antibodies against surface markers for 1 h, washed once with CSM, permeabilized with methanol on ice for 15 min, washed twice with CSM and then incubated with metal-conjugated antibodies against intracellular molecules for 1 h. Cells were washed once with CSM, and incubated at room temperature for 20 min with an iridium-containing DNA intercalator (Fluidigm) in PBS containing 1.6% paraformaldehyde. After intercalation/fixation, the cell samples were washed once with CSM and twice with water before measurement on a CyTOF mass cytometer (Fluidigm). Normalization for detector sensitivity was performed as previously described 47 . After measurement and normalization, the individual FCS files were analyzed by first gating out doublets, debris and dead cells based on cell length, DNA content, and cisplatin staining. viSNE maps were generated with software tools available at www.cytobank.org using the indicated markers to perform clustering 48 . Ratiometric Ca 2+ transient imaging Differentiated beating hiPSC-CMs were dissociated by Accutase and replated in Matrigel (BD Bioscience) pre-coated 25 mm round cover glass (Warner Scientific Inc.). Cells were recovered for 3-4 days. For Fura-2 AM imaging, cells were loaded with 10 µM Fura-2 AM (stock solution of Fura-2 AM was pre-dissolved in 20% Pluronic F-127 solution in DMSO) in Tyrode’s solution (140 mM NaCl, 1 mM MgCl 2 , 5.4 mM KCl, 1.8 mM CaCl 2 , 10 mM glucose, and 10 mM Hepes pH = 7.4 with NaOH at RT) for 30 min at room temperature. To pace cells, we used a custom-made LabView script to generate pulse waveforms with a stimulus isolation unit (Warner Scientific Inc. SIU-102) that generates pulse signals to stimulate hiPSC-CMs in the imaging chamber (Warner Scientific Inc. RC-21BRFS). Cell samples were activated with Lamda-4 light source (Sutter) with fast switching between 340 and 380 nm wavelength, and the emission signals were recorded with high-frame rate EMCCD (Andor iXon Ultra897) that was connected to a reverse fluorescence microscope (Nikon. Ti-S) with a 40X oil immersed objective (CFI Plan Fluor 40 × , NA 0.75). Signaling was captured in fast frame rate video mode (512 × 512 frame) at a speed of 50 fps. For data analysis, a custom-made script with Mat-lab was used. Transient amplitude was expressed as R340/R380.
Electrophysiological recordings
The whole-cell patch clamp recordings were performed using the standard patch clamp technique as previously described 14 . Briefly, contracting monolayers of control and knockouts of NR2F2 , HEY2 , and TBX5 hiPSC-CMs from days 30–40 were enzymatically dispersed into single cells using Accutase, and attached to Matrigel-coated glass coverslips (Warner Instruments) in RPMI medium supplemented with B27. After 72 h of incubation, action potentials were recorded from single cells in the current clamp mode at 36–37 °C, using an EPC-10 patch-clamp amplifier (HEKA, Lambrecht, Germany) attached to a RC-26C recording chamber (Warner Instruments) and mounted onto the stage of an inverted microscope (Nikon, Tokyo, Japan). The single cells were paced at constant pacing rate of 1 Hz using a 5–20 ms depolarizing current injections of 150–550 pA. The glass pipettes were fabricated from standard wall borosilicate glass capillary tubes (BF 100-50-10, Sutter Instruments) using a P-97 Sutter micropipette puller, and fire polished with a microforge (Narishige, MF830, Japan) to generate electrodes with tip resistances from 2-4 MΩ. Attached cells on coverslips were continuously perfused with the extracellular solution containing (in mM) 150 NaC1, 5.4 KCl, 1.8 CaCl 2 , 1.0 MgCl 2 , 15 HEPES, 15 glucose, and 1 sodium pyruvate (pH adjusted to 7.4 with NaOH). The intracellular solution contained (in mM): 120 KCl, 1 MgCl 2 , 10 HEPES, 3 Mg-ATP, and 10 EGTA (pH adjusted to 7.2 with KOH). Data were acquired using PatchMaster software (HEKA), digitized at 1.0 kHz, and analyzed using FitMaster (HEKA, Germany), Igor Pro (Wave Metrics) and Origin 2016 (OriginLab, Northampton, MA). All data were expressed as mean ± S.E.M., and statistical significance was determined using one-way ANOVA, with the significance level set at P < 0.05. We used the APD 90 /APD 50 ratio, which describes the shape of the repolarization curve, to determine the specific subtype of each hiPSC-CM 49 . hiPSC-CMs with low APD 90 /APD 50 ratios ( < 1.4, indicative of a pronounced plateau phase) were classified as ventricular-like, whereas those with high APD 90 /APD 50 ratios ( > 1.7, indicative of fast phase-I repolarization) were classified as atrial-like. Cardiomyocytes with AP characteristics intermediate between those of the atrial-like and ventricular-like cells, with APD 90 /APD 50 ratios between 1.4 and 1.7 were classified as nodal-like 14 , 49 – 53 . In addition to the above criteria, to categorize hiPSC-CMs into each subtype, action potential morphology was also considered. For example, action potential morphology/phenotype with a negative diastolic membrane potential, a rapid AP upstroke, and a long plateau phase was characteristic of ventricular-like APs. The absence of a prominent plateau phase was a characteristic of atrial-like APs, resulting in shorter AP duration compared to ventricular-like AP. Nodal-like APs showed a more positive MDP, a slower AP upstroke, and a prominent phase 4 depolarization 54 .
Electronic supplementary material Supplementary Information Description of Additional Supplementary files Supplementary Data 1 Supplementary Data 2 Reporting Summary
Electronic supplementary material Supplementary Information accompanies this paper at 10.1038/s41467-018-07333-4.
📊 Figures
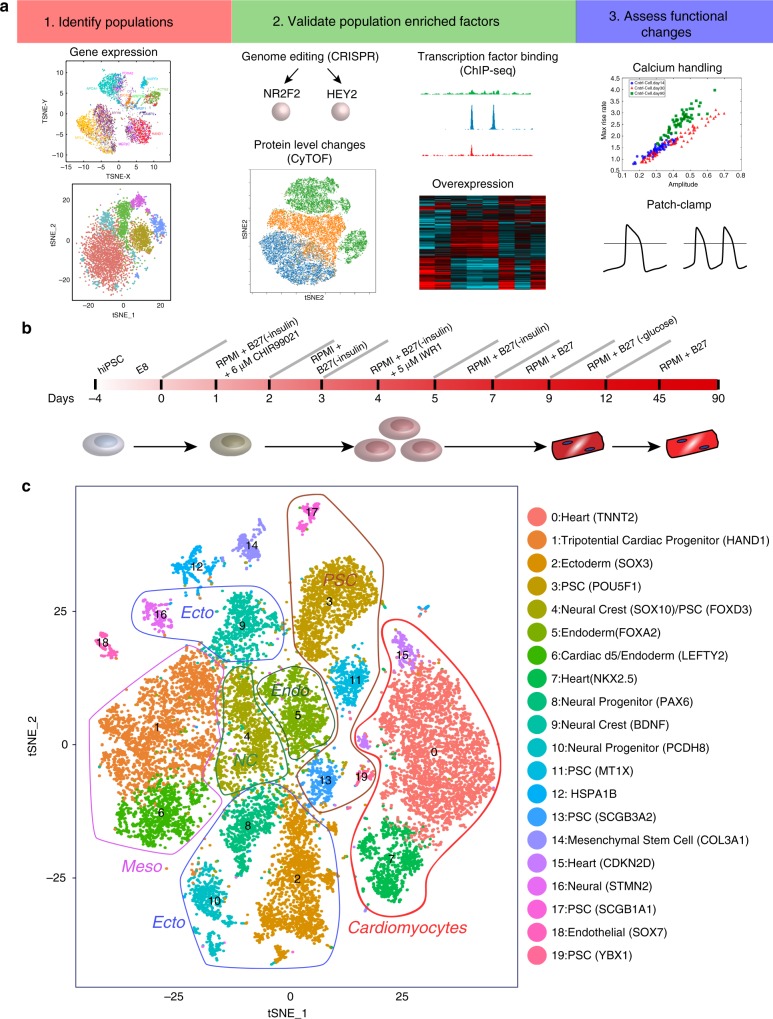
Fig. 1
Identification of hiPSC-CM subpopulations by single-cell RNA-seq. a Integrative analytical workflow for identifying distinct cellular populations from single-cell RNA-seq analyses. Associated signatur...
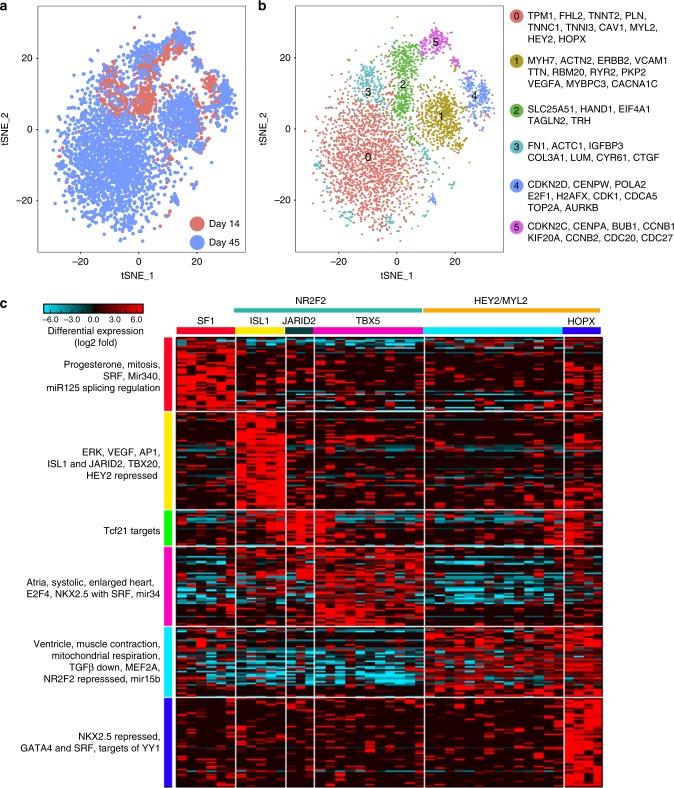
Fig. 2
Single-cell RNA-seq identified subpopulations of cardiomyocytes. a Late stage cardiomyocytes (4,689u00a0cells with TNNT2 and ACTC1 expression from day 14 and day 45) were further resolved using ICGS t...
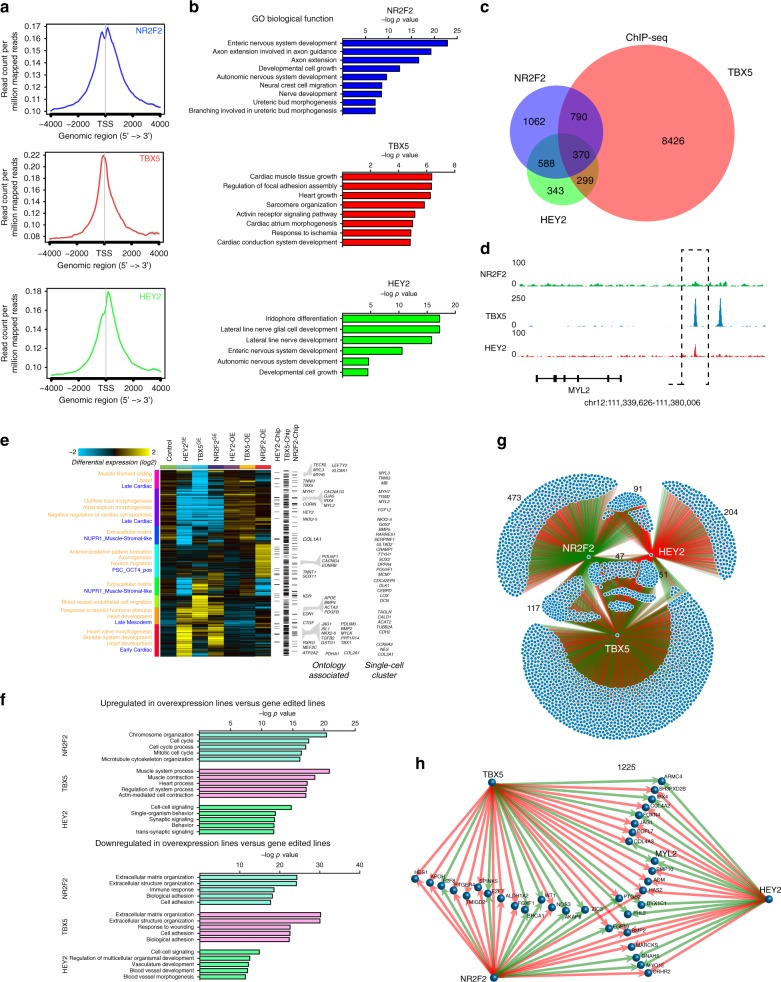
Fig. 3
Transcriptome interactions between key transcription factors that regulate hiPSC-CM populations. ChIP-seq was performed on transcription factors ( NR2F2, TBX5 , and HEY2 ) enriched within three hiPSC-...
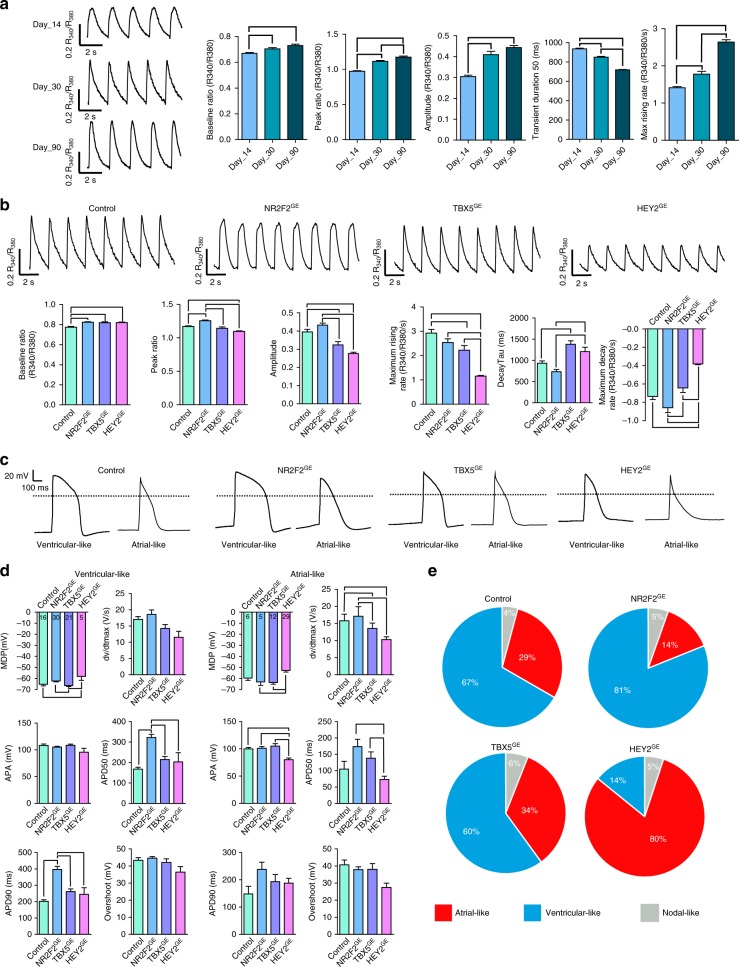
Fig. 4
NR2F2, TBX5 , and HEY2 influence the electrophysiological properties of hiPSC-CM lines. a Representative traces of calcium imaging on hiPSC-CMs cultured for 14, 30, or 90 days in culture; over time, m...
Figure images are served from the NIH/NLM PubMed Central Open Access Subset or Europe PMC; copyright remains with the publishers and authors.
💬 Discussion
0 commentsNo comments yet. Be the first to start a discussion!
Leave a Comment