Abstract
The eukaryotic replisome, organized around the Cdc45-MCM-GINS (CMG) helicase, orchestrates chromosome replication. Multiple factors associate directly with CMG, including Ctf4 and the heterotrimeric fork protection complex (Csm3/Tof1 and Mrc1), which has important roles including aiding normal replication rates and stabilizing stalled forks. How these proteins interface with CMG to execute these functions is poorly understood. Here we present 3 to 3.5 Å resolution electron cryomicroscopy (cryo-EM) structures comprising CMG, Ctf4, and the fork protection complex at a replication fork. The structures provide high-resolution views of CMG-DNA interactions, revealing a mechanism for strand separation, and show Csm3/Tof1 "grip" duplex DNA ahead of CMG via a network of interactions important for efficient replication fork pausing. Although Mrc1 was not resolved in our structures, we determine its topology in the replisome by cross-linking mass spectrometry. Collectively, our work reveals how four highly conserved replisome components collaborate with CMG to facilitate replisome progression and maintain genome stability.
🔬 Techniques
🔭 Microscopes
🧬 Organisms
💻 Software
✨ Fluorophores
🧪 Sample Preparation
🔬 Cell Lines
🏭 Microscope Brands
🧪 Reagent Suppliers
📷 Detectors
💻 Software Details
💾 Data Repositories
🏷️ Research Resource Identifiers (RRIDs)
Verified research resources used in this paper:
🏛️ Research Organizations (ROR)
Affiliated research institutions:
📋 Methods
Key Resources Table REAGENT or RESOURCE SOURCE IDENTIFIER Antibodies α-Csm3
Maric et al., 2014 N/A α-Ctf4 Maric et al., 2014 N/A α-FLAG Sigma Cat# A8592; RRID: AB_439702 α-Mcm7 Maric et al., 2014 N/A α-Mrc1 Mukherjee and Labib, 2019 N/A α-RFA Agrisera Cat# AS07 214; RRID: AB_1031803 α-Psf1 Maric et al., 2014 N/A Bacterial and Virus Strains 5-alpha Competent E. coli (High Efficiency) New England Biolabs Cat# C2987H Escherichia coli : Rosetta 2(DE3) strain: F - ompT hsdS B (r B - m B - ) gal dcm (DE3) pRARE2 (Cam R ) Novagen / Merck Millipore Cat# 71400 Chemicals, Peptides, and Recombinant Proteins 3X FLAG peptide Sigma Cat# F4799 Adenosine 5′-(β,γ-imido)triphosphate lithium salt hydrate (AMP-PNP) Sigma Cat# A2647 dNTP set Invitrogen Cat# 10297018 NTP set Invitrogen Cat# R0481 [alpha-P32]dCTP Hatmann analytic Cat# SRP-205 Anti-FLAG M2 affinity gel Sigma Cat# A2220 Bio-Gel HT (Hydrated) Hydroxyapatite Bio-Rad Cat# 130-0150 Calmodulin-Sepharose 4B GE Healthcare Cat# 17-0529-01 Camptothecin, Camptotheca acuminata Merck Cat# 208925 cOmplete, EDTA-free Roche Cat# 5056489001 Disuccinimidyl dibutyric urea (DSBU) ThermoScientific Cat# A35459 Glutaraldehyde Sigma Cat# G5882 Nonidet P-40 substitute (NP-40-S) Roche Cat# 11754599001 Glutathione Sepharose 4B GE Healthcare Cat# 17-0756-01 HiTrap Blue HP GE Healthcare Cat# 17-0412-01 HiTrap DEAE Fast Flow GE Healthcare Cat# 17-5055-01 HiTrap Heparin HP GE Healthcare Cat# 17-0406-01 HiTrap SP HP GE Healthcare Cat# 29-0513-24 IgG Sepharose Fast Flow GE Healthcare Cat# 17-0969-01 Micro SpinColumn, C18 column Harvard Apparatus Cat# 74-4607 MonoQ PC 1.6/5 GE Healthcare Cat# 17-0671-01 MonoQ 5/50 GL GE Healthcare Cat# 17-5166-01 MonoS 5/50 GL GE Healthcare Cat# 17-5168-01 Ni-NTA Agarose QIAGEN Cat# 30210 Phosbind acrylamide APExBIO Cat# F4002 Sephacryl™ S400 High Resolution GE Healthcare Cat# GE27-5330-02 Suberic acid bis(3-sulfo-N-hydroxysuccinimide ester) sodium salt (BS 3 ) Sigma Cat# S5799 Superdex 200 Increase 10/300 GL GE Healthcare Cat# 28-9909-44 Superose™ 6 Increase 10/300 GL GE Healthcare Cat# 29-0915-96 TWEEN® 20 (used for buffer exchange prior to cryo-EM grid preparation) Sigma Cat# P8341 Microspin G-50 columns GE Healthcare Cat# GE27-5330-02 Recombinant Proteins (see also Table S5 ) Cdt1-Mcm2-7 Coster et al., 2014 N/A ORC Frigola et al., 2013 N/A Cdc6 Frigola et al., 2013 N/A DDK On et al., 2014 N/A Sld3/7 Yeeles et al., 2015 N/A Cdc45 Yeeles et al., 2015 N/A Dpb11 Yeeles et al., 2015 N/A Sld2 Yeeles et al., 2015 N/A GINS Yeeles et al., 2015 N/A Pol ε Yeeles et al., 2015 N/A S-CDK Yeeles et al., 2015 N/A Mcm10 Yeeles et al., 2015 N/A Pol α Yeeles et al., 2015 N/A Ctf4 Yeeles et al., 2015 N/A RPA This study N/A Mrc1 This study N/A Csm3/Tof1 This study N/A RFC Yeeles et al., 2017 N/A PCNA Yeeles et al., 2017 N/A Pol δ Yeeles et al., 2017 N/A Fob1 This study N/A Csm3-2A/Tof1 This study N/A Csm3-5A/Tof1 This study N/A Csm3/Tof1-3A This study N/A Csm3-2A/Tof1-3A This study N/A Csm3-5A/Tof1-3A This study N/A Lambda phosphatase He Laboratory N/A Bovine Serum Albumin Invitrogen Cat# AM2616 Deposited Data Co-ordinate file for conformation 1 (CMG-Csm3-Tof1-Ctf4 3 -fork DNA, reconstituted sample) This study PDB: 6SKL Co-ordinate file for conformation 2 (MCM C-Tier-ssDNA, reconstituted sample) This study PDB: 6SKO Map of conformation 1 (CMG-Csm3-Tof1-Ctf4-fork DNA, reconstituted sample) This study EMDB: EMD-10227 Map of conformation 2 (multi-body refinement of MCM[C-tier], reconstituted sample) This study EMDB: EMD-10230 Map used in building Csm3-Tof1 atomic model (multi-body refinement of Csm3-Tof1[body]-Mcm467[NTier], reconstituted sample) This study EMDB: EMD-10507 Map used in building Csm3-Tof1 atomic model (multi-body refinement of Tof1[head]-Mcm235[NTier], reconstituted sample) This study EMDB: EMD-10508 Map of conformation 1 (multi-body refinement of Cdc45-GINS-Ctf4, reconstituted sample) This study EMDB: EMD-10509 Map of conformation 1 (multi-body refinement of Mcm2356, reconstituted sample) This study EMDB: EMD-10510 Map of conformation 1 (multi-body refinement of Mcm47, reconstituted sample) This study EMDB: EMD-10511 Map of conformation 2 (multi-body refinement of Mcm25 + Mcm6 CTD, 5 AMP-PNP bound, reconstituted sample) This study EMDB: EMD-10730 Experimental Models: Organisms/Strains S. cerevisiae strains are detailed in Table S4 N/A N/A Oligonucleotides Fork leading strand: 5′-(Cy3)TAGAGTAGGAAGTGA(Biotinylated-dT)GGTAA GTGATTAGAGAATTGGAGAGTGTG(T) 34 T ∗ T ∗ T ∗ T ∗ T ∗ T ( ∗ -phosphorothioate) Integrated DNA Technologies (IDT) N/A Fork lagging strand: GGCAGGCAGGCAGGCACACACTCTCC AATTCTCT AATCACTTACCA(Biotinylated-dT)CACTT CCTACTCTA Integrated DNA Technologies (IDT) N/A Recombinant DNA (See also Table S3 ) vVA20 (replication/recruitment assay template) Aria and Yeeles, 2018 N/A ZN5 (replication assay) Taylor and Yeeles, 2018 N/A pAM3 (Cdc6 purification) Frigola et al., 2013 N/A pJFDJ5 (GINS purification) Yeeles et al., 2015 N/A pET28a-Mcm10 (Mcm10 purification) Yeeles et al., 2015 N/A vJY19 (PCNA purification) Yeeles et al., 2017 N/A vJY23 (Psf1, Sld5) This study N/A vJY24 (Psf2, Psf3) This study N/A vJY25 (Fob1) This study N/A vJY30 (RFB template) This study N/A vJY71 (Cdc45, Ctf4) This study N/A vJY72 (Csm3, Tof1) This study N/A vJY74 (Mrc1) This study N/A vJY111 (Rfa1) This study N/A vJY113 (Csm3 R49A, K53A -Tof1) This study N/A vJY114 (Csm3-Tof1 K400A, R401A, K404A ) This study N/A vJY115 (Csm3 R49A, K53A -Tof1 K400A, R401A, K404A ) This study N/A vJY116 (Csm3 K47A, R48A, R49A, Q51A, K53A -Tof1) This study N/A vJY117 (Csm3 K47A, R48A, R49A, Q51A, K53A -Tof1 K400A, R401A, K404A ) This study N/A vVA30 (Parent vector for Tof1 mutagenesis) This study N/A vVA31 (Construction of Tof1-3A strains) This study N/A vVA32 (Parent vector for Csm3 mutagenesis) This study N/A vJY136 (Construction of Csm3-5D strains) This study N/A vJY137 (Construction of Csm3-5A strains) This study N/A Software and Algorithms CCP-EM (dev1.2.0) CCP-EM https://www.ccpem.ac.uk/ Chimera (v1.13) UCSF Resource for Biocomputing, Visualization, and Informatics https://www.cgl.ucsf.edu/chimera/ ChimeraX (v0.91) UCSF Resource for Biocomputing, Visualization, and Informatics https://www.cgl.ucsf.edu/chimerax/ Coot (v0.9-pre) Paul Emsley (Medical Research Council Laboratory of Molecular Biology) https://www2.mrc-lmb.cam.ac.uk/personal/pemsley/coot/ EMAN (v1.9) Baylor College of Medicine https://cryoem.bcm.edu/downloads/view_eman1_versions EPU (v1.9.1 & AutoCTF) ThermoFisher Scientific (FEI) https://www.fei.com/software/epu-automated-single-particles-software-for-life-sciences/ ESPript (v3.0.7) Patrice Gouet (Lyon University); Xavier Robert (Centre national de la recherche scientifique) http://espript.ibcp.fr/ESPript/ESPript/ FIJI (v1.0) National Institute of Health https://imagej.net/Fiji/Downloads Gautomatch (v0.53) Kai Zhang (Medical Research Council Laboratory of Molecular Biology) https://www.mrc-lmb.cam.ac.uk/kzhang/Gautomatch/ Gctf (v0.50) Kai Zhang (Medical Research Council Laboratory of Molecular Biology) https://www.mrc-lmb.cam.ac.uk/kzhang/Gctf/ ImageJ (v1.50i) National Institute of Health https://imagej.nih.gov/ij/ ISOLDE (v1.0b4) Tristan Croll (Cambridge Institute for Medical Research) https://isolde.cimr.cam.ac.uk/ Jalview (2.12.2b2) Barton Group, University of Dundee https://www.jalview.org/ MacPyMOL (v1.8.6.0) Schrödinger https://pymol.org/2/ MeroX Michael Götze (ETH Zürich Institute of Molecular Systems Biology) http://www.stavrox.com/ MolProbity Duke Univeristy http://molprobity.biochem.duke.edu/ MotionCor2 (v1) University of California San Francisco (UCSF) EM Core https://emcore.ucsf.edu/ucsf-motioncor2 MSConvert ProteoWizard http://proteowizard.sourceforge.net/index.html MUSCLE European Molecular Biology Laboratory -European Bioinformatics Institute (EMBL-EBI) https://www.ebi.ac.uk/Tools/msa/muscle/ PDBePISA (v1.48) European Molecular Biology Laboratory -European Bioinformatics Institute (EMBL-EBI) https://www.ebi.ac.uk/pdbe/pisa/ Phenix (v1.16-3549) Cambridge University; Duke University; Lawrence Berkeley National Laboratory; Los Alamos National Laboratory https://www.phenix-online.org/ Photoshop CC 2018 Adobe https://www.adobe.com/uk/products/photoshop.html Phyre2 Structural Bioinformatics Group, Imperial College London http://www.sbg.bio.ic.ac.uk/∼phyre2/ Prism (v8.0.0) GraphPad https://www.graphpad.com/scientific-software/prism/ ProSMART (v0.856) Garib Murshudov (Medical Research Council Laboratory of Molecular Biology) https://www2.mrc-lmb.cam.ac.uk/groups/murshudov/content/prosmart/documentation.html Refmac (v5.8.0238) Garib Murshudov (Medical Research Council Laboratory of Molecular Biology) https://www2.mrc-lmb.cam.ac.uk/groups/murshudov/content/refmac/refmac.html RELION (v2.1 & v3.0.6) Sjors Scheres (Medical Research Council Laboratory of Molecular Biology) https://www3.mrc-lmb.cam.ac.uk/relion/ Xcalibur™ ThermoFisher Scientific https://www.thermofisher.com/order/catalog/product/OPTON-30965#/OPTON-30965 Xlink Analyzer (v1.1.4 dev29012020) European Molecular Biology Laboratory (EMBL) - Hamburg https://www.embl-hamburg.de/XlinkAnalyzer/XlinkAnalyzer.html XMIPP Centro Nacional de Biotecnologia (CNB) Instruct Image Processing Centre (I2PC) http://xmipp.i2pc.es/ Other QUANTIFOIL Copper 400 mesh R2/2 holey carbon TEM grids Electron Microscopy Sciences Cat# Q450CR2 Resource Availability Lead Contact Further information and requests for resources and reagents should be directed to and will be fulfilled by the Lead Contact, Joseph Yeeles ( jyeeles@mrc-lmb.cam.ac.uk ).
Show full methods section
Key Resources Table REAGENT or RESOURCE SOURCE IDENTIFIER Antibodies α-Csm3
Maric et al., 2014 N/A α-Ctf4 Maric et al., 2014 N/A α-FLAG Sigma Cat# A8592; RRID: AB_439702 α-Mcm7 Maric et al., 2014 N/A α-Mrc1 Mukherjee and Labib, 2019 N/A α-RFA Agrisera Cat# AS07 214; RRID: AB_1031803 α-Psf1 Maric et al., 2014 N/A Bacterial and Virus Strains 5-alpha Competent E. coli (High Efficiency) New England Biolabs Cat# C2987H Escherichia coli : Rosetta 2(DE3) strain: F - ompT hsdS B (r B - m B - ) gal dcm (DE3) pRARE2 (Cam R ) Novagen / Merck Millipore Cat# 71400 Chemicals, Peptides, and Recombinant Proteins 3X FLAG peptide Sigma Cat# F4799 Adenosine 5′-(β,γ-imido)triphosphate lithium salt hydrate (AMP-PNP) Sigma Cat# A2647 dNTP set Invitrogen Cat# 10297018 NTP set Invitrogen Cat# R0481 [alpha-P32]dCTP Hatmann analytic Cat# SRP-205 Anti-FLAG M2 affinity gel Sigma Cat# A2220 Bio-Gel HT (Hydrated) Hydroxyapatite Bio-Rad Cat# 130-0150 Calmodulin-Sepharose 4B GE Healthcare Cat# 17-0529-01 Camptothecin, Camptotheca acuminata Merck Cat# 208925 cOmplete, EDTA-free Roche Cat# 5056489001 Disuccinimidyl dibutyric urea (DSBU) ThermoScientific Cat# A35459 Glutaraldehyde Sigma Cat# G5882 Nonidet P-40 substitute (NP-40-S) Roche Cat# 11754599001 Glutathione Sepharose 4B GE Healthcare Cat# 17-0756-01 HiTrap Blue HP GE Healthcare Cat# 17-0412-01 HiTrap DEAE Fast Flow GE Healthcare Cat# 17-5055-01 HiTrap Heparin HP GE Healthcare Cat# 17-0406-01 HiTrap SP HP GE Healthcare Cat# 29-0513-24 IgG Sepharose Fast Flow GE Healthcare Cat# 17-0969-01 Micro SpinColumn, C18 column Harvard Apparatus Cat# 74-4607 MonoQ PC 1.6/5 GE Healthcare Cat# 17-0671-01 MonoQ 5/50 GL GE Healthcare Cat# 17-5166-01 MonoS 5/50 GL GE Healthcare Cat# 17-5168-01 Ni-NTA Agarose QIAGEN Cat# 30210 Phosbind acrylamide APExBIO Cat# F4002 Sephacryl™ S400 High Resolution GE Healthcare Cat# GE27-5330-02 Suberic acid bis(3-sulfo-N-hydroxysuccinimide ester) sodium salt (BS 3 ) Sigma Cat# S5799 Superdex 200 Increase 10/300 GL GE Healthcare Cat# 28-9909-44 Superose™ 6 Increase 10/300 GL GE Healthcare Cat# 29-0915-96 TWEEN® 20 (used for buffer exchange prior to cryo-EM grid preparation) Sigma Cat# P8341 Microspin G-50 columns GE Healthcare Cat# GE27-5330-02 Recombinant Proteins (see also Table S5 ) Cdt1-Mcm2-7 Coster et al., 2014 N/A ORC Frigola et al., 2013 N/A Cdc6 Frigola et al., 2013 N/A DDK On et al., 2014 N/A Sld3/7 Yeeles et al., 2015 N/A Cdc45 Yeeles et al., 2015 N/A Dpb11 Yeeles et al., 2015 N/A Sld2 Yeeles et al., 2015 N/A GINS Yeeles et al., 2015 N/A Pol ε Yeeles et al., 2015 N/A S-CDK Yeeles et al., 2015 N/A Mcm10 Yeeles et al., 2015 N/A Pol α Yeeles et al., 2015 N/A Ctf4 Yeeles et al., 2015 N/A RPA This study N/A Mrc1 This study N/A Csm3/Tof1 This study N/A RFC Yeeles et al., 2017 N/A PCNA Yeeles et al., 2017 N/A Pol δ Yeeles et al., 2017 N/A Fob1 This study N/A Csm3-2A/Tof1 This study N/A Csm3-5A/Tof1 This study N/A Csm3/Tof1-3A This study N/A Csm3-2A/Tof1-3A This study N/A Csm3-5A/Tof1-3A This study N/A Lambda phosphatase He Laboratory N/A Bovine Serum Albumin Invitrogen Cat# AM2616 Deposited Data Co-ordinate file for conformation 1 (CMG-Csm3-Tof1-Ctf4 3 -fork DNA, reconstituted sample) This study PDB: 6SKL Co-ordinate file for conformation 2 (MCM C-Tier-ssDNA, reconstituted sample) This study PDB: 6SKO Map of conformation 1 (CMG-Csm3-Tof1-Ctf4-fork DNA, reconstituted sample) This study EMDB: EMD-10227 Map of conformation 2 (multi-body refinement of MCM[C-tier], reconstituted sample) This study EMDB: EMD-10230 Map used in building Csm3-Tof1 atomic model (multi-body refinement of Csm3-Tof1[body]-Mcm467[NTier], reconstituted sample) This study EMDB: EMD-10507 Map used in building Csm3-Tof1 atomic model (multi-body refinement of Tof1[head]-Mcm235[NTier], reconstituted sample) This study EMDB: EMD-10508 Map of conformation 1 (multi-body refinement of Cdc45-GINS-Ctf4, reconstituted sample) This study EMDB: EMD-10509 Map of conformation 1 (multi-body refinement of Mcm2356, reconstituted sample) This study EMDB: EMD-10510 Map of conformation 1 (multi-body refinement of Mcm47, reconstituted sample) This study EMDB: EMD-10511 Map of conformation 2 (multi-body refinement of Mcm25 + Mcm6 CTD, 5 AMP-PNP bound, reconstituted sample) This study EMDB: EMD-10730 Experimental Models: Organisms/Strains S. cerevisiae strains are detailed in Table S4 N/A N/A Oligonucleotides Fork leading strand: 5′-(Cy3)TAGAGTAGGAAGTGA(Biotinylated-dT)GGTAA GTGATTAGAGAATTGGAGAGTGTG(T) 34 T ∗ T ∗ T ∗ T ∗ T ∗ T ( ∗ -phosphorothioate) Integrated DNA Technologies (IDT) N/A Fork lagging strand: GGCAGGCAGGCAGGCACACACTCTCC AATTCTCT AATCACTTACCA(Biotinylated-dT)CACTT CCTACTCTA Integrated DNA Technologies (IDT) N/A Recombinant DNA (See also Table S3 ) vVA20 (replication/recruitment assay template) Aria and Yeeles, 2018 N/A ZN5 (replication assay) Taylor and Yeeles, 2018 N/A pAM3 (Cdc6 purification) Frigola et al., 2013 N/A pJFDJ5 (GINS purification) Yeeles et al., 2015 N/A pET28a-Mcm10 (Mcm10 purification) Yeeles et al., 2015 N/A vJY19 (PCNA purification) Yeeles et al., 2017 N/A vJY23 (Psf1, Sld5) This study N/A vJY24 (Psf2, Psf3) This study N/A vJY25 (Fob1) This study N/A vJY30 (RFB template) This study N/A vJY71 (Cdc45, Ctf4) This study N/A vJY72 (Csm3, Tof1) This study N/A vJY74 (Mrc1) This study N/A vJY111 (Rfa1) This study N/A vJY113 (Csm3 R49A, K53A -Tof1) This study N/A vJY114 (Csm3-Tof1 K400A, R401A, K404A ) This study N/A vJY115 (Csm3 R49A, K53A -Tof1 K400A, R401A, K404A ) This study N/A vJY116 (Csm3 K47A, R48A, R49A, Q51A, K53A -Tof1) This study N/A vJY117 (Csm3 K47A, R48A, R49A, Q51A, K53A -Tof1 K400A, R401A, K404A ) This study N/A vVA30 (Parent vector for Tof1 mutagenesis) This study N/A vVA31 (Construction of Tof1-3A strains) This study N/A vVA32 (Parent vector for Csm3 mutagenesis) This study N/A vJY136 (Construction of Csm3-5D strains) This study N/A vJY137 (Construction of Csm3-5A strains) This study N/A Software and Algorithms CCP-EM (dev1.2.0) CCP-EM https://www.ccpem.ac.uk/ Chimera (v1.13) UCSF Resource for Biocomputing, Visualization, and Informatics https://www.cgl.ucsf.edu/chimera/ ChimeraX (v0.91) UCSF Resource for Biocomputing, Visualization, and Informatics https://www.cgl.ucsf.edu/chimerax/ Coot (v0.9-pre) Paul Emsley (Medical Research Council Laboratory of Molecular Biology) https://www2.mrc-lmb.cam.ac.uk/personal/pemsley/coot/ EMAN (v1.9) Baylor College of Medicine https://cryoem.bcm.edu/downloads/view_eman1_versions EPU (v1.9.1 & AutoCTF) ThermoFisher Scientific (FEI) https://www.fei.com/software/epu-automated-single-particles-software-for-life-sciences/ ESPript (v3.0.7) Patrice Gouet (Lyon University); Xavier Robert (Centre national de la recherche scientifique) http://espript.ibcp.fr/ESPript/ESPript/ FIJI (v1.0) National Institute of Health https://imagej.net/Fiji/Downloads Gautomatch (v0.53) Kai Zhang (Medical Research Council Laboratory of Molecular Biology) https://www.mrc-lmb.cam.ac.uk/kzhang/Gautomatch/ Gctf (v0.50) Kai Zhang (Medical Research Council Laboratory of Molecular Biology) https://www.mrc-lmb.cam.ac.uk/kzhang/Gctf/ ImageJ (v1.50i) National Institute of Health https://imagej.nih.gov/ij/ ISOLDE (v1.0b4) Tristan Croll (Cambridge Institute for Medical Research) https://isolde.cimr.cam.ac.uk/ Jalview (2.12.2b2) Barton Group, University of Dundee https://www.jalview.org/ MacPyMOL (v1.8.6.0) Schrödinger https://pymol.org/2/ MeroX Michael Götze (ETH Zürich Institute of Molecular Systems Biology) http://www.stavrox.com/ MolProbity Duke Univeristy http://molprobity.biochem.duke.edu/ MotionCor2 (v1) University of California San Francisco (UCSF) EM Core https://emcore.ucsf.edu/ucsf-motioncor2 MSConvert ProteoWizard http://proteowizard.sourceforge.net/index.html MUSCLE European Molecular Biology Laboratory -European Bioinformatics Institute (EMBL-EBI) https://www.ebi.ac.uk/Tools/msa/muscle/ PDBePISA (v1.48) European Molecular Biology Laboratory -European Bioinformatics Institute (EMBL-EBI) https://www.ebi.ac.uk/pdbe/pisa/ Phenix (v1.16-3549) Cambridge University; Duke University; Lawrence Berkeley National Laboratory; Los Alamos National Laboratory https://www.phenix-online.org/ Photoshop CC 2018 Adobe https://www.adobe.com/uk/products/photoshop.html Phyre2 Structural Bioinformatics Group, Imperial College London http://www.sbg.bio.ic.ac.uk/∼phyre2/ Prism (v8.0.0) GraphPad https://www.graphpad.com/scientific-software/prism/ ProSMART (v0.856) Garib Murshudov (Medical Research Council Laboratory of Molecular Biology) https://www2.mrc-lmb.cam.ac.uk/groups/murshudov/content/prosmart/documentation.html Refmac (v5.8.0238) Garib Murshudov (Medical Research Council Laboratory of Molecular Biology) https://www2.mrc-lmb.cam.ac.uk/groups/murshudov/content/refmac/refmac.html RELION (v2.1 & v3.0.6) Sjors Scheres (Medical Research Council Laboratory of Molecular Biology) https://www3.mrc-lmb.cam.ac.uk/relion/ Xcalibur™ ThermoFisher Scientific https://www.thermofisher.com/order/catalog/product/OPTON-30965#/OPTON-30965 Xlink Analyzer (v1.1.4 dev29012020) European Molecular Biology Laboratory (EMBL) - Hamburg https://www.embl-hamburg.de/XlinkAnalyzer/XlinkAnalyzer.html XMIPP Centro Nacional de Biotecnologia (CNB) Instruct Image Processing Centre (I2PC) http://xmipp.i2pc.es/ Other QUANTIFOIL Copper 400 mesh R2/2 holey carbon TEM grids Electron Microscopy Sciences Cat# Q450CR2 Resource Availability Lead Contact Further information and requests for resources and reagents should be directed to and will be fulfilled by the Lead Contact, Joseph Yeeles ( jyeeles@mrc-lmb.cam.ac.uk ).
Materials Availability
Unique and stable reagents generated in this study are available upon request.
Data and Code Availability
Cryo-EM density maps of the reconstituted complex used in model building have been deposited in the Electron Microscopy Data Bank (EMDB) under the following accession numbers: for conformation 1, EMD-10227 (full complex), EMD-10507 (Csm3-Tof1 Body -Mcm467 N-tier ), EMD-10508 (Tof1 Head -Mcm235 N-tier ), EMD-10509 (Cdc45-GINS-Ctf4 3 ), EMD-10510 (Mcm2356), EMD-10511 (Mcm47); for conformation 2, EMD-10230 (MCM C-tier ), EMD-10730 (Mcm25-Mcm6 C-tier ). Atomic coordinates have been deposited in the Protein Data Bank (PDB) with the accession numbers PDB: 6SKL (conformation 1) and PDB: 6SKO (conformation 2, MCM C-tier [5 AMP-PNP] ).
Experimental Model and Subject Details
Proteins were purified from Saccharomyces cerevisiae strains (genotype: MATa ade2-1 ura3-1 his3-11,15 trp1-1 leu2-3,112 can1-100 bar1::Hyg pep4::KanMX) containing integrated expression constructs; or from Escherichia coli RosettaTM 2(DE3) cells (Novagen) (genotype: F– ompT hsdSB(rB– mB–) gal dcm (DE3) pRARE2 (CamR)) transformed with plasmids for protein overexpression (see Key Resources Table and Tables S3–S5 for details.
Yeast strains for harboring
Csm3 and Tof1 mutations were derived from W303-1a (genotype: MATa ade2-1 ura3-1 his3-11,15 trp1-1 leu2-3,112 can1-100). Plasmids details are reported in the Key Resources Table and Table S3 .
Method Details Yeast strains
Vectors and strains were constructed using standard molecular biology techniques (see Tables S3 and S4 for details). All genes for protein expression were codon optimized as described ( Yeeles et al., 2015 ). All mutant haploid yeast strains were isolated by tetrad dissection of heterozygous diploid strains. Coding sequences for all genes were verified by sequencing, as were the coding regions of mutant alleles of Csm3 and Tof1 following PCR amplification from genomic DNA. Protein purification Cdt1⋅Mcm2-7, ORC, Cdc6, DDK, Sld3/7, Sld2, Cdc45, S-CDK, Dpb11, GINS, Pol ε, Mcm10, RPA, RFC, PCNA, Pol α, Pol δ, Csm3/Tof1 and Ctf4 were purified as previously described ( Taylor and Yeeles, 2018 , Yeeles et al., 2015 , Yeeles et al., 2017 ). An overview of the purification strategy for each protein is provided in Table S5 . RPA purification Untagged S. cerevisiae RPA was purified from a 10 L culture of yJY106. Cells were grown at 30°C to 5 x10 7 cells per ml in YEP (1.1% yeast extract, 2.2% bactopeptone, 55 mg/L adenine hemisulphate) + 2% w/v raffinose before induction by addition of galactose to 2% w/v final concentration from a 20% w/v stock. Cell growth was continued for 3 hours at 30°C before cells were harvested by centrifugation, washed in 100 mL 25 mM Tric-HCL pH 7.2, 10% glycerol, 500 mM NaCl, 1 mM Tris(2-carboxyethyl)phosphine hydrochloride (TCEP) (buffer R + 500 mM NaCl) and resuspended in buffer R. Cell paste was frozen in liquid nitrogen and cells were lysed using a pestle and mortar filled with liquid nitrogen. The lysate was cleared by centrifugation (235,000 g, 4°C, 1 hour) and nucleic acid precipitated by addition of polyethyleneimine to 0.025% from a 1% stock followed by gentle stirring at 4°C for 10 min. Precipitate was cleared by centrifugation (18,000 g, 4°C, 15 min) and solid ammonium sulfate was added slowly to 40% saturation. Following gentle stirring at 4°C for 10 min, precipitated protein was collected by centrifugation (18,000 g, 4°C, 20 min) and the precipitate resuspended in buffer R + 500 mM NaCl. The conductivity of the protein sample was adjusted to be equivalent to buffer R + 500 mM NaCl by dilution with buffer R before application to a HiTrap Blue column equilibrated in buffer R + 500 mM NaCl. All subsequent purification steps were performed as described in ( Devbhandari et al., 2017 ).
Mrc1 purification
Mrc1 was purified as previously described ( Yeeles et al., 2017 ) but with the following modifications. The growth temperature during protein expression was reduced from 30°C to 20°C. All subsequent steps were performed at 4°C. Lysed cell powder from a 10-15 L culture was resuspended in buffer M (50 mM Tris-HCl pH 8, 10% glycerol, 0.005% TWEEN 20, 0.5 mM TCEP, 400 mM NaCl) + protease inhibitors (cOmplete, EDTA-free (Roche), one tablet per 50 mL buffer). Insoluble material was cleared by centrifugation (235,000 g, 4°C, 1 hour) and 2-4 mL FLAG M2 Affinity gel (Sigma) was added to the supernatant. The sample was incubated for 100 min before the resin was collected in 20 mL columns (< 2 mL bed volume per column) and was washed with 75 mL buffer M. Columns were washed with 12.5 mL buffer M + 5 mM Mg(OAc) 2 + 0.5 mM ATP, followed by 25 mL buffer M. Mrc1 was eluted in 1 column volume (CV) buffer M + 0.2 mg/ml 3x FLAG peptide and 2 CV buffer M + 0.1 mg/ml 3x FLAG peptide. The eluate was concentrated to ∼800 μL in an Amicon Ultra-15 30,000 NMWL concentrator and applied to a Superose 6 10/300 column (GE healthcare) equilibrated in 25 mM Tris-HCl pH 7.2, 10% glycerol, 0.005% TWEEN 20, 1 mM EDTA, 0.5 mM TCEP, 150 mM NaCl. Peak fractions were pooled, frozen in liquid nitrogen and stored at −80°C. Csm3/Tof1 purification Csm3/Tof1 was purified as previously described ( Yeeles et al., 2017 ) but with the following modifications. After elution from Calmodulin Sepharose 4B (GE healthcare) by TEV cleavage the protein was applied to a 1 mL MonoQ column equilibrated in 25 mM Tris-HCl pH 7.2, 1 mM EDTA, 10% glycerol, 0.02% NP-40-S, 1 mM DTT, 200 mM NaCl. Protein was eluted with a 30 column volume gradient from 200 mM – 1M NaCl. Peak fractions were pooled, concentrated to ∼500 μL in an Amicon Ultra-15 30,000 NMWL concentrator and applied to a Superdex 200 Increase 10/300 gel filtration column equilibrated in 25 mM Tris-HCl pH 7.2, 1 mM EDTA, 10% glycerol, 0.02% NP-40-S, 1 mM DTT, 150 mM NaCl. Peak fractions were pooled, frozen in liquid nitrogen and stored at −80°C.
CMG purification
Diploid yeast (yJY37) (15-30 L) were grown at 30°C to 5 x10 7 cells per ml in YEP + 2% w/v raffinose before induction by addition of galactose to 2% w/v final concentration from a 20% w/v stock. Cell growth was continued for 3 hours at 30°C before cells were harvested by centrifugation, washed in 150 mL buffer C (40 mM HEPES-NaOH pH 7.5, 10% glycerol, 0.005% TWEEN 20, 0.5 mM TCEP, 150 mM NaOAc) and resuspended in a minimal volume of buffer C + protease inhibitors (cOmplete, EDTA-free (Roche), one tablet per 50 mL buffer). Cell paste was frozen in liquid nitrogen and cells were lysed using a pestle and mortar filled with liquid nitrogen. Lysed cell powder (typically from a 15 L culture) was resuspended in buffer C + protease inhibitors and insoluble material removed by centrifugation (235,000 g, 4°C, 1 hour). FLAG M2 Affinity gel (8 ml) was added to the lysate and incubated for 90 min at 4°C. Resin was collected in 20 mL columns (< 2 mL bed volume per column) and washed with 80 mL buffer C per column. Columns were then washed with 10 mL buffer C + 5 mM Mg(OAc) 2 + 0.5 mM ATP followed by 25 mL buffer C. Proteins were eluted with 1 CV buffer C + 2mM CaCl 2 + 0.2 mg/ml 3x FLAG peptide then 2 CV buffer C + 2mM CaCl 2 + 0.1 mg/ml 3x FLAG peptide. Calmodulin Sepharose 4B (GE healthcare) (1 ml) was immediately added to the eluate, which was incubated for 30 min before the resin was collected in a 20 mL column. The flow-through was reapplied to the column twice before washing the column with 25 CV buffer C + 2mM CaCl 2 . CMG was eluted in 8 CV of buffer C + 2 mM EDTA + 2 mM EGTA. Eluate was applied to a MonoQ PC 1.6/5 (GE healthcare) equilibrated in 25 mM Tris-HCl pH 7.2, 10% glycerol, 0.005% TWEEN 20, 0.5 mM TCEP, 150 mM KCl. CMG was eluted with a 20 CV gradient from 150-1000 mM KCl and peak fractions were dialysed overnight against 500 mL 25 mM HEPES-KOH pH 7.6, 40 mM KOAc, 40 mM K-glutamate, 2 mM Mg(OAc) 2 , 0.25 mM EDTA, 0.5 mM TCEP, 20% glycerol. Protein was frozen in liquid nitrogen and stored at −80°C. Fob1 purification yJY39 (10 L) were grown at 30°C to 4.5 x10 7 cells per ml in YEP + 2% w/v raffinose before induction by addition of galactose to 2% w/v final concentration from a 20% w/v stock. Cell growth was continued for 3 hours at 30°C before cells were harvested by centrifugation, washed in 150 mL buffer F (25 mM Tris-HCl pH 7.2, 1 mM EDTA, 10% glycerol, 0.02% NP-40-S, 0.5 mM DTT) + 400 mM NaCl and resuspended in a minimal volume of buffer F + 400 mM NaCl + protease inhibitors (cOmplete, EDTA-free (Roche), one tablet per 25 mL buffer). Cell paste was frozen in liquid nitrogen and cells were lysed using a pestle and mortar filled with liquid nitrogen. Lysed cell powder was resuspended in buffer F + 400 mM NaCl + protease inhibitors and insoluble material removed by centrifugation (235,000 g, 4°C, 1 hour). FLAG M2 Affinity gel (2.5 ml) was added to the lysate and incubated for 3 hours at 4°C. Resin was collected in a 20 mL column and washed with 80 mL buffer F + 400 mM NaCl followed by 20 mL buffer F + 200 mM NaCl. Fob1 was eluted in 8 mL buffer F + 200 mM NaCl + 0.2 mg/ml 3x FLAG peptide. The eluate was diluted in buffer F to the equivalent of 150 mM NaCl and was applied to a 1 mL MonoQ column equilibrated in buffer F + 150 mM NaCl. Protein was eluted with a 25 CV gradient from 150-1000 mM NaCl in buffer F. Peak fractions were pooled and dialysed against buffer F + 150 mM NaCl for 3 hours prior to freezing in liquid nitrogen and storage at −80°C.
Preparation of fork
DNA for cryo-EM sample preparation Fork
DNA was annealed by mixing equal volumes of Fork-Lead and Fork-Lag oligos (Integrated DNA Technologies) and allowing to cool gradually from 75°C to room temperature. The Fork-Lead and Fork-Lag stock solutions were made at 53 μM each in 25 mM HEPES-NaOH, pH 7.5, 150 mM NaOAc, 0.5 mM TCEP, 2 mM Mg(OAc) 2 . The sequence of each oligo was a modified version of the fork used in prior publication ( Georgescu et al., 2017 ); Fork-Lead was 5′-(Cy3)TAGAGTAGGAAGTGA(Biotinylated-dT)GGTAAGTG ATTAGAGAATTGGAGAGTGTG(T) 34 T ∗ T ∗ T ∗ T ∗ T ∗ T, where ∗ denotes phosphorothioate backbone linkages. Fork-Lag was 5′-GGCAGGCAGGCAGGCACACACTCTCCAATTCTCTAATCACTTACCA(Biotinylated-dT)CACTTCCTACTCTA. Glycerol 10%–30% gradient preparation For co-expression experiments, Buffer A (40 mM HEPES-NaOH, pH 7.5, 150 mM NaOAc, 0.5 mM TCEP, 10% v/v glycerol) was layered on top an equal volume of freshly prepared Buffer B (Buffer A, except 30% v/v glycerol + 0.16% glutaraldehyde [Sigma]) in a 14 mL SW40-Ti tube (Beckman) and gradients made using a gradient-making station (Biocomp Instruments, Ltd.) before cooling on ice. For in vitro reconstitution experiments, 500 μM AMP-PNP and 3 mM Mg(OAc) 2 were added to Buffers A and B. Buffer B was further supplemented with a second cross-linking agent, 2 mM bis(sulfosuccinimidyl)suberate (BS 3 , ThermoFisher Scientific). These were layered in equal volumes in a 2.2 mL TLS-55 tube (Beranek Laborgerate) and gradients prepared using a gradient-making station (Biocomp Instruments, Ltd.) before cooling on ice. In vitro reconstitution of CMG-Csm3/Tof1-Mrc1-Ctf4-DNA complexes for cryo-EM Components were sequentially mixed with CMG while on ice as follows to yield a final reaction volume of 65 μL containing 0.5 μM CMG with a 1.5 molar excess of all other components, maintaining 500 μM AMP-PNP and 3 mM Mg(OAc) 2 throughout. First, the fork DNA was added to CMG and incubated for 1 h. Subsequently, Csm3/Tof1 and Ctf4 were pre-mixed and added to the CMG:DNA reaction mixture. After 10 min incubation, Mrc1 was added for a further 45 min. Before loading onto the glycerol gradient (prepared as described above), the reaction volume was diluted 2.5-fold using buffer D (25 mM HEPES-NaOH, pH 7.5, 150 mM NaOAc, 0.5 mM TCEP, 500 μM AMP-PNP, 3 mM Mg(OAc) 2 ). The sample was separated by centrifugation (Beckman TLS-55 rotor, 200,000 g , 4°C, 2 h) and 100 μL fractions manually collected. The fraction containing the complex was identified by silver-stained SDS-PAGE. Relevant fractions were pooled (total ∼190 μL) and buffer exchanged with cryo-EM buffer (buffer D except 100 μM AMP-PNP + 0.005% v/v TWEEN 20 [Sigma, Cat#P8341]) during six rounds of ultrafiltration in 0.5 mL 30K MWCO centrifugal filters (Amicon) using a bench-top centrifuge (21,000 g, 4°C, 1 min/round). Sample was concentrated to ∼25 μL and immediately used for cryo-EM grid preparation. Co-expression and purification of CMG-Csm3/Tof1-Mrc1-Ctf4 complexes for cryo-EM Cultures of yJY74 (see Tables S4 and S5 for details) were grown in YEP with 2% w/v raffinose (15 L) at 30°C, to a density of ∼6 × 10 7 cells/mL before inducing overexpression by addition of 2% w/v galactose for 3 h under the same conditions. Cells were harvested by centrifugation (3,000 g , 8 min, 4°C), washed and resuspended with Lysis buffer (40 mM HEPES-NaOH, pH 7.5, 150 mM NaOAc, 10% glycerol, 0.005% v/v TWEEN 20, 0.5 mM TCEP, protease-inhibitors (cOmplete, EDTA-free (Roche), one tablet per 25 mL buffer)), before flash-freezing as pellets in liquid nitrogen. Cells were lysed using a Freezer/Mill (6870D SPEX Sample Prep, 2 cycles, 1 min pre-cool, 2 min run-time, 1 min cool-time, rate 10 cps) before thawing in Lysis buffer. All subsequent steps were performed at 4°C unless specified otherwise. The lysate was clarified by centrifugation (160,000 g , 45 min) and the supernatant filtered (0.45 μm PVDF syringe filters, Elkay Laboratory Products UK). The supernatant was then incubated with 8-10 mL anti-FLAG M2 affinity agarose gel (Sigma), rotating at 7 rpm for 60-90 min. The next affinity chromatography steps were done at room temperature using ice-cold buffers, unless stated otherwise. The supernatant was split between gravity flow columns (14 cm Econo-Pac, BioRad) and the flow-through re-applied once before each column was washed twice with 30 mL buffer W (40 mM HEPES-NaOH, pH 7.5, 150 mM NaOAc, 10% v/v glycerol, 0.005% v/v TWEEN 20, 0.5 mM TCEP). Each column was then washed once with 12.5 mL buffer W + 500 μM ATP + 5 mM Mg(OAc) 2 , incubating for 5 min partway through, before a final wash with 20 mL of buffer W + 2 mM CaCl 2 . Protein was eluted by successive addition of one CV buffer W + 2 mM CaCl 2 + 0.2 mg/mL 3xFLAG peptide [Sigma], followed by two CV buffer W + 2 mM CaCl 2 + 0.1 mg/mL 3xFLAG peptide, and finally one CV of buffer W + 2 mM CaCl 2 . The FLAG-eluate was pooled and incubated with up to 1.2 mL Calmodulin Sepharose 4B affinity resin (GE Healthcare), rotating at 7 rpm for 1 h at 4°C. The sample was applied to a gravity flow column (9 cm Poly-Prep Chromatography Columns, Bio-Rad) and the flow-through reapplied twice. The column was washed twice with 20 mL buffer C (25 mM HEPES-NaOH, pH 7.5, 150 mM NaOAc, 0.5 mM TCEP) + 2 mM CaCl 2 before elution using 3-5 mL buffer C + 2 mM EDTA + 2 mM EGTA. The sample was concentrated to 300 μL using 0.5 mL 30K MWCO centrifugal filters (Amicon) in a bench-top centrifuge (21,000 g , 4°C). The sample was split across two glycerol gradients prepared as described above, with one gradient containing glutaraldehyde and used for subsequent sample preparation steps, while the second gradient lacked cross-linking agents to allow assessment of complex migration. The sample was separated by centrifugation in an SW 40 Ti rotor (Beckman) at 140,000 g for 15 h at 4°C. Samples were manually fractionated in 400 μL fractions and analyzed by SDS-PAGE. The relevant fraction was buffer exchanged in buffer C + 0.005% v/v TWEEN 20 (Sigma, Cat# P8341) over six rounds of centrifugation (21,300 g , 1 min/round, 4°C) in 0.5 mL 30K MWCO centrifugal filters (Amicon). The sample was concentrated to a final volume of ∼35 μL. In early cryo-EM datasets we observed higher compositional heterogeneity of the complex likely arising from endogenous DNA co-purifying with our sample. In an attempt to overcome this, later sample preparations contained 10 μL streptavidin-blocked fork DNA added to the relevant fraction taken from glycerol gradients and incubated on ice for 15 min after gradient fixation and before buffer exchange. To prepare streptavidin-blocked fork DNA, 10 μL fork DNA (26.5 μM) was incubated with 12.5 μL tetravalent streptavidin (21 μM, Pierce) at room temperature for 40 min prior to addition of DNA to a purified replisome. The addition of DNA after the final centrifugation step did not alter DNA homogeneity in our cryo-EM reconstructions, and therefore data obtained from samples prepared with and without added streptavidin-blocked fork DNA were combined during processing. Co-expression and purification of non-cross-linked CMG-Csm3/Tof1-Mrc1-Ctf4 complexes for cryo-EM One sample was prepared as described for the co-expressed sample above (with SA-blocked fork DNA added) except with cross-linker omitted from the glycerol gradient. This was used to assess the impact of cross-linker on the architecture of the complex ( Figure S3 I).
Cryo-EM grid preparation
Reconstituted and co-expressed complex Quantifoil R2/2, Cu-400 mesh cryo-EM grids pre-coated with an ultra-thin (3-5 nm) amorphous carbon (produced at the LMB) were glow discharged for 5 s at a plasma current of 15 mA (PELCO easiGlow). Sample (3 μL) was applied and incubated for 15-30 s at 4°C before manually blotting with filter paper for 10 s and plunge-freezing in liquid ethane (approx. −180°C).
Data collection Reconstituted sample
A total of 6,878 raw micrographs were acquired across two datasets on the same 300 keV FEI Titan Krios microscope (LMB Krios3) at a calibrated pixel size of 1.049 Å/pixel (nominal magnification of 130,000 X). The K2 Summit direct electron detector (Gatan) was used in electron counting mode with a GIF Quantum energy filter slit width of 20 eV. EPU (ThermoFisher) was used for automated data collection, with a defocus range set at −1.4 to −2.6 μm and dose-fractionation into 20 fractions per movie, with a total exposure time of 7-8 s to achieve a dose of 37-38 e - /Å 2 per micrograph. Co-expressed sample Six datasets were collected totaling 11,637 raw micrographs. The 300 keV FEI Titan Krios microscopes (LMB Krios1 and Krios2, eBIC Krios M03 and ESRF Krios1) were used with either a Falcon III direct electron detector (FEI) or a K2 Summit direct electron detector (Gatan), both in electron counting mode. The data were acquired at several magnifications ranging from 1.05-1.07 Å/pixel. EPU (ThermoFisher) was used for automated data collection with a defocus range set to −1.5 to −3 μm. For data acquired with a Falcon III detector the acquisition was dose-fractionated into 180 fractions with an exposure time of 44 s per micrograph and a dose of 0.82 - 0.84 e - /pixel/s. Data collected with a K2 camera were dose-fractionated into 20 fractions with a total exposure time of 6-8 s to achieve a dose per micrograph of 37-43 e - /Å 2 . The slit width of the GIF Quantum energy filter was set to 20 eV. Co-expressed sample prepared without cross-linking A single dataset of 2,527 raw micrographs was collected on a 300 keV Titan Krios microscope (LMB Krios2) equipped with a Falcon III direct electron detector (FEI) operated in electron counting mode and with a pixel size of 1.07 Å/pixel (nominal magnification of 75,000 X). EPU (ThermoFisher) with on-the-fly motion correction was used for automated data acquisition with a defocus range set at −2 to −3 μm, dose-fractionating each micrograph into 180 fractions. An exposure time of 44 s was used with a dose of 0.82 e - /pixel/s.
Data processing and 3D-reconstruction for the reconstituted sample
The gain-corrected 20-frame movies were aligned and dose-weighted (0.25-0.27 e - /Å 2 /frame) by MotionCor2 ( Zheng et al., 2017 ). The contrast transfer function (CTF) parameters were calculated using Gctf ( Zhang, 2016 ). Gautomatch ( https://www.mrc-lmb.cam.ac.uk/kzhang/Gautomatch/ ) was used for automated particle picking on the remaining 6682 micrographs after manually discarding those containing contamination, no particles, significant drift or damaged holes. RELION 3.0-alpha was used for the entire data processing ( Nakane et al., 2018 , Scheres, 2012a , Scheres, 2012b , Zivanov et al., 2018 ). 632,000 particles were extracted with down-sampling by a factor of 2 and submitted for four rounds of 2D classification from which 472,000 selected particles were re-extracted without down-sampling in a box size of 360 pixels and submitted for 3D classification using a regularization parameter (T) of 4. Four of eight good 3D classes were included in further processing ( Figure S2 ). Two classes containing the best Csm3/Tof1 density (nearly 300,000 particles, 60%) were combined and 3D-refined before performing further rounds of CTF refinement, Bayesian polishing ( Zivanov et al., 2019 ) and 3D-refinement to yield a map at an overall 3.1 Å resolution (all resolutions hereafter calculated with Gold standard Fourier shell correlation of 0.143). The precise pixel size of 1.049 Å was determined after maximizing the cross-correlation coefficient between our 3.1 Å map and the CMG:DNA model (PDB: 5U8S ) ( Georgescu et al., 2017 ) using Chimera ( Pettersen et al., 2004 ). This pixel size was then used for postprocessing all maps obtained in this dataset. To further improve the Csm3/Tof1 density, multi-body refinement ( Nakane et al., 2018 ) was performed for (i) the Tof1 Head including N-tier regions of Mcm2, 3, 5, and (ii) the Tof1 Body/Csm3 including the N-tier regions of Mcm4, 6, 7 and dsDNA ( Figure S2 ). Resulting maps were sharpened with B-factor −20 Å 2 to give final maps of 3.3 and 3.2 Å resolution, respectively. These maps were used for building the models of Csm3, Tof1 and dsDNA. For the remainder of the complex, the above 3D classification identified two conformations differing in the position of the MCM C-tier and bound ssDNA (conformations 1 and 2). One class represented complexes in conformation 1 and containing Csm3/Tof1 (124,000 particles; 26%). One class represented complexes in conformation 2 and containing Csm3/Tof1 (159,000 particles, 34%). A third class represented a mixed population of particles in both conformations, lacking clear density for Csm3/Tof1; this class was separated into conformation 1 (74,000 particles; 16%) and conformation 2 (23,000 particles; 5%) using 3D subclassification without alignment. For conformation 1 ( Figure S2 , gray maps), all classes in this conformation were combined irrespective of Csm3/Tof1 occupancy (198,000 particles; 42%) and 3D-refined, before performing CTF refinement, Bayesian polishing, another round of 3D refinement and map sharpening to yield a map at 3.2 Å resolution. Multi-body refinement was performed masking more rigidly-associated regions of the complex as described in Figure S2 . After map sharpening, the resulting maps were used to build the atomic models of CMG and Ctf4 for conformation 1. The above multi-body refinement maps were sharpened with the following B-factors: −40 Å 2 for the Mcm2356 map, −5 Å 2 for the Mcm47 map, −20 Å 2 for the remaining bodies. For conformation 2 ( Figure S2 , yellow maps), a similar approach was taken as for conformation 1. After multi-body refinement, fitting of models to the conformation 2 density confirmed the only major differences between conformations was the position of the C-tier and bound ssDNA. Consequently, the maps for the MCM C-tier, Mcm3467 and Mcm25 were sharpened with B-factors −20, −10 and −10 Å 2 respectively, and used to build the model of the MCM C-tier in conformation 2. An additional map produced after a further round of 3D subclassification (see below) was also used to aid model building for conformation 2. After initial model building, it was clear there was a mixed population differing in AMP-PNP occupancy for conformation 2. To resolve these populations, the good particles from the original 3D-classification were combined before performing a further round of 3D-subclassification using a higher value T of 10 and limiting the Fourier components used in alignment to 10 Å resolution (refer to Figure S2 ). Of 12 classes, one represented complexes in conformation 2 with five AMP-PNP molecules bound to the C-tier ( Figure S2 , magenta map), and a second with particles in conformation 2 with three AMP-PNP molecules bound and a shorter region of ssDNA resolved ( Figure S2 , cyan map). Models were fitted to these and the AMP-PNP occupancy and ssDNA length adjusted accordingly (presented in Figure 3 B). The map with five AMP-PNP molecules bound was then submitted for two-body multi-body refinement with one body covering Mcm25 and Mcm6 CTD; after map sharpening with a B-factor of −5 Å 2 , this map was useful in aiding final model building for the model of conformation 2. Finally it is worth noting this further 3D-subclassification additionally yielded a 3.7 Å resolution sharpened map of conformation 1 with more homogeneous resolution across all subunits in the complex. To produce the cryo-EM density map best illustrating regions of unassigned density ( Figure S3 M) the subset of particles in conformation 2, which produced the 3.3 Å map of the whole complex (see Figure S2 , yellow map), was subjected to a further round of 3D sub-classification without alignment, this time utilizing a higher value T of 100 in addition to providing a mask which encompassed Csm3/Tof1, dsDNA and the N-tier regions primarily belonging to Mcm4 and 6. Of six classes, four classes (50% of input particles) contained good Csm3/Tof1 and dsDNA density; these were recombined, 3D-refined and finally sharpened with a B-factor of −5 Å 2 . Local resolution was calculated using RELION and maps were colored accordingly using Chimera ( Pettersen et al., 2004 ), presented in Figure S1 K.
Data processing and 3D-reconstruction for the cross-linked co-expressed sample
A total of six datasets totaling 11,647 raw movies were collected and processed independently using first RELION-2.1 and then RELION 3.0-alpha ( Scheres, 2012a , Scheres, 2012b , Zivanov et al., 2018 ). In general, raw movies were aligned and dose-weighted by MotionCor2 ( Zheng et al., 2017 ) and CTF parameters were estimated using Gctf ( Zhang, 2016 ). Poor micrographs (containing contamination, no particles, significant drift or damaged holes) were manually excluded from each dataset. All particles were picked using Gautomatch ( https://www.mrc-lmb.cam.ac.uk/kzhang/Gautomatch/ ). After one to two rounds of 2D-classification, followed by 3D-classification and 3D-refinement, the sharpened maps for the best classes from all six datasets were compared in Chimera in order to calculate scaling factors necessary for combining the datasets initially acquired at different microscope magnifications. Refined particles from five datasets were rescaled to the relative pixel size of the sixth dataset at 1.11 Å/pixel after re-estimation of the CTF parameters followed by particle re-extraction using a box size of 360 pixels ( Wilkinson et al., 2019 ). The combined dataset comprised 412,000 particles, which were submitted for 3D-refinement. The resulting 3.4 Å map was sharpened with a B-factor of −20 Å 2 and is presented in Figure S3 J (see also Figures S3 E and S3F). To improve the resolution of the complex, a three-body multi-body refinement was performed with bodies encompassing either the MCM C-tier, Csm3-Tof1-dsDNA or the remainder; the sharpened maps are presented in Figure S3 G.
Data processing and 3D-reconstruction for the non-crosslinked co-expressed sample
Micrographs were processed using RELION-2.1 ( Scheres, 2012a , Scheres, 2012b , Zivanov et al., 2018 ). Raw movies were aligned and dose-weighted by MotionCor2 ( Zheng et al., 2017 ) and CTF parameters were estimated using Gctf ( Zhang, 2016 ). Poor micrographs (containing contamination, no particles, significant drift or damaged holes) were manually excluded from each dataset. Particles were picked from the remaining 2387 micrographs using Gautomatch ( https://www.mrc-lmb.cam.ac.uk/kzhang/Gautomatch/ ). A total of 413,000 particles were extracted and down-sampled by a factor of two before submission to two rounds of 2D classification. It was clear from 2D classification that there was a significant number of particles comprising more than one CMG molecule. Classes were stringently selected to contain complexes with a single copy of CMG, yielding 70,000 particles. These were subsequently submitted for 3D classification across six classes: heterogeneity was observed for Csm3-Tof1 and Ctf4 occupancy, with one class representing particles containing CMG-Csm3-Tof1-Ctf4-DNA. This class (28,000 particles) was re-extracted without down-sampling, 3D-refined and sharpened (B-factor of −50 Å 2 ) to yield a map at 5.1 Å resolution (presented in Figure S3 I).
Model building and refinement
Model building was carried out in Coot ( Emsley et al., 2010 ) for the reconstituted sample using maps generated by multi-body refinement, as detailed in the data processing sections. An atomic model was built for conformation 1 ( Table S1 ). As initial template models, CMG:DNA (PDB: 5U8S ) ( Georgescu et al., 2017 ) and the crystal structure of the C-terminal regions of Ctf4 (PDB: 4C8H ) ( Simon et al., 2014 ) were used where individual subunits were fitted as rigid bodies to the relevant multi-body refinement maps using Chimera (UCSF) ( Pettersen et al., 2004 ), with N- and C-tier regions of MCM subunits fitted separately. It was notable that the resolution of MCM C-tier subunits was variable, with Mcm2, 3, 5 and 6 (those binding AMP-PNP and ssDNA) better resolved than Mcm4 and 7. Subunits were then jiggle-fitted and morphed to the relevant maps in Coot , prior to adjusting the models to density manually using local refinement and regularization. For Mcm subunits, the regions N-terminal to the helical domain (N-terminal extension, NTE) of Mcm2, 4 and 6 were extended, with 28 residues built for the Mcm2 NTE, 12 residues built for the Mcm6 NTE, and remodelling of 6 residues of the Mcm4 NTE ( Figure S1 M). These NTE regions contain Tof1 binding sites. 172 residues were not observed for the NTE of Mcm2, although unassigned density is present in the vicinity and may account for some of these residues. The MCM Zinc-finger (ZnF) domains were rebuilt with tetrahedrally-coordinated Zn 2+ ions placed in the spherical density that was observed at low contour level between four cysteine residues in each of the ZnF domains in Mcm2, 4, 5, 6 and 7. The Mcm5 ZnF was based on the MCM double hexamer template model (PDB: 5BK4 ) ( Noguchi et al., 2017 ). The N-terminal hairpin (NTH) loops of Mcm7 (the separation pin, 362-368) and Mcm2 (436-443) were remodelled as α-helical, with the Mcm6 NTH also significantly remodelled. The linkers between N- and C-tier were built fully as loops for Mcm2 (459-476) and 5 (339-363) and an α-helix (501-508) was built for the mostly disordered N/C-tier linker of Mcm6 (463-509). In the C-tier, the ssDNA-binding regions (helix H2, H2I loops and PS1 loops) showed much improved density, which required significant remodelling in terms of repositioning and extending the Cα-backbone, assigning the correct sequence register and rebuilding side-chains. Density observed around the C-tier region of Mcm3 where the model is incomplete (vicinity of residue 583) remains unassigned. Additional helical density observed in the vicinity of Mcm6 could be potentially attributed to residues 202-251 and/or its N/C-tier linker, however this region was not included in the final model. The C-terminal winged-helix (WH) domain (851-877) was retained for Mcm4 in the lower-resolution density, as seen in prior structural work ( Georgescu et al., 2017 ). AMP-PNP/Mg 2+ was built in well resolved density at the Mcm2/6, 2/5 and 3/5 interfaces with side chains visible for WalkerA, WalkerB, Arg-finger and Sensor2 motifs ( Figure S1 H). For the remainder of CMG, model building was as follows. The N-terminal CIP-box of Sld5 taken from the crystal structure of this peptide bound to Ctf4 (PDB: 4C95 ) ( Simon et al., 2014 ) was rigid-body fitted and adjusted in clearly visible density. The model for Psf2 was extended for additional residues 33-38, which now appear to be ordered, presumably through the interaction of this region with the Ctf4 helical bundle. For Ctf4, the side-chains were adjusted, particularly at the interface with Cdc45 and Psf2. The N-terminal regions of Ctf4 (1-460), known to contain a WD40 domain in human And-1, could not be assigned to specific regions of density in our complex. Five residues of the Psf3 N-terminal His-tag were resolved in the density and are present in the model (N-Ser-His-Met-Ala-Ser-C). For conformation 2, the largest changes compared to conformation 1 were observed in the MCM C-tier and the length of bound ssDNA, therefore a model was built for this region by adjusting our MCM C-tier models for conformation 1 to density of conformation 2. The resolution of C-tier subunits varied, with those bound to AMP-PNP/Mg 2+ and 16-mer ssDNA (built as poly-dT) better resolved (the only AMP-PNP-free interface was observed between Mcm2 and 5). The major differences compared to conformation 1 were observed in the relative positions of individual MCM subunits and the positions of the ssDNA-binding loops. For Mcm4, density for the WH was no longer observed, while the linker connecting the WH to the AAA+ domain was repositioned away from the MCM central channel. Csm3/Tof1 was partially built de novo . The N terminus of Tof1 was identified in our density after rigid-body fitting of the fragment of human Timeless (PDB: 5MQI ) ( Holzer et al., 2017 ), which was then used for homology modeling of the Tof1 region comprising helical repeats 1-6 using Phyre2 ( Kelley et al., 2015 ). The Tof1 homology model was morphed and jiggle-fitted into our multi-body map of the Tof1 Head ( Figure S2 ), which was then manually adjusted and locally refined before building de novo the Ω-loop and the MCM-plugin, which extend between helical repeats 3-4 and 4-5, respectively. The Mcm6 NTE packs against the Ω-loop and this region was built as a composite Mcm6-Tof1 β sheet given good density. The density for the Ω-loop in the region facing the major groove of DNA indicates greater flexibility. The density and connectivity for the long MCM-plugin was of a good quality, in particular several prominent newly built secondary structure elements (helices Bridge and αW, and the Wedge β-hairpin, see Figure S7 E) packing against the interface with Mcm6, 4 and 7. The density of the MCM-plugin which protrudes into the minor groove of DNA could be well resolved and the side chains built represent those of the Tof1 DBM (401-404). Repeats 7-9 of Tof1 (the Body encompasses repeats 6-9, Figure S7 A) were built de novo up to residue 781 with certain loops being omitted due to lack of density ( Table S1 ). Following residue 781, the remaining novel density accounting for five helices was observed to have opposite polarity to helices in the Tof1 Body and the model for this density was built de novo with the sequence register assigned to the core of Csm3; in particular, the side chains of the helix α2 were well resolved with a prominent tryptophan side chain (W98). Additional density extending from a small helix α0 into the minor groove of dsDNA was built as the Csm3 DBM (46-53). This region is predicted to be disordered and is likely stabilized by interaction with DNA. The dsDNA was built in the density of a multi-body refinement map representing Tof1 Body /Csm3/dsDNA. Sequence register was assigned based on the sequence of our fork DNA assuming no unwinding due to the inclusion of AMP-PNP during sample preparation. Once rebuilt, subunits were refined in the relevant maps using Refmac ( Kovalevskiy et al., 2018 ), phenix.real_space_refine ( Afonine et al., 2018 ) and ISOLDE ( Croll, 2018 ). Model to cryo-EM map validation for conformation 1 and conformation 2 Fourier Shell Correlation (FSC) was calculated between the refined models (conformation 1 and MCM C-tier:ssDNA of conformation 2) and their respective unsharpened sums of the two half maps using XMIPP ( Sorzano et al., 2004 ). The above models were also refined with restraints against the respective half-1 maps and the FSC map-to-model curves were calculated for the half-1 and half-2 (not used for model refinement) maps ( Figure S1 I). Cross-linking mass spectrometry (XL-MS) The complex comprising CMG, Ctf4, Csm3/Tof1 and Mrc1 was purified following co-expression as described above. The eluate from the Calmodulin Sepharose 4B column (25 mM HEPES pH 7.5, 150 mM sodium acetate, 0.5 mM TCEP, 2 mM EDTA/EGTA) was immediately cross-linked with a 100-fold excess of the N-hydroxysuccinimide (NHS) ester disuccinimidyl dibutyric urea (DSBU, ThermoScientific, USA), with respect to the protein concentration. The cross-linking reactions were incubated for 60 min at room temperature and then quenched by the addition of NH 4 HCO 3 to a final concentration of 20 mM and incubated for further 15 min. The cross-linked proteins were then precipitated according to the method of Wessel and Flügge (1984) and resuspended in 8 M urea in 50 mM NH 4 HCO 3. The cross-linked proteins were reduced with 10 mM DTT and alkylated with 50 mM iodoacetamide. Following alkylation, the concentration of urea was reduced to 1 M by the addition of 50 mM NH 4 HCO 3 and the proteins digested with trypsin (Promega, UK) at an enzyme-to-substrate ratio of 1:100, for 1 h at room temperature and then further digested overnight at 37°C following a subsequent addition of trypsin at a ratio of 1:20. The peptide digests were then fractionated batch-wise by high pH reverse phase chromatography on micro spin C18 columns (Harvard Apparatus, USA), into five fractions (10 mM NH 4 HCO 3 /10% v/v acetonitrile pH 8, 10 mM NH 4 HCO 3 /20% v/v acetonitrile pH 8, 10 mM NH 4 HCO 3 /30% v/v acetonitrile pH 8, 10 mM NH 4 HCO 3 /50% v/v acetonitrile pH 8 and 10 mM NH 4 HCO 3 /80% v/v acetonitrile pH 8). The 150 μL fractions were evaporated to dryness on a CoolSafe lyophilizer (ScanVac, Denmark) prior to analysis by LC-MS/MS. Lyophilized peptides for LC-MS/MS were resuspended in 0.1% v/v formic acid and 2% v/v acetonitrile and analyzed by nano-scale capillary LC-MS/MS using an Ultimate U3000 HPLC (ThermoScientific Dionex, USA) to deliver a flow of approximately 300 nl/min. A C18 Acclaim PepMap100 5 μm, 100 μm × 20 mm nanoViper (ThermoScientific Dionex, USA), trapped the peptides before separation on a C18 Acclaim PepMap100 3 μm, 75 μm × 250 mm nanoViper (ThermoScientific Dionex, USA). Peptides were eluted with a gradient of acetonitrile. The analytical column outlet was directly interfaced via a nano-flow electrospray ionisation source, with a quadrupole Orbitrap mass spectrometer (Q-Exactive HFX, ThermoScientific, USA). MS data were acquired in data-dependent mode using a top 10 method, where ions with a precursor charge state of 1+ and 2+ were excluded. High-resolution full scans (R = 120 000, m/z 300-1800) were recorded in the Orbitrap followed by higher energy collision dissociation (HCD) (stepped collision energy 26 and 28% Normalized Collision Energy) of the 10 most intense MS peaks. The fragment ion spectra were acquired at a resolution of 50,000 and dynamic exclusion window of 20 s was applied. For data analysis, Xcalibur raw files were converted into the MGF format using MSConvert (Proteowizard) ( Kessner et al., 2008 ) and used directly as input files for MeroX ( Götze et al., 2015 ). Searches were performed against an ad hoc protein database containing the sequences of the proteins in the complex and a set of randomized decoy sequences generated by the software. The following parameters were set for the searches: maximum number of missed cleavages 3; targeted residues K, S, Y and T; minimum peptide length 5 amino acids; variable modifications: carbamidomethylation of cysteine (mass shift 57.02146 Da), Methionine oxidation (mass shift 15.99491 Da); DSBU modified fragments: 85.05276 Da and 111.03203 Da (precision: 5 ppm MS and 10 ppm MS/MS); False Discovery Rate cut-off: 5%. Finally, each fragmentation spectrum was manually inspected and validated.
Origin-dependent DNA replication assays
Origin-dependent replication assays were performed essentially as described previously ( Aria and Yeeles, 2018 , Taylor and Yeeles, 2018 ). MCM loading was performed at 24°C in reactions (typically 35 μl) containing 25 mM HEPES-KOH pH 7.6, 100 mM K-glutamate, 0.01% v/v Nonidet P40 substitute (NP-40-S) (Roche #11754599001), 1 mM DTT, 10 mM Mg(OAc) 2 , 40 mM KCl, 0.1 mg/ml BSA, 3 mM ATP, 3 nM AhdI-linearized vVA20 template ( Aria and Yeeles, 2018 ), 75 nM Cdt1⋅Mcm2-7, 40 nM Cdc6, 25 nM DDK, 20 nM ORC. After 10 min S-CDK was added to a final concentration of 80 nM and incubation continued at 24°C for 5 min. Reactions were diluted 4-fold into replication buffer to give final reaction concentrations (accounting for subsequent addition of replication proteins) of 25 mM HEPES-KOH pH 7.6, 250 mM K-glutamate, 0.01% NP-40-S, 1 mM DTT, 10 mM Mg(OAc) 2 , 10 mM KCl, 0.1 mg/ml BSA, 3 mM ATP, 200 μM C/G/UTP, 30 μM dA/dT/dG/dCTP, 1 μCi [α- 32 P]-dCTP, 0.75 nM AhdI-linearized vVA20 template, 18.75 nM Cdt1⋅Mcm2-7, 10 nM Cdc6, 6.25 nM DDK, 5 nM ORC. Reactions were equilibrated at 30°C (∼1 min) and replication initiated by addition of replication proteins from a master mix to the following final concentrations: 30 nM Dpb11, 100 nM GINS, 30 nM Cdc45, 10 nM Mcm10, 20 nM Pol ε, 20 nM Ctf4, 100 nM RPA, 20 nM RFC, 20 nM PCNA, 20 nM Pol α, 10 nM Pol δ, 12.5 nM Sld3/7, 20 nM Sld2, 20 nM Mrc1 and 20 nM Csm3/Tof1 or mutants where indicated. Reactions were quenched by addition of an equal volume of 100 mM EDTA and samples were processed as previously described ( Aria and Yeeles, 2018 , Taylor and Yeeles, 2018 ). RFB experiments were performed on AhdI-linearized vJY30 ( Table S3 ) and Fob1 was added together with the MCM loading proteins to a concentration of 250 nM (62.5 nM after dilution into replication buffer).
Replisome association assays
MCM loading was performed at 30°C in reactions containing 25 mM HEPES-KOH pH 7.6, 100 mM K-glutamate, 0.01% v/v NP-40-S, 1 mM DTT, 10 mM Mg(OAc) 2 , 0.1 mg/ml BSA, 3 mM ATP, 3 nM vVA20 template ( Aria and Yeeles, 2018 ), 75 nM Cdt1⋅Mcm2-7, 40 nM Cdc6, 25 nM DDK, 14 nM ORC. After 30 min reactions were diluted 2-fold into replication buffer to give final reaction concentrations (accounting for subsequent addition of replication proteins) of 25 mM HEPES-KOH pH 7.6, 250 mM K-glutamate, 0.01% NP-40-S, 1 mM DTT, 10 mM Mg(OAc) 2 , 0.1 mg/ml BSA, 3 mM ATP, 200 μM C/G/UTP, 30 μM dA/dT/dG/dCTP, 1.5 nM vVA20 template, 37.5 nM Cdt1⋅Mcm2-7, 20 nM Cdc6, 12.5 nM DDK, 7 nM ORC. Replication was initiated by addition of replication proteins from a master mix to the following final concentrations: 30 nM Dpb11, 100 nM GINS, 30 nM Cdc45, 10 nM Mcm10, 20 nM Pol ε, 20 nM Ctf4, 100 nM RPA, 20 nM RFC, 20 nM PCNA, 20 nM Pol α, 12.5 nM Sld3/7, 20 nM Sld2, 10 nM Mrc1 and 20 nM Csm3/Tof1 or mutants where indicated. After 25 min, samples (13 μl) were directly applied to 400 μL (bed volume) Sephacryl S-400 columns (GE healthcare) equilibrated in 25 mM HEPES-NaOH pH 7.5, 150 mM NaOAc, 10 mM Mg(OAc) 2 , 1 mM DTT, 0.01% v/v NP-40-S and 0.1 mM ATP. Columns were centrifuged (750 g, 2 min, 21°C) and the eluate was analyzed by SDS-PAGE and western blotting. Cdc45 was detected using its FLAG epitope with an anti-FLAG antibody (A8592, Sigma). RPA was detected with an antibody against the Rpa1 subunit (AS07 214). Mcm7, Psf1, Ctf4, Csm3 and Mrc1 were detected with sheep polyclonal antibodies ( Maric et al., 2014 , Mukherjee and Labib, 2019 ).
Electrophoretic mobility-shift assays
Csm3/Tof1 wild-type or mutant proteins were mixed with fork DNA prepared as for cryo-EM sample preparation (40 nM final [DNA]), at a molar ratio of protein:DNA of 1:1, 2:1, 4:1 and 8:1 in a reaction buffer containing 25 mM HEPES-KOH, pH 7.6, 100 mM KOAc, 2 mM Mg(OAc) 2 , 0.2% NP40 and 1 mM DTT and incubated on ice for 30 min. Ficoll 400 was added to each 15 μL reaction to a final concentration of 2.3% v/v before loading onto 4% native polyacrylamide gels for analysis. Gels were imaged using a Typhoon fluorescence imager (Amersham) at the Cy3 excitation wavelength of 532 nm.
Phosbind SDS-PAGE Prior to electrophoresis
Csm3/Tof1 was treated with Lambda protein phosphatase (λ-PP) in a reaction (100 μl) containing 50 mM HEPES-NaOH pH 7.5, 100 mM NaCl, 2 mM DTT, 1 mM MnCl 2 , 300 nM Csm3/Tof1 and 0.1 mg/ml λ-PP ( Zhuo et al., 1993 ) for 40 min at 37°C. Samples (10 μl) were separated through 5% polyacrylamide gels containing 353 mM Bis-Tris-HCL pH 6.8, 100 μM ZnCl 2 and 50 μM Phosbind (APExBio). Control gels were also run in the absence of Phosbind. Electrophoresis was performed in 1x NuPAGE MOPS running buffer (Invitrogen) at 30 mA for ∼90 min and gels were stained with Coomassie InstantBlue (Expedeon).
Camptothecin sensitivity assays
Saturated cultures of S. cerevisiae grown in YEP + 2% w/v glucose were diluted to an A 600 of 0.2 and were grown to an A 600 of ∼0.6-0.8 in YEP + 2% w/v glucose at 30°C. Cells were harvested and resuspended in YEP + 2% w/v glucose + 100 μg/ml ampicillin or sterile water to a A 600 of 0.5. Cells from a 10-fold serial dilution in YEP + 2% w/v glucose + 100 μg/ml ampicillin or sterile water were then plated (8 μl) on YEPD agar plates supplemented with either DMSO or camptothecin (Merck). Multiple sequence alignments Amino acid sequences were retrieved from relevant databases (NCBI or SGD where stated; UniProt otherwise) ( Cherry et al., 2012 , UniProt Consortium, 2019 ). Alignment was performed using MUSCLE (EMBL-EBI) ( Edgar, 2004 ). The alignment was rendered using ESPript3.0 ( http://espript.ibcp.fr ) ( Robert and Gouet, 2014 ).
Structural analysis and visualization
All figures of structures were plotted in PyMOL ( SchrödingerLLC, 2015 ), Chimera ( Pettersen et al., 2004 ) or ChimeraX ( Goddard et al., 2018 ). Calculations of buried surface area were performed using PDBePISA ( Krissinel and Henrick, 2007 ). XL-MS crosslinks mapped to the atomic model in Figures S3 J and S3K were plotted using the UCSF Chimera ( Pettersen et al., 2004 ) plugin Xlink Analyzer ( Kosinski et al., 2015 ).
Quantification and Statistical Analysis
Quantification and data analysis of replication assays were performed in ImageJ and Prism8. Lane profiles were generated in ImageJ and were used to quantify the intensity of the stalled Left leading strand and the Right leading strand. Normalized Stall was derived by dividing the intensity of the Stalled left leading strand by the intensity of the Right leading strand. Data were plotted in Prism8.
Materials Availability
Unique and stable reagents generated in this study are available upon request.
Experimental Model and Subject Details
Proteins were purified from Saccharomyces cerevisiae strains (genotype: MATa ade2-1 ura3-1 his3-11,15 trp1-1 leu2-3,112 can1-100 bar1::Hyg pep4::KanMX) containing integrated expression constructs; or from Escherichia coli RosettaTM 2(DE3) cells (Novagen) (genotype: F– ompT hsdSB(rB– mB–) gal dcm (DE3) pRARE2 (CamR)) transformed with plasmids for protein overexpression (see Key Resources Table and Tables S3–S5 for details.
Yeast strains for harboring
Csm3 and Tof1 mutations were derived from W303-1a (genotype: MATa ade2-1 ura3-1 his3-11,15 trp1-1 leu2-3,112 can1-100). Plasmids details are reported in the Key Resources Table and Table S3 .
Method Details Yeast strains
Vectors and strains were constructed using standard molecular biology techniques (see Tables S3 and S4 for details). All genes for protein expression were codon optimized as described ( Yeeles et al., 2015 ). All mutant haploid yeast strains were isolated by tetrad dissection of heterozygous diploid strains. Coding sequences for all genes were verified by sequencing, as were the coding regions of mutant alleles of Csm3 and Tof1 following PCR amplification from genomic DNA. Protein purification Cdt1⋅Mcm2-7, ORC, Cdc6, DDK, Sld3/7, Sld2, Cdc45, S-CDK, Dpb11, GINS, Pol ε, Mcm10, RPA, RFC, PCNA, Pol α, Pol δ, Csm3/Tof1 and Ctf4 were purified as previously described ( Taylor and Yeeles, 2018 , Yeeles et al., 2015 , Yeeles et al., 2017 ). An overview of the purification strategy for each protein is provided in Table S5 . RPA purification Untagged S. cerevisiae RPA was purified from a 10 L culture of yJY106. Cells were grown at 30°C to 5 x10 7 cells per ml in YEP (1.1% yeast extract, 2.2% bactopeptone, 55 mg/L adenine hemisulphate) + 2% w/v raffinose before induction by addition of galactose to 2% w/v final concentration from a 20% w/v stock. Cell growth was continued for 3 hours at 30°C before cells were harvested by centrifugation, washed in 100 mL 25 mM Tric-HCL pH 7.2, 10% glycerol, 500 mM NaCl, 1 mM Tris(2-carboxyethyl)phosphine hydrochloride (TCEP) (buffer R + 500 mM NaCl) and resuspended in buffer R. Cell paste was frozen in liquid nitrogen and cells were lysed using a pestle and mortar filled with liquid nitrogen. The lysate was cleared by centrifugation (235,000 g, 4°C, 1 hour) and nucleic acid precipitated by addition of polyethyleneimine to 0.025% from a 1% stock followed by gentle stirring at 4°C for 10 min. Precipitate was cleared by centrifugation (18,000 g, 4°C, 15 min) and solid ammonium sulfate was added slowly to 40% saturation. Following gentle stirring at 4°C for 10 min, precipitated protein was collected by centrifugation (18,000 g, 4°C, 20 min) and the precipitate resuspended in buffer R + 500 mM NaCl. The conductivity of the protein sample was adjusted to be equivalent to buffer R + 500 mM NaCl by dilution with buffer R before application to a HiTrap Blue column equilibrated in buffer R + 500 mM NaCl. All subsequent purification steps were performed as described in ( Devbhandari et al., 2017 ).
Mrc1 purification
Mrc1 was purified as previously described ( Yeeles et al., 2017 ) but with the following modifications. The growth temperature during protein expression was reduced from 30°C to 20°C. All subsequent steps were performed at 4°C. Lysed cell powder from a 10-15 L culture was resuspended in buffer M (50 mM Tris-HCl pH 8, 10% glycerol, 0.005% TWEEN 20, 0.5 mM TCEP, 400 mM NaCl) + protease inhibitors (cOmplete, EDTA-free (Roche), one tablet per 50 mL buffer). Insoluble material was cleared by centrifugation (235,000 g, 4°C, 1 hour) and 2-4 mL FLAG M2 Affinity gel (Sigma) was added to the supernatant. The sample was incubated for 100 min before the resin was collected in 20 mL columns (< 2 mL bed volume per column) and was washed with 75 mL buffer M. Columns were washed with 12.5 mL buffer M + 5 mM Mg(OAc) 2 + 0.5 mM ATP, followed by 25 mL buffer M. Mrc1 was eluted in 1 column volume (CV) buffer M + 0.2 mg/ml 3x FLAG peptide and 2 CV buffer M + 0.1 mg/ml 3x FLAG peptide. The eluate was concentrated to ∼800 μL in an Amicon Ultra-15 30,000 NMWL concentrator and applied to a Superose 6 10/300 column (GE healthcare) equilibrated in 25 mM Tris-HCl pH 7.2, 10% glycerol, 0.005% TWEEN 20, 1 mM EDTA, 0.5 mM TCEP, 150 mM NaCl. Peak fractions were pooled, frozen in liquid nitrogen and stored at −80°C. Csm3/Tof1 purification Csm3/Tof1 was purified as previously described ( Yeeles et al., 2017 ) but with the following modifications. After elution from Calmodulin Sepharose 4B (GE healthcare) by TEV cleavage the protein was applied to a 1 mL MonoQ column equilibrated in 25 mM Tris-HCl pH 7.2, 1 mM EDTA, 10% glycerol, 0.02% NP-40-S, 1 mM DTT, 200 mM NaCl. Protein was eluted with a 30 column volume gradient from 200 mM – 1M NaCl. Peak fractions were pooled, concentrated to ∼500 μL in an Amicon Ultra-15 30,000 NMWL concentrator and applied to a Superdex 200 Increase 10/300 gel filtration column equilibrated in 25 mM Tris-HCl pH 7.2, 1 mM EDTA, 10% glycerol, 0.02% NP-40-S, 1 mM DTT, 150 mM NaCl. Peak fractions were pooled, frozen in liquid nitrogen and stored at −80°C.
CMG purification
Diploid yeast (yJY37) (15-30 L) were grown at 30°C to 5 x10 7 cells per ml in YEP + 2% w/v raffinose before induction by addition of galactose to 2% w/v final concentration from a 20% w/v stock. Cell growth was continued for 3 hours at 30°C before cells were harvested by centrifugation, washed in 150 mL buffer C (40 mM HEPES-NaOH pH 7.5, 10% glycerol, 0.005% TWEEN 20, 0.5 mM TCEP, 150 mM NaOAc) and resuspended in a minimal volume of buffer C + protease inhibitors (cOmplete, EDTA-free (Roche), one tablet per 50 mL buffer). Cell paste was frozen in liquid nitrogen and cells were lysed using a pestle and mortar filled with liquid nitrogen. Lysed cell powder (typically from a 15 L culture) was resuspended in buffer C + protease inhibitors and insoluble material removed by centrifugation (235,000 g, 4°C, 1 hour). FLAG M2 Affinity gel (8 ml) was added to the lysate and incubated for 90 min at 4°C. Resin was collected in 20 mL columns (< 2 mL bed volume per column) and washed with 80 mL buffer C per column. Columns were then washed with 10 mL buffer C + 5 mM Mg(OAc) 2 + 0.5 mM ATP followed by 25 mL buffer C. Proteins were eluted with 1 CV buffer C + 2mM CaCl 2 + 0.2 mg/ml 3x FLAG peptide then 2 CV buffer C + 2mM CaCl 2 + 0.1 mg/ml 3x FLAG peptide. Calmodulin Sepharose 4B (GE healthcare) (1 ml) was immediately added to the eluate, which was incubated for 30 min before the resin was collected in a 20 mL column. The flow-through was reapplied to the column twice before washing the column with 25 CV buffer C + 2mM CaCl 2 . CMG was eluted in 8 CV of buffer C + 2 mM EDTA + 2 mM EGTA. Eluate was applied to a MonoQ PC 1.6/5 (GE healthcare) equilibrated in 25 mM Tris-HCl pH 7.2, 10% glycerol, 0.005% TWEEN 20, 0.5 mM TCEP, 150 mM KCl. CMG was eluted with a 20 CV gradient from 150-1000 mM KCl and peak fractions were dialysed overnight against 500 mL 25 mM HEPES-KOH pH 7.6, 40 mM KOAc, 40 mM K-glutamate, 2 mM Mg(OAc) 2 , 0.25 mM EDTA, 0.5 mM TCEP, 20% glycerol. Protein was frozen in liquid nitrogen and stored at −80°C. Fob1 purification yJY39 (10 L) were grown at 30°C to 4.5 x10 7 cells per ml in YEP + 2% w/v raffinose before induction by addition of galactose to 2% w/v final concentration from a 20% w/v stock. Cell growth was continued for 3 hours at 30°C before cells were harvested by centrifugation, washed in 150 mL buffer F (25 mM Tris-HCl pH 7.2, 1 mM EDTA, 10% glycerol, 0.02% NP-40-S, 0.5 mM DTT) + 400 mM NaCl and resuspended in a minimal volume of buffer F + 400 mM NaCl + protease inhibitors (cOmplete, EDTA-free (Roche), one tablet per 25 mL buffer). Cell paste was frozen in liquid nitrogen and cells were lysed using a pestle and mortar filled with liquid nitrogen. Lysed cell powder was resuspended in buffer F + 400 mM NaCl + protease inhibitors and insoluble material removed by centrifugation (235,000 g, 4°C, 1 hour). FLAG M2 Affinity gel (2.5 ml) was added to the lysate and incubated for 3 hours at 4°C. Resin was collected in a 20 mL column and washed with 80 mL buffer F + 400 mM NaCl followed by 20 mL buffer F + 200 mM NaCl. Fob1 was eluted in 8 mL buffer F + 200 mM NaCl + 0.2 mg/ml 3x FLAG peptide. The eluate was diluted in buffer F to the equivalent of 150 mM NaCl and was applied to a 1 mL MonoQ column equilibrated in buffer F + 150 mM NaCl. Protein was eluted with a 25 CV gradient from 150-1000 mM NaCl in buffer F. Peak fractions were pooled and dialysed against buffer F + 150 mM NaCl for 3 hours prior to freezing in liquid nitrogen and storage at −80°C.
Preparation of fork
DNA for cryo-EM sample preparation Fork
DNA was annealed by mixing equal volumes of Fork-Lead and Fork-Lag oligos (Integrated DNA Technologies) and allowing to cool gradually from 75°C to room temperature. The Fork-Lead and Fork-Lag stock solutions were made at 53 μM each in 25 mM HEPES-NaOH, pH 7.5, 150 mM NaOAc, 0.5 mM TCEP, 2 mM Mg(OAc) 2 . The sequence of each oligo was a modified version of the fork used in prior publication ( Georgescu et al., 2017 ); Fork-Lead was 5′-(Cy3)TAGAGTAGGAAGTGA(Biotinylated-dT)GGTAAGTG ATTAGAGAATTGGAGAGTGTG(T) 34 T ∗ T ∗ T ∗ T ∗ T ∗ T, where ∗ denotes phosphorothioate backbone linkages. Fork-Lag was 5′-GGCAGGCAGGCAGGCACACACTCTCCAATTCTCTAATCACTTACCA(Biotinylated-dT)CACTTCCTACTCTA. Glycerol 10%–30% gradient preparation For co-expression experiments, Buffer A (40 mM HEPES-NaOH, pH 7.5, 150 mM NaOAc, 0.5 mM TCEP, 10% v/v glycerol) was layered on top an equal volume of freshly prepared Buffer B (Buffer A, except 30% v/v glycerol + 0.16% glutaraldehyde [Sigma]) in a 14 mL SW40-Ti tube (Beckman) and gradients made using a gradient-making station (Biocomp Instruments, Ltd.) before cooling on ice. For in vitro reconstitution experiments, 500 μM AMP-PNP and 3 mM Mg(OAc) 2 were added to Buffers A and B. Buffer B was further supplemented with a second cross-linking agent, 2 mM bis(sulfosuccinimidyl)suberate (BS 3 , ThermoFisher Scientific). These were layered in equal volumes in a 2.2 mL TLS-55 tube (Beranek Laborgerate) and gradients prepared using a gradient-making station (Biocomp Instruments, Ltd.) before cooling on ice. In vitro reconstitution of CMG-Csm3/Tof1-Mrc1-Ctf4-DNA complexes for cryo-EM Components were sequentially mixed with CMG while on ice as follows to yield a final reaction volume of 65 μL containing 0.5 μM CMG with a 1.5 molar excess of all other components, maintaining 500 μM AMP-PNP and 3 mM Mg(OAc) 2 throughout. First, the fork DNA was added to CMG and incubated for 1 h. Subsequently, Csm3/Tof1 and Ctf4 were pre-mixed and added to the CMG:DNA reaction mixture. After 10 min incubation, Mrc1 was added for a further 45 min. Before loading onto the glycerol gradient (prepared as described above), the reaction volume was diluted 2.5-fold using buffer D (25 mM HEPES-NaOH, pH 7.5, 150 mM NaOAc, 0.5 mM TCEP, 500 μM AMP-PNP, 3 mM Mg(OAc) 2 ). The sample was separated by centrifugation (Beckman TLS-55 rotor, 200,000 g , 4°C, 2 h) and 100 μL fractions manually collected. The fraction containing the complex was identified by silver-stained SDS-PAGE. Relevant fractions were pooled (total ∼190 μL) and buffer exchanged with cryo-EM buffer (buffer D except 100 μM AMP-PNP + 0.005% v/v TWEEN 20 [Sigma, Cat#P8341]) during six rounds of ultrafiltration in 0.5 mL 30K MWCO centrifugal filters (Amicon) using a bench-top centrifuge (21,000 g, 4°C, 1 min/round). Sample was concentrated to ∼25 μL and immediately used for cryo-EM grid preparation. Co-expression and purification of CMG-Csm3/Tof1-Mrc1-Ctf4 complexes for cryo-EM Cultures of yJY74 (see Tables S4 and S5 for details) were grown in YEP with 2% w/v raffinose (15 L) at 30°C, to a density of ∼6 × 10 7 cells/mL before inducing overexpression by addition of 2% w/v galactose for 3 h under the same conditions. Cells were harvested by centrifugation (3,000 g , 8 min, 4°C), washed and resuspended with Lysis buffer (40 mM HEPES-NaOH, pH 7.5, 150 mM NaOAc, 10% glycerol, 0.005% v/v TWEEN 20, 0.5 mM TCEP, protease-inhibitors (cOmplete, EDTA-free (Roche), one tablet per 25 mL buffer)), before flash-freezing as pellets in liquid nitrogen. Cells were lysed using a Freezer/Mill (6870D SPEX Sample Prep, 2 cycles, 1 min pre-cool, 2 min run-time, 1 min cool-time, rate 10 cps) before thawing in Lysis buffer. All subsequent steps were performed at 4°C unless specified otherwise. The lysate was clarified by centrifugation (160,000 g , 45 min) and the supernatant filtered (0.45 μm PVDF syringe filters, Elkay Laboratory Products UK). The supernatant was then incubated with 8-10 mL anti-FLAG M2 affinity agarose gel (Sigma), rotating at 7 rpm for 60-90 min. The next affinity chromatography steps were done at room temperature using ice-cold buffers, unless stated otherwise. The supernatant was split between gravity flow columns (14 cm Econo-Pac, BioRad) and the flow-through re-applied once before each column was washed twice with 30 mL buffer W (40 mM HEPES-NaOH, pH 7.5, 150 mM NaOAc, 10% v/v glycerol, 0.005% v/v TWEEN 20, 0.5 mM TCEP). Each column was then washed once with 12.5 mL buffer W + 500 μM ATP + 5 mM Mg(OAc) 2 , incubating for 5 min partway through, before a final wash with 20 mL of buffer W + 2 mM CaCl 2 . Protein was eluted by successive addition of one CV buffer W + 2 mM CaCl 2 + 0.2 mg/mL 3xFLAG peptide [Sigma], followed by two CV buffer W + 2 mM CaCl 2 + 0.1 mg/mL 3xFLAG peptide, and finally one CV of buffer W + 2 mM CaCl 2 . The FLAG-eluate was pooled and incubated with up to 1.2 mL Calmodulin Sepharose 4B affinity resin (GE Healthcare), rotating at 7 rpm for 1 h at 4°C. The sample was applied to a gravity flow column (9 cm Poly-Prep Chromatography Columns, Bio-Rad) and the flow-through reapplied twice. The column was washed twice with 20 mL buffer C (25 mM HEPES-NaOH, pH 7.5, 150 mM NaOAc, 0.5 mM TCEP) + 2 mM CaCl 2 before elution using 3-5 mL buffer C + 2 mM EDTA + 2 mM EGTA. The sample was concentrated to 300 μL using 0.5 mL 30K MWCO centrifugal filters (Amicon) in a bench-top centrifuge (21,000 g , 4°C). The sample was split across two glycerol gradients prepared as described above, with one gradient containing glutaraldehyde and used for subsequent sample preparation steps, while the second gradient lacked cross-linking agents to allow assessment of complex migration. The sample was separated by centrifugation in an SW 40 Ti rotor (Beckman) at 140,000 g for 15 h at 4°C. Samples were manually fractionated in 400 μL fractions and analyzed by SDS-PAGE. The relevant fraction was buffer exchanged in buffer C + 0.005% v/v TWEEN 20 (Sigma, Cat# P8341) over six rounds of centrifugation (21,300 g , 1 min/round, 4°C) in 0.5 mL 30K MWCO centrifugal filters (Amicon). The sample was concentrated to a final volume of ∼35 μL. In early cryo-EM datasets we observed higher compositional heterogeneity of the complex likely arising from endogenous DNA co-purifying with our sample. In an attempt to overcome this, later sample preparations contained 10 μL streptavidin-blocked fork DNA added to the relevant fraction taken from glycerol gradients and incubated on ice for 15 min after gradient fixation and before buffer exchange. To prepare streptavidin-blocked fork DNA, 10 μL fork DNA (26.5 μM) was incubated with 12.5 μL tetravalent streptavidin (21 μM, Pierce) at room temperature for 40 min prior to addition of DNA to a purified replisome. The addition of DNA after the final centrifugation step did not alter DNA homogeneity in our cryo-EM reconstructions, and therefore data obtained from samples prepared with and without added streptavidin-blocked fork DNA were combined during processing. Co-expression and purification of non-cross-linked CMG-Csm3/Tof1-Mrc1-Ctf4 complexes for cryo-EM One sample was prepared as described for the co-expressed sample above (with SA-blocked fork DNA added) except with cross-linker omitted from the glycerol gradient. This was used to assess the impact of cross-linker on the architecture of the complex ( Figure S3 I).
Cryo-EM grid preparation
Reconstituted and co-expressed complex Quantifoil R2/2, Cu-400 mesh cryo-EM grids pre-coated with an ultra-thin (3-5 nm) amorphous carbon (produced at the LMB) were glow discharged for 5 s at a plasma current of 15 mA (PELCO easiGlow). Sample (3 μL) was applied and incubated for 15-30 s at 4°C before manually blotting with filter paper for 10 s and plunge-freezing in liquid ethane (approx. −180°C).
Data collection Reconstituted sample
A total of 6,878 raw micrographs were acquired across two datasets on the same 300 keV FEI Titan Krios microscope (LMB Krios3) at a calibrated pixel size of 1.049 Å/pixel (nominal magnification of 130,000 X). The K2 Summit direct electron detector (Gatan) was used in electron counting mode with a GIF Quantum energy filter slit width of 20 eV. EPU (ThermoFisher) was used for automated data collection, with a defocus range set at −1.4 to −2.6 μm and dose-fractionation into 20 fractions per movie, with a total exposure time of 7-8 s to achieve a dose of 37-38 e - /Å 2 per micrograph. Co-expressed sample Six datasets were collected totaling 11,637 raw micrographs. The 300 keV FEI Titan Krios microscopes (LMB Krios1 and Krios2, eBIC Krios M03 and ESRF Krios1) were used with either a Falcon III direct electron detector (FEI) or a K2 Summit direct electron detector (Gatan), both in electron counting mode. The data were acquired at several magnifications ranging from 1.05-1.07 Å/pixel. EPU (ThermoFisher) was used for automated data collection with a defocus range set to −1.5 to −3 μm. For data acquired with a Falcon III detector the acquisition was dose-fractionated into 180 fractions with an exposure time of 44 s per micrograph and a dose of 0.82 - 0.84 e - /pixel/s. Data collected with a K2 camera were dose-fractionated into 20 fractions with a total exposure time of 6-8 s to achieve a dose per micrograph of 37-43 e - /Å 2 . The slit width of the GIF Quantum energy filter was set to 20 eV. Co-expressed sample prepared without cross-linking A single dataset of 2,527 raw micrographs was collected on a 300 keV Titan Krios microscope (LMB Krios2) equipped with a Falcon III direct electron detector (FEI) operated in electron counting mode and with a pixel size of 1.07 Å/pixel (nominal magnification of 75,000 X). EPU (ThermoFisher) with on-the-fly motion correction was used for automated data acquisition with a defocus range set at −2 to −3 μm, dose-fractionating each micrograph into 180 fractions. An exposure time of 44 s was used with a dose of 0.82 e - /pixel/s.
Data processing and 3D-reconstruction for the reconstituted sample
The gain-corrected 20-frame movies were aligned and dose-weighted (0.25-0.27 e - /Å 2 /frame) by MotionCor2 ( Zheng et al., 2017 ). The contrast transfer function (CTF) parameters were calculated using Gctf ( Zhang, 2016 ). Gautomatch ( https://www.mrc-lmb.cam.ac.uk/kzhang/Gautomatch/ ) was used for automated particle picking on the remaining 6682 micrographs after manually discarding those containing contamination, no particles, significant drift or damaged holes. RELION 3.0-alpha was used for the entire data processing ( Nakane et al., 2018 , Scheres, 2012a , Scheres, 2012b , Zivanov et al., 2018 ). 632,000 particles were extracted with down-sampling by a factor of 2 and submitted for four rounds of 2D classification from which 472,000 selected particles were re-extracted without down-sampling in a box size of 360 pixels and submitted for 3D classification using a regularization parameter (T) of 4. Four of eight good 3D classes were included in further processing ( Figure S2 ). Two classes containing the best Csm3/Tof1 density (nearly 300,000 particles, 60%) were combined and 3D-refined before performing further rounds of CTF refinement, Bayesian polishing ( Zivanov et al., 2019 ) and 3D-refinement to yield a map at an overall 3.1 Å resolution (all resolutions hereafter calculated with Gold standard Fourier shell correlation of 0.143). The precise pixel size of 1.049 Å was determined after maximizing the cross-correlation coefficient between our 3.1 Å map and the CMG:DNA model (PDB: 5U8S ) ( Georgescu et al., 2017 ) using Chimera ( Pettersen et al., 2004 ). This pixel size was then used for postprocessing all maps obtained in this dataset. To further improve the Csm3/Tof1 density, multi-body refinement ( Nakane et al., 2018 ) was performed for (i) the Tof1 Head including N-tier regions of Mcm2, 3, 5, and (ii) the Tof1 Body/Csm3 including the N-tier regions of Mcm4, 6, 7 and dsDNA ( Figure S2 ). Resulting maps were sharpened with B-factor −20 Å 2 to give final maps of 3.3 and 3.2 Å resolution, respectively. These maps were used for building the models of Csm3, Tof1 and dsDNA. For the remainder of the complex, the above 3D classification identified two conformations differing in the position of the MCM C-tier and bound ssDNA (conformations 1 and 2). One class represented complexes in conformation 1 and containing Csm3/Tof1 (124,000 particles; 26%). One class represented complexes in conformation 2 and containing Csm3/Tof1 (159,000 particles, 34%). A third class represented a mixed population of particles in both conformations, lacking clear density for Csm3/Tof1; this class was separated into conformation 1 (74,000 particles; 16%) and conformation 2 (23,000 particles; 5%) using 3D subclassification without alignment. For conformation 1 ( Figure S2 , gray maps), all classes in this conformation were combined irrespective of Csm3/Tof1 occupancy (198,000 particles; 42%) and 3D-refined, before performing CTF refinement, Bayesian polishing, another round of 3D refinement and map sharpening to yield a map at 3.2 Å resolution. Multi-body refinement was performed masking more rigidly-associated regions of the complex as described in Figure S2 . After map sharpening, the resulting maps were used to build the atomic models of CMG and Ctf4 for conformation 1. The above multi-body refinement maps were sharpened with the following B-factors: −40 Å 2 for the Mcm2356 map, −5 Å 2 for the Mcm47 map, −20 Å 2 for the remaining bodies. For conformation 2 ( Figure S2 , yellow maps), a similar approach was taken as for conformation 1. After multi-body refinement, fitting of models to the conformation 2 density confirmed the only major differences between conformations was the position of the C-tier and bound ssDNA. Consequently, the maps for the MCM C-tier, Mcm3467 and Mcm25 were sharpened with B-factors −20, −10 and −10 Å 2 respectively, and used to build the model of the MCM C-tier in conformation 2. An additional map produced after a further round of 3D subclassification (see below) was also used to aid model building for conformation 2. After initial model building, it was clear there was a mixed population differing in AMP-PNP occupancy for conformation 2. To resolve these populations, the good particles from the original 3D-classification were combined before performing a further round of 3D-subclassification using a higher value T of 10 and limiting the Fourier components used in alignment to 10 Å resolution (refer to Figure S2 ). Of 12 classes, one represented complexes in conformation 2 with five AMP-PNP molecules bound to the C-tier ( Figure S2 , magenta map), and a second with particles in conformation 2 with three AMP-PNP molecules bound and a shorter region of ssDNA resolved ( Figure S2 , cyan map). Models were fitted to these and the AMP-PNP occupancy and ssDNA length adjusted accordingly (presented in Figure 3 B). The map with five AMP-PNP molecules bound was then submitted for two-body multi-body refinement with one body covering Mcm25 and Mcm6 CTD; after map sharpening with a B-factor of −5 Å 2 , this map was useful in aiding final model building for the model of conformation 2. Finally it is worth noting this further 3D-subclassification additionally yielded a 3.7 Å resolution sharpened map of conformation 1 with more homogeneous resolution across all subunits in the complex. To produce the cryo-EM density map best illustrating regions of unassigned density ( Figure S3 M) the subset of particles in conformation 2, which produced the 3.3 Å map of the whole complex (see Figure S2 , yellow map), was subjected to a further round of 3D sub-classification without alignment, this time utilizing a higher value T of 100 in addition to providing a mask which encompassed Csm3/Tof1, dsDNA and the N-tier regions primarily belonging to Mcm4 and 6. Of six classes, four classes (50% of input particles) contained good Csm3/Tof1 and dsDNA density; these were recombined, 3D-refined and finally sharpened with a B-factor of −5 Å 2 . Local resolution was calculated using RELION and maps were colored accordingly using Chimera ( Pettersen et al., 2004 ), presented in Figure S1 K.
Data processing and 3D-reconstruction for the cross-linked co-expressed sample
A total of six datasets totaling 11,647 raw movies were collected and processed independently using first RELION-2.1 and then RELION 3.0-alpha ( Scheres, 2012a , Scheres, 2012b , Zivanov et al., 2018 ). In general, raw movies were aligned and dose-weighted by MotionCor2 ( Zheng et al., 2017 ) and CTF parameters were estimated using Gctf ( Zhang, 2016 ). Poor micrographs (containing contamination, no particles, significant drift or damaged holes) were manually excluded from each dataset. All particles were picked using Gautomatch ( https://www.mrc-lmb.cam.ac.uk/kzhang/Gautomatch/ ). After one to two rounds of 2D-classification, followed by 3D-classification and 3D-refinement, the sharpened maps for the best classes from all six datasets were compared in Chimera in order to calculate scaling factors necessary for combining the datasets initially acquired at different microscope magnifications. Refined particles from five datasets were rescaled to the relative pixel size of the sixth dataset at 1.11 Å/pixel after re-estimation of the CTF parameters followed by particle re-extraction using a box size of 360 pixels ( Wilkinson et al., 2019 ). The combined dataset comprised 412,000 particles, which were submitted for 3D-refinement. The resulting 3.4 Å map was sharpened with a B-factor of −20 Å 2 and is presented in Figure S3 J (see also Figures S3 E and S3F). To improve the resolution of the complex, a three-body multi-body refinement was performed with bodies encompassing either the MCM C-tier, Csm3-Tof1-dsDNA or the remainder; the sharpened maps are presented in Figure S3 G.
Data processing and 3D-reconstruction for the non-crosslinked co-expressed sample
Micrographs were processed using RELION-2.1 ( Scheres, 2012a , Scheres, 2012b , Zivanov et al., 2018 ). Raw movies were aligned and dose-weighted by MotionCor2 ( Zheng et al., 2017 ) and CTF parameters were estimated using Gctf ( Zhang, 2016 ). Poor micrographs (containing contamination, no particles, significant drift or damaged holes) were manually excluded from each dataset. Particles were picked from the remaining 2387 micrographs using Gautomatch ( https://www.mrc-lmb.cam.ac.uk/kzhang/Gautomatch/ ). A total of 413,000 particles were extracted and down-sampled by a factor of two before submission to two rounds of 2D classification. It was clear from 2D classification that there was a significant number of particles comprising more than one CMG molecule. Classes were stringently selected to contain complexes with a single copy of CMG, yielding 70,000 particles. These were subsequently submitted for 3D classification across six classes: heterogeneity was observed for Csm3-Tof1 and Ctf4 occupancy, with one class representing particles containing CMG-Csm3-Tof1-Ctf4-DNA. This class (28,000 particles) was re-extracted without down-sampling, 3D-refined and sharpened (B-factor of −50 Å 2 ) to yield a map at 5.1 Å resolution (presented in Figure S3 I).
Model building and refinement
Model building was carried out in Coot ( Emsley et al., 2010 ) for the reconstituted sample using maps generated by multi-body refinement, as detailed in the data processing sections. An atomic model was built for conformation 1 ( Table S1 ). As initial template models, CMG:DNA (PDB: 5U8S ) ( Georgescu et al., 2017 ) and the crystal structure of the C-terminal regions of Ctf4 (PDB: 4C8H ) ( Simon et al., 2014 ) were used where individual subunits were fitted as rigid bodies to the relevant multi-body refinement maps using Chimera (UCSF) ( Pettersen et al., 2004 ), with N- and C-tier regions of MCM subunits fitted separately. It was notable that the resolution of MCM C-tier subunits was variable, with Mcm2, 3, 5 and 6 (those binding AMP-PNP and ssDNA) better resolved than Mcm4 and 7. Subunits were then jiggle-fitted and morphed to the relevant maps in Coot , prior to adjusting the models to density manually using local refinement and regularization. For Mcm subunits, the regions N-terminal to the helical domain (N-terminal extension, NTE) of Mcm2, 4 and 6 were extended, with 28 residues built for the Mcm2 NTE, 12 residues built for the Mcm6 NTE, and remodelling of 6 residues of the Mcm4 NTE ( Figure S1 M). These NTE regions contain Tof1 binding sites. 172 residues were not observed for the NTE of Mcm2, although unassigned density is present in the vicinity and may account for some of these residues. The MCM Zinc-finger (ZnF) domains were rebuilt with tetrahedrally-coordinated Zn 2+ ions placed in the spherical density that was observed at low contour level between four cysteine residues in each of the ZnF domains in Mcm2, 4, 5, 6 and 7. The Mcm5 ZnF was based on the MCM double hexamer template model (PDB: 5BK4 ) ( Noguchi et al., 2017 ). The N-terminal hairpin (NTH) loops of Mcm7 (the separation pin, 362-368) and Mcm2 (436-443) were remodelled as α-helical, with the Mcm6 NTH also significantly remodelled. The linkers between N- and C-tier were built fully as loops for Mcm2 (459-476) and 5 (339-363) and an α-helix (501-508) was built for the mostly disordered N/C-tier linker of Mcm6 (463-509). In the C-tier, the ssDNA-binding regions (helix H2, H2I loops and PS1 loops) showed much improved density, which required significant remodelling in terms of repositioning and extending the Cα-backbone, assigning the correct sequence register and rebuilding side-chains. Density observed around the C-tier region of Mcm3 where the model is incomplete (vicinity of residue 583) remains unassigned. Additional helical density observed in the vicinity of Mcm6 could be potentially attributed to residues 202-251 and/or its N/C-tier linker, however this region was not included in the final model. The C-terminal winged-helix (WH) domain (851-877) was retained for Mcm4 in the lower-resolution density, as seen in prior structural work ( Georgescu et al., 2017 ). AMP-PNP/Mg 2+ was built in well resolved density at the Mcm2/6, 2/5 and 3/5 interfaces with side chains visible for WalkerA, WalkerB, Arg-finger and Sensor2 motifs ( Figure S1 H). For the remainder of CMG, model building was as follows. The N-terminal CIP-box of Sld5 taken from the crystal structure of this peptide bound to Ctf4 (PDB: 4C95 ) ( Simon et al., 2014 ) was rigid-body fitted and adjusted in clearly visible density. The model for Psf2 was extended for additional residues 33-38, which now appear to be ordered, presumably through the interaction of this region with the Ctf4 helical bundle. For Ctf4, the side-chains were adjusted, particularly at the interface with Cdc45 and Psf2. The N-terminal regions of Ctf4 (1-460), known to contain a WD40 domain in human And-1, could not be assigned to specific regions of density in our complex. Five residues of the Psf3 N-terminal His-tag were resolved in the density and are present in the model (N-Ser-His-Met-Ala-Ser-C). For conformation 2, the largest changes compared to conformation 1 were observed in the MCM C-tier and the length of bound ssDNA, therefore a model was built for this region by adjusting our MCM C-tier models for conformation 1 to density of conformation 2. The resolution of C-tier subunits varied, with those bound to AMP-PNP/Mg 2+ and 16-mer ssDNA (built as poly-dT) better resolved (the only AMP-PNP-free interface was observed between Mcm2 and 5). The major differences compared to conformation 1 were observed in the relative positions of individual MCM subunits and the positions of the ssDNA-binding loops. For Mcm4, density for the WH was no longer observed, while the linker connecting the WH to the AAA+ domain was repositioned away from the MCM central channel. Csm3/Tof1 was partially built de novo . The N terminus of Tof1 was identified in our density after rigid-body fitting of the fragment of human Timeless (PDB: 5MQI ) ( Holzer et al., 2017 ), which was then used for homology modeling of the Tof1 region comprising helical repeats 1-6 using Phyre2 ( Kelley et al., 2015 ). The Tof1 homology model was morphed and jiggle-fitted into our multi-body map of the Tof1 Head ( Figure S2 ), which was then manually adjusted and locally refined before building de novo the Ω-loop and the MCM-plugin, which extend between helical repeats 3-4 and 4-5, respectively. The Mcm6 NTE packs against the Ω-loop and this region was built as a composite Mcm6-Tof1 β sheet given good density. The density for the Ω-loop in the region facing the major groove of DNA indicates greater flexibility. The density and connectivity for the long MCM-plugin was of a good quality, in particular several prominent newly built secondary structure elements (helices Bridge and αW, and the Wedge β-hairpin, see Figure S7 E) packing against the interface with Mcm6, 4 and 7. The density of the MCM-plugin which protrudes into the minor groove of DNA could be well resolved and the side chains built represent those of the Tof1 DBM (401-404). Repeats 7-9 of Tof1 (the Body encompasses repeats 6-9, Figure S7 A) were built de novo up to residue 781 with certain loops being omitted due to lack of density ( Table S1 ). Following residue 781, the remaining novel density accounting for five helices was observed to have opposite polarity to helices in the Tof1 Body and the model for this density was built de novo with the sequence register assigned to the core of Csm3; in particular, the side chains of the helix α2 were well resolved with a prominent tryptophan side chain (W98). Additional density extending from a small helix α0 into the minor groove of dsDNA was built as the Csm3 DBM (46-53). This region is predicted to be disordered and is likely stabilized by interaction with DNA. The dsDNA was built in the density of a multi-body refinement map representing Tof1 Body /Csm3/dsDNA. Sequence register was assigned based on the sequence of our fork DNA assuming no unwinding due to the inclusion of AMP-PNP during sample preparation. Once rebuilt, subunits were refined in the relevant maps using Refmac ( Kovalevskiy et al., 2018 ), phenix.real_space_refine ( Afonine et al., 2018 ) and ISOLDE ( Croll, 2018 ). Model to cryo-EM map validation for conformation 1 and conformation 2 Fourier Shell Correlation (FSC) was calculated between the refined models (conformation 1 and MCM C-tier:ssDNA of conformation 2) and their respective unsharpened sums of the two half maps using XMIPP ( Sorzano et al., 2004 ). The above models were also refined with restraints against the respective half-1 maps and the FSC map-to-model curves were calculated for the half-1 and half-2 (not used for model refinement) maps ( Figure S1 I). Cross-linking mass spectrometry (XL-MS) The complex comprising CMG, Ctf4, Csm3/Tof1 and Mrc1 was purified following co-expression as described above. The eluate from the Calmodulin Sepharose 4B column (25 mM HEPES pH 7.5, 150 mM sodium acetate, 0.5 mM TCEP, 2 mM EDTA/EGTA) was immediately cross-linked with a 100-fold excess of the N-hydroxysuccinimide (NHS) ester disuccinimidyl dibutyric urea (DSBU, ThermoScientific, USA), with respect to the protein concentration. The cross-linking reactions were incubated for 60 min at room temperature and then quenched by the addition of NH 4 HCO 3 to a final concentration of 20 mM and incubated for further 15 min. The cross-linked proteins were then precipitated according to the method of Wessel and Flügge (1984) and resuspended in 8 M urea in 50 mM NH 4 HCO 3. The cross-linked proteins were reduced with 10 mM DTT and alkylated with 50 mM iodoacetamide. Following alkylation, the concentration of urea was reduced to 1 M by the addition of 50 mM NH 4 HCO 3 and the proteins digested with trypsin (Promega, UK) at an enzyme-to-substrate ratio of 1:100, for 1 h at room temperature and then further digested overnight at 37°C following a subsequent addition of trypsin at a ratio of 1:20. The peptide digests were then fractionated batch-wise by high pH reverse phase chromatography on micro spin C18 columns (Harvard Apparatus, USA), into five fractions (10 mM NH 4 HCO 3 /10% v/v acetonitrile pH 8, 10 mM NH 4 HCO 3 /20% v/v acetonitrile pH 8, 10 mM NH 4 HCO 3 /30% v/v acetonitrile pH 8, 10 mM NH 4 HCO 3 /50% v/v acetonitrile pH 8 and 10 mM NH 4 HCO 3 /80% v/v acetonitrile pH 8). The 150 μL fractions were evaporated to dryness on a CoolSafe lyophilizer (ScanVac, Denmark) prior to analysis by LC-MS/MS. Lyophilized peptides for LC-MS/MS were resuspended in 0.1% v/v formic acid and 2% v/v acetonitrile and analyzed by nano-scale capillary LC-MS/MS using an Ultimate U3000 HPLC (ThermoScientific Dionex, USA) to deliver a flow of approximately 300 nl/min. A C18 Acclaim PepMap100 5 μm, 100 μm × 20 mm nanoViper (ThermoScientific Dionex, USA), trapped the peptides before separation on a C18 Acclaim PepMap100 3 μm, 75 μm × 250 mm nanoViper (ThermoScientific Dionex, USA). Peptides were eluted with a gradient of acetonitrile. The analytical column outlet was directly interfaced via a nano-flow electrospray ionisation source, with a quadrupole Orbitrap mass spectrometer (Q-Exactive HFX, ThermoScientific, USA). MS data were acquired in data-dependent mode using a top 10 method, where ions with a precursor charge state of 1+ and 2+ were excluded. High-resolution full scans (R = 120 000, m/z 300-1800) were recorded in the Orbitrap followed by higher energy collision dissociation (HCD) (stepped collision energy 26 and 28% Normalized Collision Energy) of the 10 most intense MS peaks. The fragment ion spectra were acquired at a resolution of 50,000 and dynamic exclusion window of 20 s was applied. For data analysis, Xcalibur raw files were converted into the MGF format using MSConvert (Proteowizard) ( Kessner et al., 2008 ) and used directly as input files for MeroX ( Götze et al., 2015 ). Searches were performed against an ad hoc protein database containing the sequences of the proteins in the complex and a set of randomized decoy sequences generated by the software. The following parameters were set for the searches: maximum number of missed cleavages 3; targeted residues K, S, Y and T; minimum peptide length 5 amino acids; variable modifications: carbamidomethylation of cysteine (mass shift 57.02146 Da), Methionine oxidation (mass shift 15.99491 Da); DSBU modified fragments: 85.05276 Da and 111.03203 Da (precision: 5 ppm MS and 10 ppm MS/MS); False Discovery Rate cut-off: 5%. Finally, each fragmentation spectrum was manually inspected and validated.
Origin-dependent DNA replication assays
Origin-dependent replication assays were performed essentially as described previously ( Aria and Yeeles, 2018 , Taylor and Yeeles, 2018 ). MCM loading was performed at 24°C in reactions (typically 35 μl) containing 25 mM HEPES-KOH pH 7.6, 100 mM K-glutamate, 0.01% v/v Nonidet P40 substitute (NP-40-S) (Roche #11754599001), 1 mM DTT, 10 mM Mg(OAc) 2 , 40 mM KCl, 0.1 mg/ml BSA, 3 mM ATP, 3 nM AhdI-linearized vVA20 template ( Aria and Yeeles, 2018 ), 75 nM Cdt1⋅Mcm2-7, 40 nM Cdc6, 25 nM DDK, 20 nM ORC. After 10 min S-CDK was added to a final concentration of 80 nM and incubation continued at 24°C for 5 min. Reactions were diluted 4-fold into replication buffer to give final reaction concentrations (accounting for subsequent addition of replication proteins) of 25 mM HEPES-KOH pH 7.6, 250 mM K-glutamate, 0.01% NP-40-S, 1 mM DTT, 10 mM Mg(OAc) 2 , 10 mM KCl, 0.1 mg/ml BSA, 3 mM ATP, 200 μM C/G/UTP, 30 μM dA/dT/dG/dCTP, 1 μCi [α- 32 P]-dCTP, 0.75 nM AhdI-linearized vVA20 template, 18.75 nM Cdt1⋅Mcm2-7, 10 nM Cdc6, 6.25 nM DDK, 5 nM ORC. Reactions were equilibrated at 30°C (∼1 min) and replication initiated by addition of replication proteins from a master mix to the following final concentrations: 30 nM Dpb11, 100 nM GINS, 30 nM Cdc45, 10 nM Mcm10, 20 nM Pol ε, 20 nM Ctf4, 100 nM RPA, 20 nM RFC, 20 nM PCNA, 20 nM Pol α, 10 nM Pol δ, 12.5 nM Sld3/7, 20 nM Sld2, 20 nM Mrc1 and 20 nM Csm3/Tof1 or mutants where indicated. Reactions were quenched by addition of an equal volume of 100 mM EDTA and samples were processed as previously described ( Aria and Yeeles, 2018 , Taylor and Yeeles, 2018 ). RFB experiments were performed on AhdI-linearized vJY30 ( Table S3 ) and Fob1 was added together with the MCM loading proteins to a concentration of 250 nM (62.5 nM after dilution into replication buffer).
Replisome association assays
MCM loading was performed at 30°C in reactions containing 25 mM HEPES-KOH pH 7.6, 100 mM K-glutamate, 0.01% v/v NP-40-S, 1 mM DTT, 10 mM Mg(OAc) 2 , 0.1 mg/ml BSA, 3 mM ATP, 3 nM vVA20 template ( Aria and Yeeles, 2018 ), 75 nM Cdt1⋅Mcm2-7, 40 nM Cdc6, 25 nM DDK, 14 nM ORC. After 30 min reactions were diluted 2-fold into replication buffer to give final reaction concentrations (accounting for subsequent addition of replication proteins) of 25 mM HEPES-KOH pH 7.6, 250 mM K-glutamate, 0.01% NP-40-S, 1 mM DTT, 10 mM Mg(OAc) 2 , 0.1 mg/ml BSA, 3 mM ATP, 200 μM C/G/UTP, 30 μM dA/dT/dG/dCTP, 1.5 nM vVA20 template, 37.5 nM Cdt1⋅Mcm2-7, 20 nM Cdc6, 12.5 nM DDK, 7 nM ORC. Replication was initiated by addition of replication proteins from a master mix to the following final concentrations: 30 nM Dpb11, 100 nM GINS, 30 nM Cdc45, 10 nM Mcm10, 20 nM Pol ε, 20 nM Ctf4, 100 nM RPA, 20 nM RFC, 20 nM PCNA, 20 nM Pol α, 12.5 nM Sld3/7, 20 nM Sld2, 10 nM Mrc1 and 20 nM Csm3/Tof1 or mutants where indicated. After 25 min, samples (13 μl) were directly applied to 400 μL (bed volume) Sephacryl S-400 columns (GE healthcare) equilibrated in 25 mM HEPES-NaOH pH 7.5, 150 mM NaOAc, 10 mM Mg(OAc) 2 , 1 mM DTT, 0.01% v/v NP-40-S and 0.1 mM ATP. Columns were centrifuged (750 g, 2 min, 21°C) and the eluate was analyzed by SDS-PAGE and western blotting. Cdc45 was detected using its FLAG epitope with an anti-FLAG antibody (A8592, Sigma). RPA was detected with an antibody against the Rpa1 subunit (AS07 214). Mcm7, Psf1, Ctf4, Csm3 and Mrc1 were detected with sheep polyclonal antibodies ( Maric et al., 2014 , Mukherjee and Labib, 2019 ).
Electrophoretic mobility-shift assays
Csm3/Tof1 wild-type or mutant proteins were mixed with fork DNA prepared as for cryo-EM sample preparation (40 nM final [DNA]), at a molar ratio of protein:DNA of 1:1, 2:1, 4:1 and 8:1 in a reaction buffer containing 25 mM HEPES-KOH, pH 7.6, 100 mM KOAc, 2 mM Mg(OAc) 2 , 0.2% NP40 and 1 mM DTT and incubated on ice for 30 min. Ficoll 400 was added to each 15 μL reaction to a final concentration of 2.3% v/v before loading onto 4% native polyacrylamide gels for analysis. Gels were imaged using a Typhoon fluorescence imager (Amersham) at the Cy3 excitation wavelength of 532 nm.
Phosbind SDS-PAGE Prior to electrophoresis
Csm3/Tof1 was treated with Lambda protein phosphatase (λ-PP) in a reaction (100 μl) containing 50 mM HEPES-NaOH pH 7.5, 100 mM NaCl, 2 mM DTT, 1 mM MnCl 2 , 300 nM Csm3/Tof1 and 0.1 mg/ml λ-PP ( Zhuo et al., 1993 ) for 40 min at 37°C. Samples (10 μl) were separated through 5% polyacrylamide gels containing 353 mM Bis-Tris-HCL pH 6.8, 100 μM ZnCl 2 and 50 μM Phosbind (APExBio). Control gels were also run in the absence of Phosbind. Electrophoresis was performed in 1x NuPAGE MOPS running buffer (Invitrogen) at 30 mA for ∼90 min and gels were stained with Coomassie InstantBlue (Expedeon).
Camptothecin sensitivity assays
Saturated cultures of S. cerevisiae grown in YEP + 2% w/v glucose were diluted to an A 600 of 0.2 and were grown to an A 600 of ∼0.6-0.8 in YEP + 2% w/v glucose at 30°C. Cells were harvested and resuspended in YEP + 2% w/v glucose + 100 μg/ml ampicillin or sterile water to a A 600 of 0.5. Cells from a 10-fold serial dilution in YEP + 2% w/v glucose + 100 μg/ml ampicillin or sterile water were then plated (8 μl) on YEPD agar plates supplemented with either DMSO or camptothecin (Merck). Multiple sequence alignments Amino acid sequences were retrieved from relevant databases (NCBI or SGD where stated; UniProt otherwise) ( Cherry et al., 2012 , UniProt Consortium, 2019 ). Alignment was performed using MUSCLE (EMBL-EBI) ( Edgar, 2004 ). The alignment was rendered using ESPript3.0 ( http://espript.ibcp.fr ) ( Robert and Gouet, 2014 ).
Structural analysis and visualization
All figures of structures were plotted in PyMOL ( SchrödingerLLC, 2015 ), Chimera ( Pettersen et al., 2004 ) or ChimeraX ( Goddard et al., 2018 ). Calculations of buried surface area were performed using PDBePISA ( Krissinel and Henrick, 2007 ). XL-MS crosslinks mapped to the atomic model in Figures S3 J and S3K were plotted using the UCSF Chimera ( Pettersen et al., 2004 ) plugin Xlink Analyzer ( Kosinski et al., 2015 ).
Supporting Citations The following references appear in the Supplemental Information: Enemark and Joshua-Tor, 2006 , Hodgson et al., 2007 , Holm and Sander, 1995 , Iacobucci et al., 2018 , Ishiyama et al., 2010 , Itsathitphaisarn et al., 2012 , Morohashi et al., 2009 , Singleton et al., 2004 , Thomsen et al., 2016 , Velankar et al., 1999 , Wilson et al., 1995 .
Supplemental Information Document S1. Figures S1–S10 and Tables S1 and S3–S5 Table S2 Summary of Cross-Links Identified in Cross-Linking Mass Spectrometry Experiments, Related to Figure 2 The quality of the fragment ion assignment is measured by a scoring function (score) (Iacobucci et al., 2018). Briefly, all peptide pairs matching the identified reporter ions are subjected to scoring. The score is determined in relation to the presence and intensity of the DSBU reporter ions, the number and length of peptide backbone ion series, and the number of identified ions related to the spectrum size and the number of possible fragment ions created from a theoretical peptide pair. To correct for random overlaps, features are also calculated for spectra with slightly shifted mass values (Iacobucci et al., 2018). Only peptides used in analysis with a score of ≥60 are shown. Document S2. Article plus Supplemental Information
📊 Figures

Figureu00a01
Structure of CMG Bound to Csm3/Tof1, Ctf4, and a DNA Fork (A) Silver-stained SDS-PAGE of a representative glycerol gradient fraction of a non-cross-linked sample (fraction 11, Figureu00a0S1 B) equival...

Figureu00a02
XL-MS Identifies the Position of Mrc1 in the Eukaryotic Replisome (A) Summary of cross-linking mass spectrometry (XL-MS) for a co-expressed replisome subcomplex (see Table S2 for details of all inter-...

Figureu00a03
Interaction of Eukaryotic CMG Helicase with Fork DNA (A) Cutaway showing the path of DNA approaching and traversing the MCM central channel in conformation 1. (B) Comparison of the MCM C tier between ...

Figure 4
Csm3/Tof1 Structure (A) Structures of Tof1 and Csm3 shown as cylinders above the MCM N tier (surface representation). Tof1 insertions (cartoon representation): the u03a9-loop (orange) and the MCM-plug...

Figureu00a05
Tof1 Interactions with MCM and DNA (A) Overview of the Tof1 MCM-plugin (red) and its position on the MCM N tier. Top: the MCM-plugin is shown in cartoon representation above the MCM N tier (surface re...
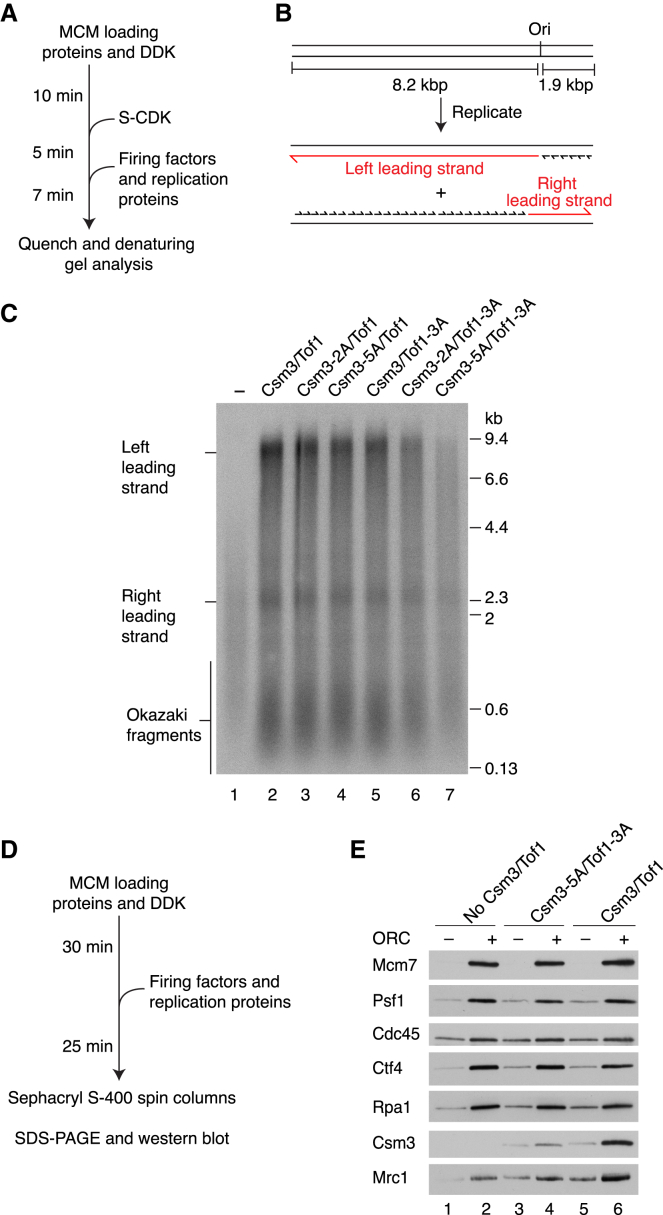
Figureu00a06
Csm3/Tof1 DNA Binding Is Important for Replisome Stability (A) Reaction scheme for origin-dependent replication assay. (B) Schematic of the DNA template and anticipated replication products. (C) Origi...

Figureu00a07
The Csm3/Tof1 dsDNA Grip Is Required for Efficient Fork Pausing (A) Schematic of the template used for replication fork barrier (RFB) experiments and the anticipated products of fork stalling at the R...
Figure images are served from the NIH/NLM PubMed Central Open Access Subset or Europe PMC; copyright remains with the publishers and authors.
💬 Discussion
0 commentsNo comments yet. Be the first to start a discussion!
Leave a Comment