Abstract
This study presents the isolation, characterization, and kinetic analyses of cellulose nanocrystals (CNCs) from date palm waste in the United Arab Emirates. After bleaching date palm stem waste with acidified NaClO2 and delignification via NaOH treatments, cellulose was extracted. Mineral acid hydrolysis (62 wt % H2SO4) was performed at 45 °C for 45 min to produce crystalline nanocellulose. Fourier transform infrared (FTIR) and chemical composition analysis confirmed the removal of noncellulosic constituents. The crystallinity index increased gradually with chemical treatments, according to the obtained X-ray diffraction (XRD) results. Thermogravimetric analysis and differential scanning calorimetry results revealed that the CNC has high thermal stability. The Coats-Redfern method was used to determine the kinetic parameters. The kinetic analysis confirmed that CNC has more activation energy than cellulose and thus confirms its compact and resistive crystalline structure. This has been attributable to the stronger hydrogen bonding in CNC crystalline domains than that in cellulose crystalline domains. Scanning electron microscopy revealed that lignin and hemicellulose were eliminated after chemical pretreatments, and CNC with a rodlike shape was obtained after hydrolysis. Moreover, transmission electron microscopy confirmed the nanoscale of crystalline cellulose. ζ potential analysis indicated that the CNC afforded a stable suspension (-29.27 mV), which is less prone to flocculation. Kinetic analyses of cellulose and cellulose nanocrystals isolated from date palm waste are useful for making composites and designing selective pyrolysis reactors.
🔬 Techniques
🔭 Microscopes
🏭 Microscope Brands
🧪 Reagent Suppliers
🏛️ Research Organizations (ROR)
Affiliated research institutions:
📋 Methods
Materials Date palm stem waste
(Lulu palm tree) was obtained from the UAE University’s Al-Foah experimental farm. The woody biomass was first ground with a shredder and then using a mechanical grinder to a mesh size of 160 μm. Sigma-Aldrich provided sodium chlorite, sodium hydroxide (bioXtra 98%), acetic acid glacial (100%), sulfuric acid (95–97%), and dialysis tubing (14 000 Da).
Isolation of Cellulose from Palm Waste Raw date fiber
(R-DW) was bleached with an acidified 4% w/v NaClO 2 solution. Before bleaching, the pH of the NaClO 2 solution was brought to 3.5–4 by adding glacial acetic acid solution (10% v/v). At 80 °C and after 1 h of stirring, the fiber-to-NaClO 2 solution ratio was 1:50 (10 g of raw fibers into 500 mL of NaClO 2 solution). Vacuum-filtered bleached fiber (B-DW) was washed several times with fresh water until the pH of the filtrate reached 6.5–7. For 24 h, B-DW was placed in an air-circulating oven at 105 °C. B-DW was delignified using a 4% w/v NaOH solution at 25–30 °C and stirring for 30 min, with a fiber-to-NaOH solution ratio of 1:50 (10 g of B-DW into 500 mL of NaOH solution). The delignified sample (D-DW) was vacuum-filtered and rinsed with fresh water several times until the pH of the filtrate reached 6.5–7. D-DW was also stored for 24 h in an air-circulating oven at 105 °C.
Isolation of Cellulose Nanocrystals
The method used for CNC extraction was modified from previous studies. 42 , 43 CNCs were extracted from cellulose (D-DW) using mineral acid hydrolysis (62 wt % H 2 SO 4 ) conducted at 45 °C with a reaction time of 45 min and an acid-to-fiber ratio of 1:20. The hydrolysis was terminated by diluting the solution 20 times with deionized water (4 °C). The suspension was centrifuged for 20 min at 8000 rpm to remove the residual sulfuric acid. The fibers were washed again in deionized water and centrifuged seven times until the supernatant pH was 4.5–6. The resulting nanofiber suspension was dialyzed against distilled water for 5 days, with a change of water every 24 h, until a consistent pH of 6.5–7 was obtained. Ultrasonication was then performed for 30 min to homogenize the nanofiber suspension. The cellulose nanocrystal suspension was then freeze-dried under vacuum at −85 °C to obtain CNCs and then kept in a refrigerator for further analysis. An overview of the CNC isolation process is presented in Figure 1 . Figure 1 Isolation process of cellulose nanocrystals. Characterization of Cellulose Nanocrystals 2.4.1 Thermogravimetric Analysis (TGA) The thermal property profiles of R-DW, B-DW, D-DW, and CNC were measured using a thermogravimetric analyzer. Test samples with a preset weight of 5–10 mg were analyzed using thermogravimetric analysis (TGA, Q 500 series, TA Instruments). The thermal profiles of the four samples were analyzed at a constant heating rate of 10 °C/min up to 800 °C in a nitrogen environment (60 mL/min). Differential Scanning Calorimetry (DSC) The thermomolecular characteristics were investigated using differential scanning calorimetry from TA equipment (DSC25). The differential scanning calorimetric (DSC) analysis of a 5 mg CNC sample was performed at temperatures ranging from 30 to 350 °C. The heating rate was 10 °C/min in a N 2 atmosphere (50 mL/min). X-ray Diffraction (XRD) Cu K radiation was used to examine the sample with the following working lamp parameters: V = 40 kV, I = 30 mA, and receiving slit = 0.15 mm. With a scan range of 10–80 and a scan speed of 2°/min, the intensity of the reflections was measured. The crystallinity index of the samples was calculated using the Segal equation, as illustrated in eq 1 . 44 Scherrer equation was used to calculate the average crystallite size, as illustrated in eq 2 . 45 1 where Crl is the crystallinity index, I 200 denotes the diffracted intensity at the highest crystalline peak, and I am denotes the amorphous region’s diffraction intensity. 2 where L denotes the size of the crystal in nanometers. Constant k has a value of 0.89, h is the X-ray wavelength, and β is the full width at half-maximum (FWHM) height of the primary diffraction peak in radians. The FWHM of the samples’ X-ray diffraction (XRD) data was calculated using OriginPro software. h is the wavelength of X-ray sources (0.15406 nm). θ is the Bragg angle in radians equal to half of the 2θ. Fourier Transform Infrared (FTIR) Analysis A Fourier transform infrared (FTIR) spectrometer was used to perform functional chemistry studies (Shimadzu, Kyoto, Japan). The functional group variations at different wavelengths were investigated. The FTIR spectra were obtained using an attenuated total reflection FTIR (ATR-FTIR) spectrograph with an average of 34 scans and a spectral resolution of 4 cm –1 over a range of 500–4000 cm –1 . 2.4.5 ζ Potential and Average Particle Diameter Dynamic light scattering (DLS) was used to determine the average hydrodynamic diameter and particle size distribution of cellulose nanocrystals suspension (Otsuka Electronics, Japan). At 25 °C, particle size and ζ potential were measured in a fully automated mode. The CNC was diluted 100 times with deionized water and sonicated for 30 min before analysis.
Show full methods section
Materials Date palm stem waste
(Lulu palm tree) was obtained from the UAE University’s Al-Foah experimental farm. The woody biomass was first ground with a shredder and then using a mechanical grinder to a mesh size of 160 μm. Sigma-Aldrich provided sodium chlorite, sodium hydroxide (bioXtra 98%), acetic acid glacial (100%), sulfuric acid (95–97%), and dialysis tubing (14 000 Da).
Isolation of Cellulose from Palm Waste Raw date fiber
(R-DW) was bleached with an acidified 4% w/v NaClO 2 solution. Before bleaching, the pH of the NaClO 2 solution was brought to 3.5–4 by adding glacial acetic acid solution (10% v/v). At 80 °C and after 1 h of stirring, the fiber-to-NaClO 2 solution ratio was 1:50 (10 g of raw fibers into 500 mL of NaClO 2 solution). Vacuum-filtered bleached fiber (B-DW) was washed several times with fresh water until the pH of the filtrate reached 6.5–7. For 24 h, B-DW was placed in an air-circulating oven at 105 °C. B-DW was delignified using a 4% w/v NaOH solution at 25–30 °C and stirring for 30 min, with a fiber-to-NaOH solution ratio of 1:50 (10 g of B-DW into 500 mL of NaOH solution). The delignified sample (D-DW) was vacuum-filtered and rinsed with fresh water several times until the pH of the filtrate reached 6.5–7. D-DW was also stored for 24 h in an air-circulating oven at 105 °C.
Isolation of Cellulose Nanocrystals
The method used for CNC extraction was modified from previous studies. 42 , 43 CNCs were extracted from cellulose (D-DW) using mineral acid hydrolysis (62 wt % H 2 SO 4 ) conducted at 45 °C with a reaction time of 45 min and an acid-to-fiber ratio of 1:20. The hydrolysis was terminated by diluting the solution 20 times with deionized water (4 °C). The suspension was centrifuged for 20 min at 8000 rpm to remove the residual sulfuric acid. The fibers were washed again in deionized water and centrifuged seven times until the supernatant pH was 4.5–6. The resulting nanofiber suspension was dialyzed against distilled water for 5 days, with a change of water every 24 h, until a consistent pH of 6.5–7 was obtained. Ultrasonication was then performed for 30 min to homogenize the nanofiber suspension. The cellulose nanocrystal suspension was then freeze-dried under vacuum at −85 °C to obtain CNCs and then kept in a refrigerator for further analysis. An overview of the CNC isolation process is presented in Figure 1 . Figure 1 Isolation process of cellulose nanocrystals. Characterization of Cellulose Nanocrystals 2.4.1 Thermogravimetric Analysis (TGA) The thermal property profiles of R-DW, B-DW, D-DW, and CNC were measured using a thermogravimetric analyzer. Test samples with a preset weight of 5–10 mg were analyzed using thermogravimetric analysis (TGA, Q 500 series, TA Instruments). The thermal profiles of the four samples were analyzed at a constant heating rate of 10 °C/min up to 800 °C in a nitrogen environment (60 mL/min). Differential Scanning Calorimetry (DSC) The thermomolecular characteristics were investigated using differential scanning calorimetry from TA equipment (DSC25). The differential scanning calorimetric (DSC) analysis of a 5 mg CNC sample was performed at temperatures ranging from 30 to 350 °C. The heating rate was 10 °C/min in a N 2 atmosphere (50 mL/min). X-ray Diffraction (XRD) Cu K radiation was used to examine the sample with the following working lamp parameters: V = 40 kV, I = 30 mA, and receiving slit = 0.15 mm. With a scan range of 10–80 and a scan speed of 2°/min, the intensity of the reflections was measured. The crystallinity index of the samples was calculated using the Segal equation, as illustrated in eq 1 . 44 Scherrer equation was used to calculate the average crystallite size, as illustrated in eq 2 . 45 1 where Crl is the crystallinity index, I 200 denotes the diffracted intensity at the highest crystalline peak, and I am denotes the amorphous region’s diffraction intensity. 2 where L denotes the size of the crystal in nanometers. Constant k has a value of 0.89, h is the X-ray wavelength, and β is the full width at half-maximum (FWHM) height of the primary diffraction peak in radians. The FWHM of the samples’ X-ray diffraction (XRD) data was calculated using OriginPro software. h is the wavelength of X-ray sources (0.15406 nm). θ is the Bragg angle in radians equal to half of the 2θ. Fourier Transform Infrared (FTIR) Analysis A Fourier transform infrared (FTIR) spectrometer was used to perform functional chemistry studies (Shimadzu, Kyoto, Japan). The functional group variations at different wavelengths were investigated. The FTIR spectra were obtained using an attenuated total reflection FTIR (ATR-FTIR) spectrograph with an average of 34 scans and a spectral resolution of 4 cm –1 over a range of 500–4000 cm –1 . 2.4.5 ζ Potential and Average Particle Diameter Dynamic light scattering (DLS) was used to determine the average hydrodynamic diameter and particle size distribution of cellulose nanocrystals suspension (Otsuka Electronics, Japan). At 25 °C, particle size and ζ potential were measured in a fully automated mode. The CNC was diluted 100 times with deionized water and sonicated for 30 min before analysis.
Kinetic Analysis
The kinetics of extracted cellulose and cellulose nanocrystals from date palm waste were calculated using the Coats–Redfern method, which is a model-fitting approach. The samples’ activation energy ( E a ) was estimated using a fundamental Coats–Redfern equation, as illustrated in eq 3 . 46 3 2 RT / E a will be far less than 1. As a result, this expression has been eliminated. 47 , 48 The kinetic analyses are thus conducted using eq 4 . 4 Here, g (α) signifies the model that represents the reaction mechanism, β is the thermal ramp rate (°C/min), R stands for universal gas constant (0.008321 kJ/mol), T is the reaction temperature (K), and A is pre-exponential or frequency factor (m –1 ). α is the degree of transformation, which is calculated using eq 5 . 49 5 where m o is the original mass of the respective sample at t = 0, m i is the instantaneous mass of the respective sample at any time t , m f is the final mass of the respective sample. Plotting the left side of eq 4 versus 1/ T will yield both E a and A . The resultant straight line’s slope will be − E a / R and its intercept will be . Using the appropriate reaction mechanism model g (α), E a / R and A are found from the data taken from the slope and intercept of the regression lines. Reaction model mechanisms for solids have been considered using g (α), as shown in Table 1 . Table 1 Reaction Mechanism Models g (α) of the Coats–Redfern Method a symbol function models g (α) Chemical Reaction CRO 1 first order –ln(1 – α) CRO 2 second order [1/(1 – α)] – 1 Diffusion Reaction DM1 one-way transport α 2 DM2 two-way transport (1 – α) – ln(1 – α) + α DM3 three-way transport [[−ln(1 – α)] 1/3 ] 2 DM4 Valensi equation α + (1 – α)ln(1 – α) DM5 Ginstling–Brounshtein equation (1 – 2α/3) – (1 – α) 2/3 DM6 Zhuravlev equation [(1 – α) −1/3 – 1] 2 DM7 Jander equation [1 – (1 – α) 1/3 ] 2 DM8 Ginstling equation 1 – (0.67α) – (1 – α) 0.67 Geometric Reaction GM1 cylindrical shape 1 – (1 – α) 1/2 GM2 sphere shape 1 – (1 – α) 1/3 Nucleation Reaction NM1 1/2 Avrami–Erofeev equation [−ln(1 – α)] 1/2 NM2 1/3 Avrami–Erofeev equation [−ln(1 – α)] 1/3 a Adapted in part with permission from ref ( 50 ). Copyright 2022 Elsevier.
Morphological Analysis
The morphologies of R-DW, B-DW, D-DW, and CNC were observed using a scanning electron microscope (SEM) at a certain spatial resolution. A JEOL/EO SEM operating at 10 kV was used to examine the surface morphology of the samples. The samples were gold-coated prior to analysis to avoid electrostatic charge during the test. The material was dispersed in ethanol and sonicated for 30 min prior to analysis using a Tecnai transmission electron microscope (JEM-3000F, JEOL, Japan) at 200 kV. The nanoparticles at different spatial resolutions were observed via transmission electron microscopy (TEM).
Chemical Composition Analysis
Chemical composition analysis was performed to calculate the amounts of holocellulose, cellulose, and lignin in R-DW, B-DW, D-DW, and CNC. Hemicellulose was calculated by subtracting the amount of cellulose from that of holocellulose. To determine the extractives in R-DW, the Technical Association of Pulp and Paper Industry (TAPPI) standard method T 204-cm-97 is used. A 10 g sample was placed in a Soxhlet thimble and fitted to a 2000 mL Soxhlet extractor apparatus. The extraction was performed using 1000 mL of the ethanol–benzene mixture (ethanol/benzene = 1:2) for 12 h. The percent of extractives was considered based on the original weight of the sample. Holocellulose was calculated using the method presented by Wise; 51 5 g of the extracted sample was combined with 160 mL of distilled water, 0.5 mL of acetic acid, and 1.5 g of NaClO 2 in a solution. The mixture was heated to 70 °C for 1 h (the beaker was shaken every 5 min). Every hour, 0.5 mL of acetic acid and 1.5 g of NaClO 2 were added to the solution (a total of four additions of acetic acid and sodium chlorite). The solution mixture was vacuum-filtered to obtain holocellulose as a filter cake and washed with acetone and then with hot water until pH 6.5–7 was achieved. Finally, it was dried in an oven at 105 °C until it reached a steady weight. A percent of holocellulose was calculated based on the original mass of the sample. α-Cellulose was calculated based on a method presented by Hastuti et al. 52 Two grams of the extracted sample was added to a 50 mL 17.5% w/v NaOH solution and allowed to sit for 30 min at 25 °C. Then, 50 mL of DI water was added and mixed for 1 min before being set aside for 5 min. The weight of the dry filter paper was measured before filtration. The sample was vacuum-filtered three times—once with 1200 mL of DI water, then with 80 mL of acetic acid (10% v/v), and finally with 2 L of boiled water. The filter cake (α-cellulose) was dried to a constant weight at 105 °C. α-Cellulose is the increase in the weight of filter paper. Lignin was measured using the TAPPI standard method. 15 g of 72.5% sulfuric acid (cooled to 15 °C) was slowly added to 2 g of the extractive-free sample. To avoid overheating, sulfuric acid was added to the solution in an ice bath. For 5 min, the solution was stirred with a stirring rod. Then, the solution was stirred every 2 h. Following that, the mixture was gradually transferred to a beaker containing 400 mL of DI water. The solution was allowed to settle and precipitate lignin for 24 h. Filtered lignin was dried at 105 °C until it reached a constant weight. The original weight of the sample was used to calculate the percentage yield. Equation 6 was used to calculate the yield of final cellulose nanocrystals. 6
Materials Date palm stem waste
(Lulu palm tree) was obtained from the UAE University’s Al-Foah experimental farm. The woody biomass was first ground with a shredder and then using a mechanical grinder to a mesh size of 160 μm. Sigma-Aldrich provided sodium chlorite, sodium hydroxide (bioXtra 98%), acetic acid glacial (100%), sulfuric acid (95–97%), and dialysis tubing (14 000 Da).
Supplementary Material ao2c02333_si_001.pdf
📊 Figures
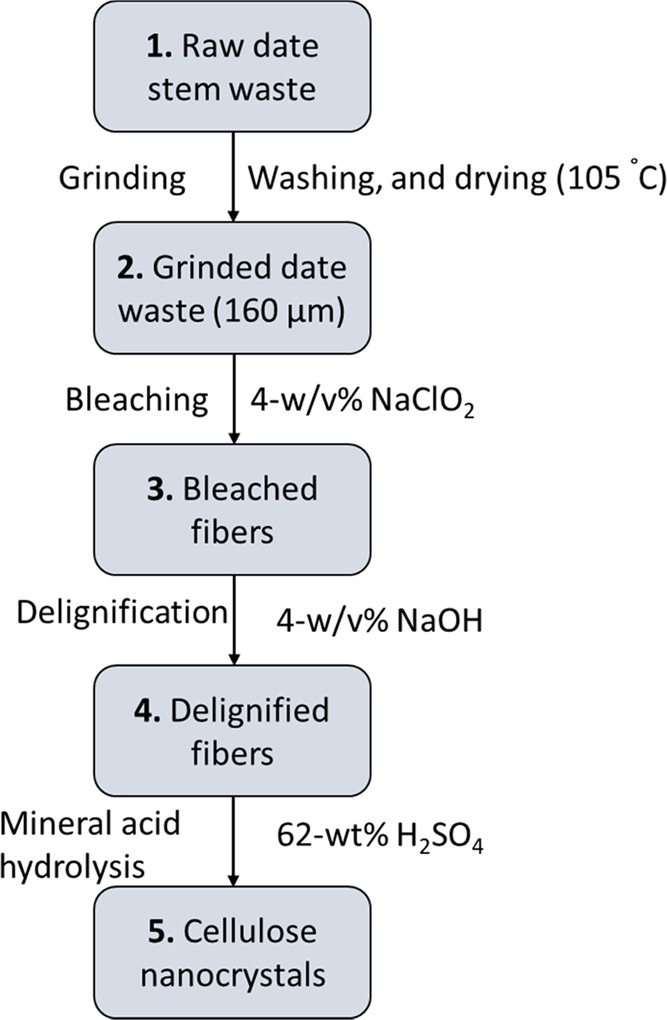
Figure 1
Isolation process of cellulose nanocrystals.
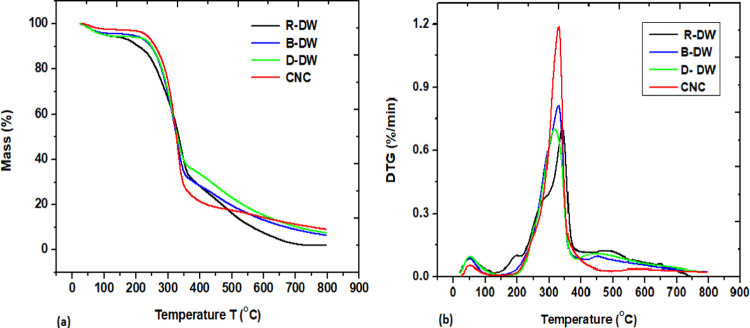
Figure 2
(a) Thermogravimetric analysis (TGA) curves and (b) derivativenTGA curves for R-DW, B-DW, D-DW, and CNC.
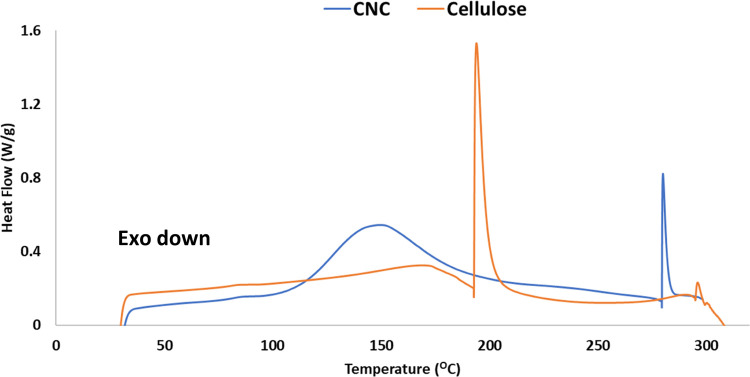
Figure 3
Differential scanningncalorimetry curve of CNC.
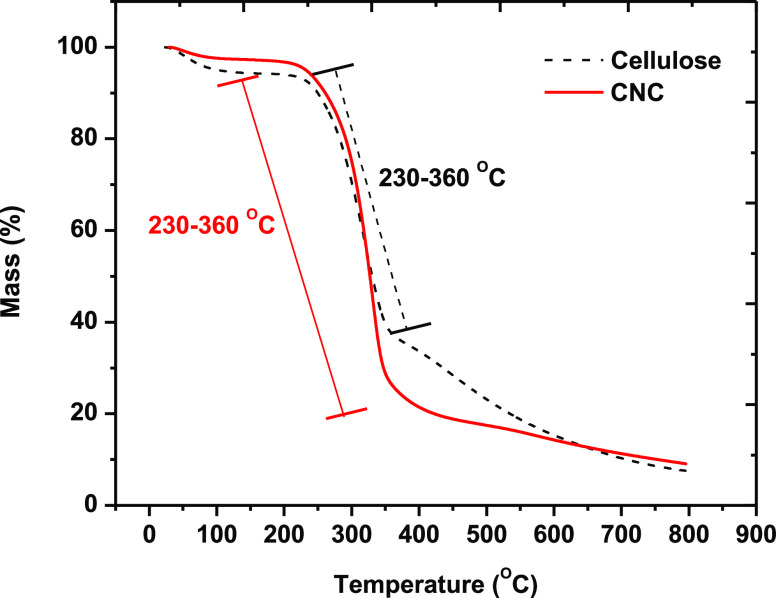
Figure 4
TGA curves of D-DW and CNC.
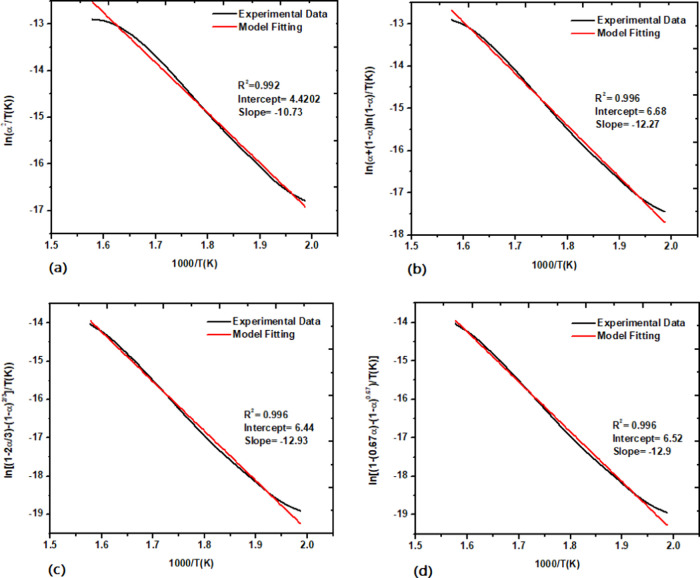
Figure 5
Best-fitted diffusion models ((a) DM1, (b) DM4, (c) DM5, and (d)nDM8) (cellulose).
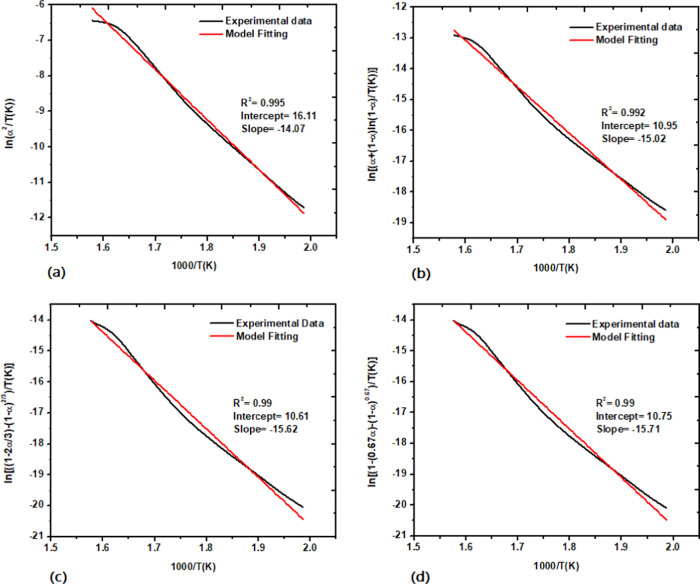
Figure 6
Best-fitted diffusionnmodels ((a) DM1, (b) DM4, (c) DM5, and (d)nDM8) (CNC).
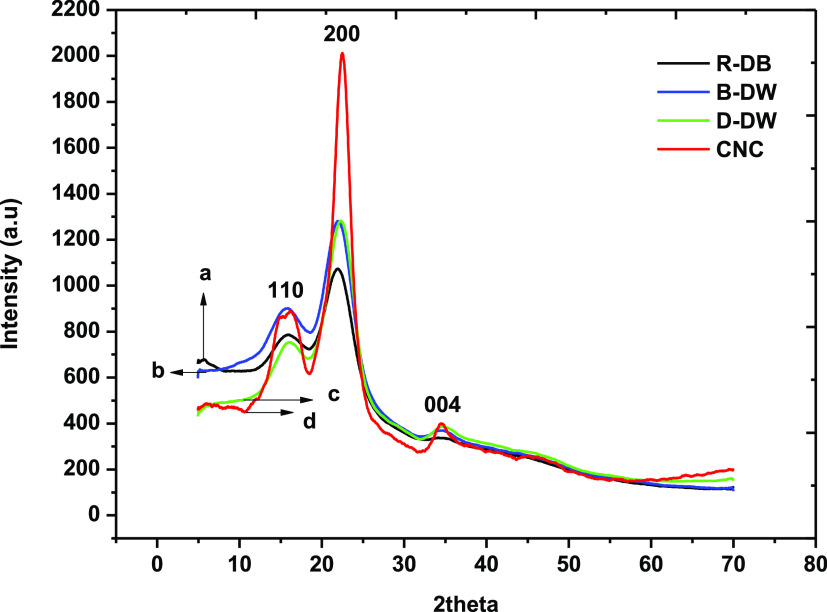
Figure 7
X-rayndiffractions of (a) R-DW, (b) B-DW, (c) D-DW, and (d) CNC.
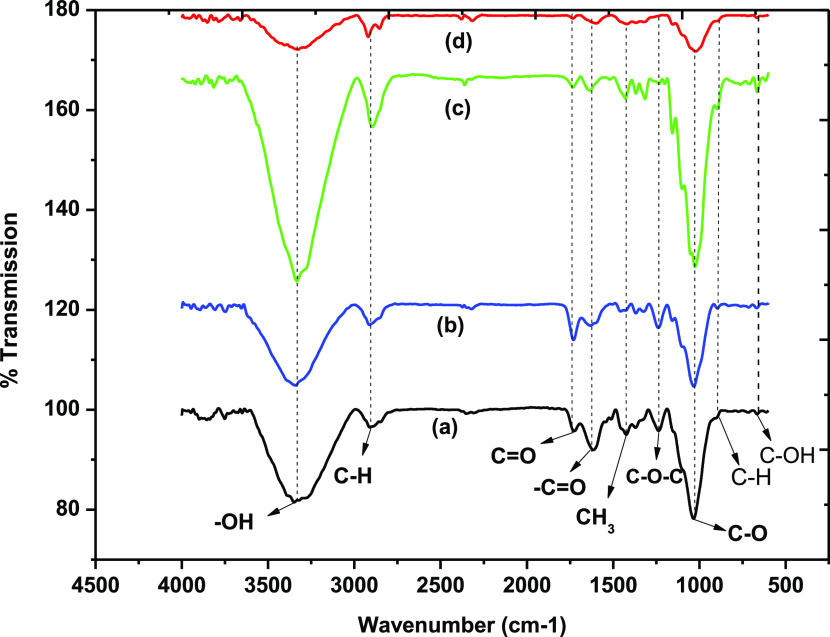
Figure 8
Fourierntransform infrared spectroscopy of (a) R-DW, (b) B-DW,n(c) D-DW, and (d) CNC.
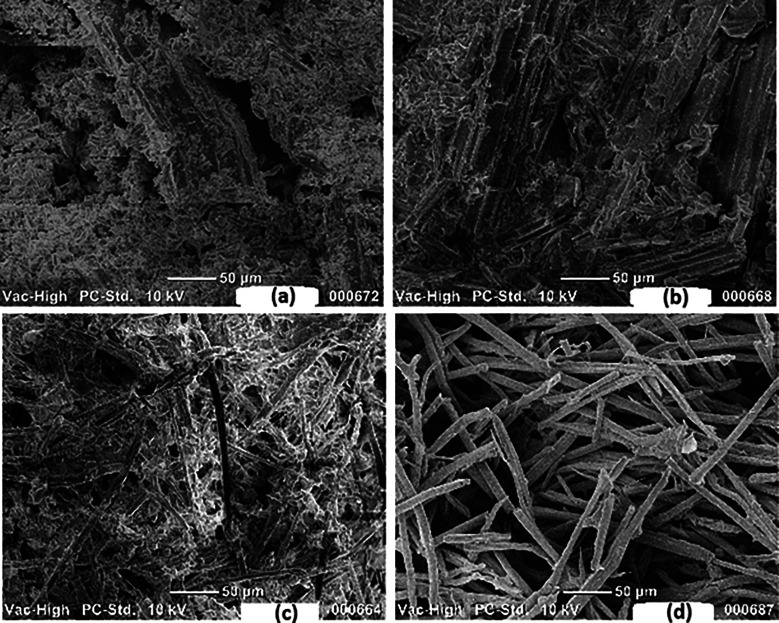
Figure 9
Scanning electron microscopic images ofn(a) R-DW, (b) B-DW, (c)nD-DW, and (d) CNC.
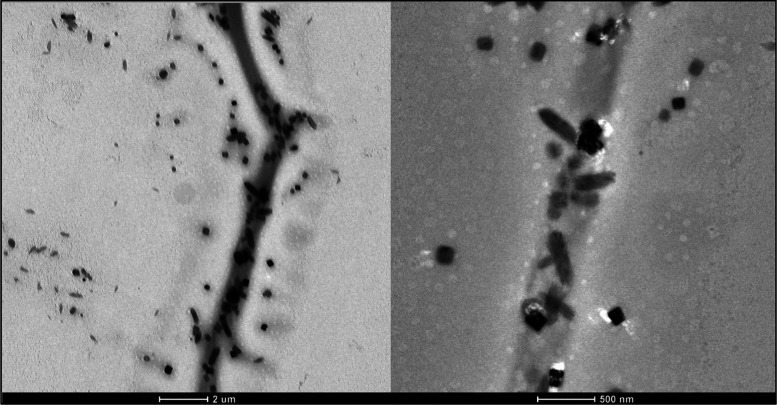
Figure 10
Transmission electronnmicroscopic images of CNC.
Figure images are served from the NIH/NLM PubMed Central Open Access Subset or Europe PMC; copyright remains with the publishers and authors.
💬 Discussion
0 commentsNo comments yet. Be the first to start a discussion!
Leave a Comment