Abstract
Abstract Organoids provide an accessible in vitro system to mimic the dynamics of tissue regeneration and development. However, long-term live-imaging of organoids remains challenging. Here we present an experimental and image-processing framework capable of turning long-term light-sheet imaging of intestinal organoids into digital organoids. The framework combines specific imaging optimization combined with data processing via deep learning techniques to segment single organoids, their lumen, cells and nuclei in 3D over long periods of time. By linking lineage trees with corresponding 3D segmentation meshes for each organoid, the extracted information is visualized using a web-based “Digital Organoid Viewer” tool allowing combined understanding of the multivariate and multiscale data. We also show backtracking of cells of interest, providing detailed information about their history within entire organoid contexts. Furthermore, we show cytokinesis failure of regenerative cells and that these cells never reside in the intestinal crypt, hinting at a tissue scale control on cellular fidelity.
🔬 Techniques
🔭 Microscopes
💻 Software
✨ Fluorophores
🧪 Sample Preparation
🏭 Microscope Brands
🧪 Reagent Suppliers
📷 Detectors
💻 Software Details
💻 Code & Software
LSTree is a digital organoid and lineage tree extraction workflow for light sheet movies.
Luigi is a Python module that helps you build complex pipelines of batch jobs. It handles dependency resolution, workflow management,...
TensorFlow Deconvolution for Microscopy Data
Mastodon u2013 a large-scale tracking and track-editing framework for large, multi-view images.
💾 Data Repositories
🏛️ Research Organizations (ROR)
Affiliated research institutions:
📋 Methods
Ethics statement
All animal based studies have been approved by Basel Cantonal Veterinary Authorities and conducted in accordance with the Guide for Care and Use of Laboratory Animals.
Organoid lines
Male and female outbred mice between 8 and 12 weeks old were used for all experiments. Regarding husbandry, all mice have a 12/12 h day/night cycle. Medium temperature is kept at 22 °C and relative humidity at 50%. Mouse lines used for time-course experiments: C57BL/6 wild type (Charles River Laboratories), one 12 weeks old male and one 8 weeks female mice. For all light-sheet movies, we used H2B-mCherry C57BL/6 × C3H F1 female intestines heterozygous for H2B-mCherry (received already as intestines, kind gift from T. Hiragi lab, EMBL). For H2B-mCherry/mem9-GFP organoids, H2B-mCherry organoids were infected with LV.EF1.AcGFP1-Mem-9 lentivirus particle (Clontech, Takara Bio USA). For the H2B-miRFP670 line, B6/N x R26 Fucci2 (Tg/+) intestines (kind gift from J. Skotheim lab, Stanford) were infected with pGK Dest H2B-miRFP670 (Addgene). For Lats DKO, Lats1∆/∆; Lats2∆/∆ (LATS DKO, intestines as kind gift from Jeff Wrana, Department of Molecular Genetics, University of Toronto, Canada) 36 time-course of published data 6 was analyzed.
Organoid culture
For initial organoid culture a section of the initial part of the small intestine was opened lengthwise and cleaned with cold PBS. Then, after removal of villi by scraping with a cold glass slide, the section was sliced into small fragments of roughly 2 mm in length. All fragments were then incubated in 2.5 mM EDTA/PBS at 4 °C for 30 min with shaking. Supernatant was removed and pieces of intestine were re-suspended in DMEM/F12 with 0.1% BSA. The tissue was then shaken vigorously. To collect the first fraction, the suspension was passed through a 70 μm strainer. The remaining tissue pieces were collected from the strainer and fresh DMEM/F12 with 0.1% BSA was added, followed by vigorous shaking. The crypt fraction was again collected by passing through a 70 μm strainer. In total, four fractions were collected. Each fraction was centrifuged at 300 g for 5 min at 4 °C. Supernatant was removed and the pellet was re-suspended into Matrigel with medium (1:1 ratio) and plated into 24-well plates. Organoids were kept in IntestiCult Organoid Growth Medium (STEM CELL Technologies) with 100 μg/ml Penicillin-Streptomycin for further amplification and maintenance. Organoid preparation for time-course experiments WT organoids passage 10 were collected 5–7 days after passaging and digested with TrypLE (Thermo Fisher Scientific) for 20 min at 37 °C. The resulting dissociated cells were filtered through a 30 µm cell strainer (Sysmex) and single alive cells were sorted by FACS (Becton Dickinson Influx cell sorter with BD FACS Sortware 1.2.0.142, or Becton Dickinson FACSAria III using BD FACSDiva Software Version 8.0.1). Forward scatter and side scatter properties were used to remove cell doublets and dead cells. The collected cells were re-suspended in ENR medium (advanced DMEM/F-12 with 15 mM HEPES (STEM CELL Technologies) supplemented with 100 μg/ml Penicillin-Streptomycin, 1×Glutamax (Thermo Fisher Scientific), 1×B27 (Thermo Fisher Scientific), 1×N2 (Thermo Fisher Scientific), 1mM N-acetylcysteine (Sigma), 500 ng/ml R-Spondin (kind gift from Novartis), 100 ng/ml Noggin (PeproTech) and 100 ng/ml murine EGF (R&D Systems) and mixed 1:1 with Matrigel (Corning). Cells were seeded at a density of 3000 cells per 5 ul drops per well of 96 well imaging plates (Greiner, 655090)(2 plates and 3 wells per condition). After 20 min of solidification at 37 °C, 100 µl of medium was overlaid. From day 0 to day 1, ENR was supplemented with 20% Wnt3a-conditioned medium (Wnt3a-CM), 10 μM Y-27632 (ROCK inhibitor, STEM CELL Technologies) and 3 µM of CHIR99021 (GSK3B inhibitor, STEM CELL Technologies, cat # 72054). From day 1 to 3 ENR was supplemented with 20% Wnt3a-CM and 10 μM Y-27632.
Show full methods section
Ethics statement
All animal based studies have been approved by Basel Cantonal Veterinary Authorities and conducted in accordance with the Guide for Care and Use of Laboratory Animals.
Organoid lines
Male and female outbred mice between 8 and 12 weeks old were used for all experiments. Regarding husbandry, all mice have a 12/12 h day/night cycle. Medium temperature is kept at 22 °C and relative humidity at 50%. Mouse lines used for time-course experiments: C57BL/6 wild type (Charles River Laboratories), one 12 weeks old male and one 8 weeks female mice. For all light-sheet movies, we used H2B-mCherry C57BL/6 × C3H F1 female intestines heterozygous for H2B-mCherry (received already as intestines, kind gift from T. Hiragi lab, EMBL). For H2B-mCherry/mem9-GFP organoids, H2B-mCherry organoids were infected with LV.EF1.AcGFP1-Mem-9 lentivirus particle (Clontech, Takara Bio USA). For the H2B-miRFP670 line, B6/N x R26 Fucci2 (Tg/+) intestines (kind gift from J. Skotheim lab, Stanford) were infected with pGK Dest H2B-miRFP670 (Addgene). For Lats DKO, Lats1∆/∆; Lats2∆/∆ (LATS DKO, intestines as kind gift from Jeff Wrana, Department of Molecular Genetics, University of Toronto, Canada) 36 time-course of published data 6 was analyzed.
Organoid culture
For initial organoid culture a section of the initial part of the small intestine was opened lengthwise and cleaned with cold PBS. Then, after removal of villi by scraping with a cold glass slide, the section was sliced into small fragments of roughly 2 mm in length. All fragments were then incubated in 2.5 mM EDTA/PBS at 4 °C for 30 min with shaking. Supernatant was removed and pieces of intestine were re-suspended in DMEM/F12 with 0.1% BSA. The tissue was then shaken vigorously. To collect the first fraction, the suspension was passed through a 70 μm strainer. The remaining tissue pieces were collected from the strainer and fresh DMEM/F12 with 0.1% BSA was added, followed by vigorous shaking. The crypt fraction was again collected by passing through a 70 μm strainer. In total, four fractions were collected. Each fraction was centrifuged at 300 g for 5 min at 4 °C. Supernatant was removed and the pellet was re-suspended into Matrigel with medium (1:1 ratio) and plated into 24-well plates. Organoids were kept in IntestiCult Organoid Growth Medium (STEM CELL Technologies) with 100 μg/ml Penicillin-Streptomycin for further amplification and maintenance. Organoid preparation for time-course experiments WT organoids passage 10 were collected 5–7 days after passaging and digested with TrypLE (Thermo Fisher Scientific) for 20 min at 37 °C. The resulting dissociated cells were filtered through a 30 µm cell strainer (Sysmex) and single alive cells were sorted by FACS (Becton Dickinson Influx cell sorter with BD FACS Sortware 1.2.0.142, or Becton Dickinson FACSAria III using BD FACSDiva Software Version 8.0.1). Forward scatter and side scatter properties were used to remove cell doublets and dead cells. The collected cells were re-suspended in ENR medium (advanced DMEM/F-12 with 15 mM HEPES (STEM CELL Technologies) supplemented with 100 μg/ml Penicillin-Streptomycin, 1×Glutamax (Thermo Fisher Scientific), 1×B27 (Thermo Fisher Scientific), 1×N2 (Thermo Fisher Scientific), 1mM N-acetylcysteine (Sigma), 500 ng/ml R-Spondin (kind gift from Novartis), 100 ng/ml Noggin (PeproTech) and 100 ng/ml murine EGF (R&D Systems) and mixed 1:1 with Matrigel (Corning). Cells were seeded at a density of 3000 cells per 5 ul drops per well of 96 well imaging plates (Greiner, 655090)(2 plates and 3 wells per condition). After 20 min of solidification at 37 °C, 100 µl of medium was overlaid. From day 0 to day 1, ENR was supplemented with 20% Wnt3a-conditioned medium (Wnt3a-CM), 10 μM Y-27632 (ROCK inhibitor, STEM CELL Technologies) and 3 µM of CHIR99021 (GSK3B inhibitor, STEM CELL Technologies, cat # 72054). From day 1 to 3 ENR was supplemented with 20% Wnt3a-CM and 10 μM Y-27632.
Fixed sample preparation and time-course imaging
Organoids are embedded in a Matrigel droplet. Due to the nature of the droplet, individual organoids are located at different heights in the Matrigel drop. To allow imaging of all organoids within a similar z-range, each 96-well plate was centrifuged at 847 g for 10 min in a pre-cooled centrifuge at 10 °C prior to fixation. Organoids were fixed in 4% PFA (Electron Microscopy Sciences) in PBS for 45 min at room temperature. For time course and compound experiments, organoids were permeabilized with 0.5% Triton X-100 (Sigma-Aldrich) for 1 h and blocked with 3% Donkey Serum (Sigma-Aldrich) in PBS with 0.1% Triton X-100 for 1 h.
WT imaging
For the images in Fig. 5e , membrane staining with E-Cadherin (BD Biosciences, # 610182) was done at 1:300 ratio in Blocking buffer for 20 h at 4 °C. DAPI staining was performed at concentration of 300 nM for 30 min at room temperature. All secondary antibodies were added at 1:300 for 1 h in room temperature. Cell nuclei were stained with 20 μg/ml DAPI (4′,6-Diamidino-2- Phenylindole, Invitrogen) in PBS for 15 min. High-throughput imaging was done with an automated spinning disk microscope from Yokogawa (CellVoyager 7000 S), with an enhanced CSU-W1 spinning disk (Microlens-enhanced dual Nipkow disk confocal scanner), a 40× (NA = 0.95) Olympus objective, and a Neo sCMOS camera (Andor, 2560 × 2160 pixels). For imaging, an intelligent imaging approach was used in the Yokogawa CV7000 (Search First module of Wako software). For each well, one field was acquired with 2× resolution in order to cover the complete well. This overview fields were then used to segment individual organoids on the fly with a custom written ImageJ macro which outputs coordinates of individual organoid positions. These coordinated were then subsequently imaged with high resolution (40×, NA = 0.95). For each site, z-planes spanning a range up to 140 μm were acquired. For the data in Fig. 5e, h and in Supplementary Fig. 9 2 μm z-steps were used. Lats-DKO Analyzed data stems from a previous publication 6 , with Lats DKO organoids dissociated into single cells and plated into 96 well plates, fixed and stained with DAPI following the published protocols. Tamoxifen induction (1:1000) was kept in the medium until fixation time. RXRi RXR inhibition was achieved by adding the Cpd2170 RXR antagonist 7 compound at 1:2000 ratio to the medium from the moment single cells were seeded onto the light-sheet holder. The compound was kept throughout the data acquisition. Organoids used for this experiment had been infected with H2B-iRFP670 for live nuclei labeling. Inhibition experiments: Lats1/2 and Limk1 inhibition time-course For the evaluation of bi-nucleated cells in Fig. 5h, i and Supplementary Fig. 9 , FACS sorted (Becton Dickinson Influx cell sorter with BD FACS Sortware 1.2.0.142, or Becton Dickinson FACSAria III using BD FACSDiva Software Version 8.0.1). WT mouse intestinal organoids at passage 10 were dissociated and grown from single cells as described above. Inhibitors were re-suspended in DMSO and serially diluted in medium to their final working concentration and added on day 0 (Lats1/2 inhibitor Truli 37 (CSNpharm, # CSN26140 ) or the Limk1 inhibitor Damnacanthal 38 (Tocris, # 1936)). One plate was fixed with 4% PFA on day 2 (48 h after plating) and the other one on day 3 (72 h after plating) as described in the previous section. At the end of the time course all plates were permeabilized with 0.5% Triton X-100 (Sigma-Aldrich) for 1 h and blocked with 3% Donkey Serum (Sigma-Aldrich) in PBS with 0.1% Triton X-100 for 1 h. Primary antibodies were diluted in blocking as follow: anti- e-Cadherin (BD Biosciences, # 610182) 1:400, anti-Limk1 (Abcam, # ab194798) 1:400 and anti-Yap1 (Cell Signaling, # 14074) 1:400 and incubated for 1 h at RT on a shaking plate. The primary antibodies were washed with PBS 3x10min at RT on a shaking plate. Both secondary antibodies (Alexa Fluor 568 donkey anti mouse, Thermo Fisher Scientific; A10042 and Alexa Fluor 488 donkey anti rabbit, Thermo Fisher Scientific; A-21202) were diluted 1:400 and incubated for 2 h at RT on a shaking plate. The plates were then washed with PBS 3×10 min at RT on a shaking plate and cell nuclei were stained with 20 μg/ml DAPI (4’,6-Diamidino-2-Phenylindole, Invitrogen) in PBS for 15 min. Plates were then covered in aluminum foil and imaged with the ImageXpress from MolecularDevices. Stacks were acquired with 20X objective (0.3417 μm in X and Y) and 3 μm steps. For analysis, 200 randomly picked organoids were selected for each condition and the number of bi-nucleated cells present on each one evaluated.
Light-sheet sample preparation
H2b-mCherry/mem9-GFP and H2B-iRFP670 organoids were collected and digested with TrypLE (Thermo Fisher Scientific) for 20 min at 37 °C. Alive double positive (mCherry/GFP) cells were sorted by FACS (Becton Dickinson Influx cell sorter with BD FACS Sortware 1.2.0.142, or Becton Dickinson FACSAria III using BD FACSDiva Software Version 8.0.1). and collected in medium containing advanced DMEM/F-12 with 15 mM HEPES (STEM CELL Technologies) supplemented with 100 μg/ml Penicillin-Streptomycin, 1×Glutamax (Thermo Fisher Scientific), 1×B27 (Thermo Fisher Scientific), 1×N2 (Thermo Fisher Scientific), 1 mM N-acetylcysteine (Sigma), 500 ng/ml R-Spondin (kind gift from Novartis), 100 ng/ml Noggin (PeproTech) and 100 ng/ml murine EGF (R&D Systems). 2500 cells were then embedded in 5 ul drop of Matrigel/medium in 60/40 ratio. Drops were placed in the imaging chamber and incubated for 20 min before being covered with 1 ml of medium. For the first 3 days, medium was supplemented with 20% Wnt3a-CM and 10 μM Y-27632 (ROCK inhibitor, STEM CELL Technologies). For the first day, in addition, 3 μM of CHIR99021 (STEM CELL Technologies) were supplemented. After 2 h incubation in a cell culture incubator the imaging chamber was transferred to the microscope kept at 37 °C and 5% CO2.
Light-sheet imaging
For all light-sheet experiments a LS1-Live dual illumination and inverted detection microscope from Viventis Microscopy Sàrl was used. Different single cells were selected as starting positions and imaged every 10 min for up to 5 days. A volume of 150–200 μm was acquired with a Z spacing of 2 μm between slices and 100 ms exposure time for each slice. Laser intensity was kept to a minimum necessary to still obtain reasonable signal-to-noise from the raw data, while keeping phototoxicity to a minimum possible. Medium was exchanged manually under the microscopy every day.
Fixation on time-lapse recordings
Organoids are embedded in 5 μm Matrigel droplets which are deposited at equal distances on top of the FEP foil of the light-sheet sample holder. After live imaging is done, the medium is replaced by 4% PFA in PBS, and left in the chamber for maximum 30 min at 37 °C in the microscope. After fixation the organoids were permeabilized with 0.5% Triton X-100 (Sigma-Aldrich) for 1 h and blocked with 3% Donkey Serum (Sigma-Aldrich) in PBS with 0.1% Triton X-100 for 1 h. For the images in Fig. 4 , the cyst was stained with DLL1 antibody (R&D Systems, # AF3970) at 1:100 ratio and left overnight at 4 °C. For Lysozyme (Dako, # A0099) we used a 1:400 ratio for 3 h at room temperature. Registration for back-tracking after fixation of time-lapses Since PFA fixation causes the Matrigel droplet to flatten, we perform imaging while fixation is taking place. Typically we observe no change within the first 5 min, whereas after that there is a sudden increase in organoid movement toward the bottom of the sample holder. To take this into account, we increased the imaging volume and step size to be able to encompass a larger volume and still track the organoid. For the data in Fig. 4 we increased stack size from 150 and 2 μm step size to 300 μm at 3 μm step size. However, larger values can also be used. Nonetheless, the flattening of the droplet will lead the organoids to rotate or translate in space. Furthermore, PFA fixation also changes the shape of tissue samples by shrinking or swelling. To bridge the translational, rotational and rescaling of the organoids during fixation procedures, we registered fixed organoids using Elastix v4.900 ( https://elastix.lumc.nl/ ). Since Elastix can be directly installed from the repository as pre-compiled libraries, we refrained from embedding the registration into LSTree, and left it as a stand-alone tool. For all registrations using the similarity transform, a base parameter file set for performing similarity transformations was used and eventually modified so that best results could be achieved. An example of the registration parameters is provided in ‘Elastix_parameter_Affine.txt’ file in the Supplementary Software .
Feature evaluation
Evaluation of the data present in Fig. 1f was performed by first calculating organoid and cell/nuclei features separately and finally merging them together into one Pandas dataframe for compound feature calculations (i.e., “nuclei density” and “mean cell/nuclei volume”). More detailed information can be found in Supplementary Table 1 . For Fig. 3e, f each feature was evaluated for all seven datasets using the latest release of LSTree (commit number 6039429) and a comparison was made between dataset 002 against all datasets in order to see how each feature (nuclei volume and distance to lumen) progresses each generation. Source data can be found in the source data file . LSTree modules LSTree ( https://github.com/fmi-basel/LSTree ) is a luigi-based workflow ( https://github.com/spotify/luigi ) which encompasses jupyter notebooks for cropping and general utilities, as well as luigi lasks for denoising, deconvolution and multiscale segmentation and tree-prediction, along with feature extraction. Pre-processing steps rely mostly on cropping and registration, denoising, and deconvolution steps. Deconvolution was based on flowdec ( https://github.com/hammerlab/flowdec ). Although not part of LSTree itself, improvements in the microscope software (on-the-fly LZW compression, position dependent illumination alignment) were performed in collaboration with Viventis Microscopy Sàrl and are now part of their current microscope software. A lzw compression python code (‘parallel_image_compressor.py’) is available in the Supplementary Software . Detailed information regarding pre-processing, segmentation strategies and feature extraction can be found in Supplementary Text .
Software
For deconvolution of the images, PSFs were averaged using the PSF Distiller from Huygens compute engine 20.10.1p1. For visualization of images ImageJ v.1.53 h and Paraview 5.8.0 were used, and Elastix v4.900 was used for registration of organoids. IT requirements The LSTree analysis tasks have been trained and used on a workstation with following specifications: 16 core Intel Xeon W-2145, 64 GB 2666 MHz DDR4 RAM equipped with a Nvidia Quadro RTX 6000 GPU with 24 GB VRAM and using Ubuntu 18.04.6 LTS. All code runs with Nvidia cudatoolkit 10.1, and cuDNN 7. Minimally, one would need 16 GB of RAM and a Tensorflow compatible GPU with at least 8 GB of VRAM. Since many of the steps of the pipeline run in parallel, a higher number of CPUs is also desirable. A step-by-step guide on installation and on how to run the example data provided can be found in the repository ( www.github.com/fmi-basel/LSTree ).
Statistics & reproducibility
For all experiments no statistical method was used to predetermine sample size. Sample size was determined based on previous related studies in the field 11 , 16 , 39 . For long-term live imaging experiments, we assumed that the amount of timepoints comprised in the seven different datasets would be sufficient to test the framework. In addition, 12 other datasets from previous publication 39 were used for further challenging the analysis framework). No data were excluded from the analyses. Samples were randomly assigned. Investigators were not blinded to allocation during experiments and outcome assessment. Reporting summary Further information on research design is available in the Nature Research Reporting Summary linked to this article.
Supplementary information Supplementary Information Reporting Summary Peer Review File Description of Additional Supplementary Files Supplementary Movie 1 Supplementary Movie 2 Supplementary Movie 3 Supplementary Movie 4 Supplementary Software
📊 Figures

Fig. 1
Acquisition of high-resolution 3D organoid images.
a Multiscale light-sheet imaging framework, depicting imaging stages, analysis workflow and visualization tool. b Dual illumination inverted detection light-sheet objective configuration used in all o...
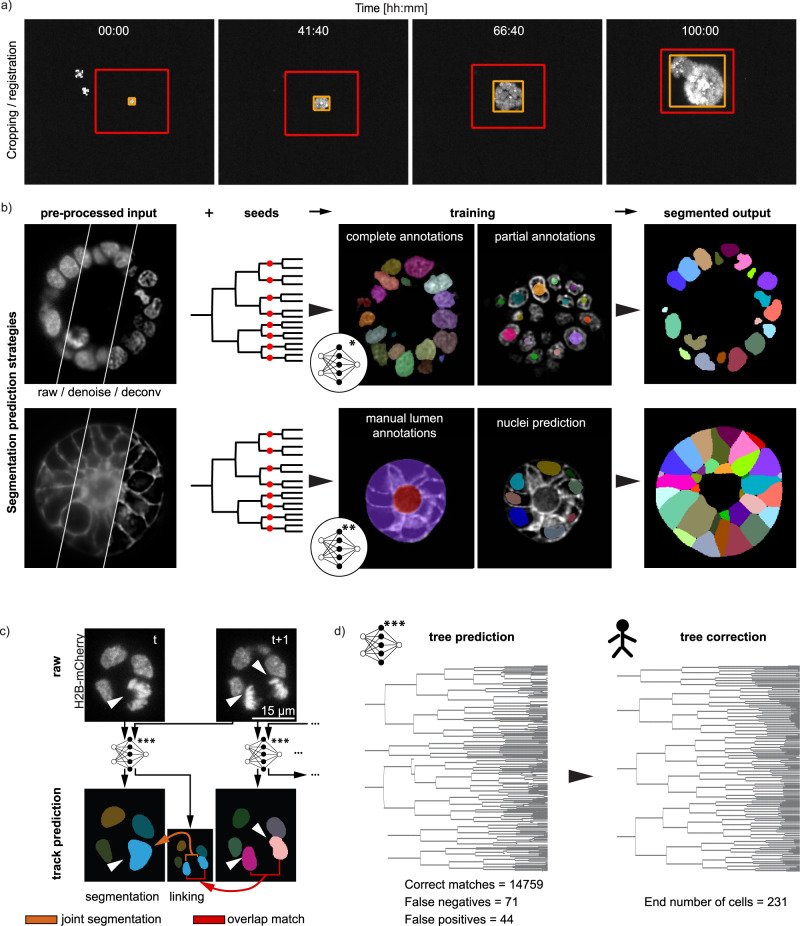
Fig. 2
Cropping, segmentation and tree-prediction strategies underlying LSTree.
a Cropping of datasets is done in a semi-automatic way: selected object of interest is fitted with an orange (best fit for each particular timepoint) and a global red bounding boxes, which can be corr...

Fig. 3
Digital Organoid Viewer.
a Digital organoid viewer is a web-based tool that shows both lineage trees (left) and respective segmented nuclei and cell meshes (right) simultaneously. Color coding of of each data representation c...
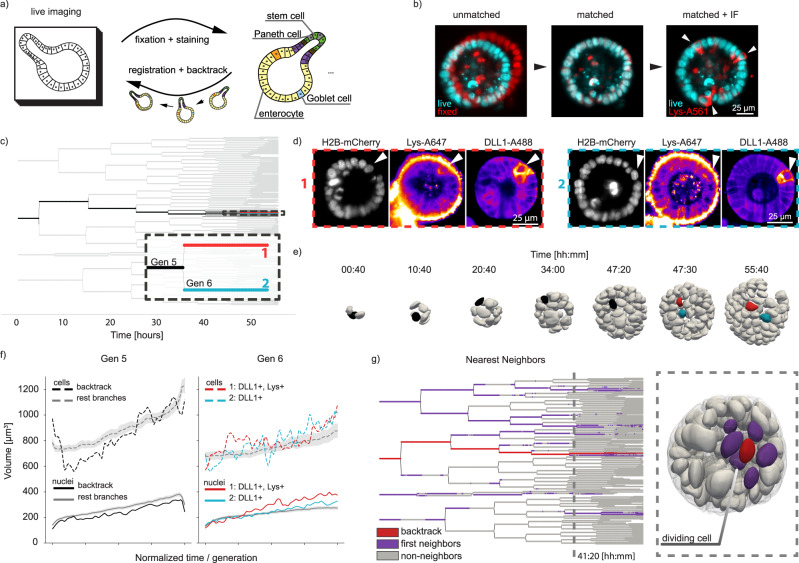
Fig. 4
Fixation and backtracking after live-imaging.
a Fixation and backtracking strategy for light-sheet imaging of organoid growth (shown recording 007). b After fixation a registration step may be needed to overlap the fixed nuclei with the nuclei as...
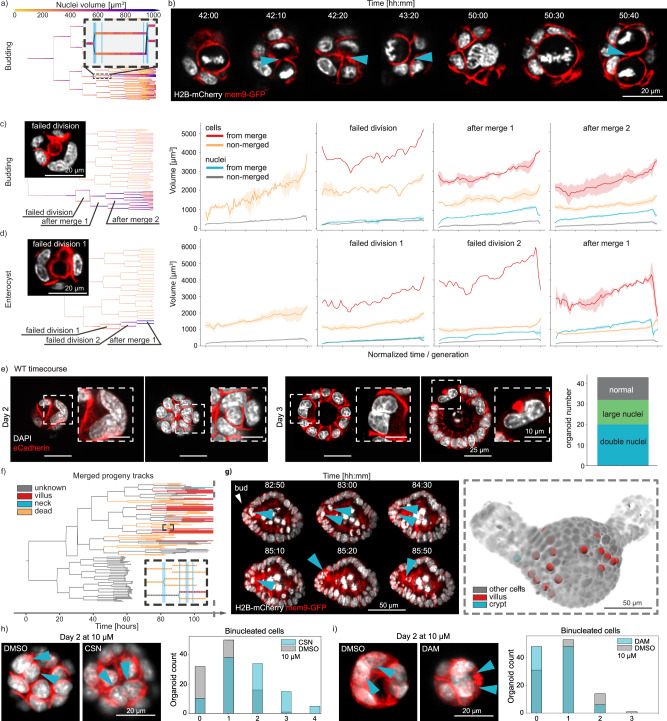
Fig. 5
Merging events during early organoid growth.
a Example lineage tree with highlighted insert depicting a cell division where two nuclei divide again into two nuclei (recording 002). b Still images of the light-sheet recording related to the datas...
Figure images are served from the NIH/NLM PubMed Central Open Access Subset or Europe PMC; copyright remains with the publishers and authors.
💬 Discussion
0 commentsNo comments yet. Be the first to start a discussion!
Leave a Comment