Abstract
Activation of discoidin domain receptor (DDR) 1 by collagen is reported to regulate cell migration and survival processes. While the oligomeric state of DDR1 is reported to play a significant role in collagen binding, not much is known about the effect of collagen binding on DDR1 oligomerization and cellular distribution. Using fluorescence resonance energy transfer (FRET) microscopy, we monitored the interaction between DDR1 tagged with cyan fluorescent protein and DDR1 tagged with yellow fluorescent protein in live cells. Significant FRET signal indicative of receptor dimerization was found even in the absence of collagen stimulation. Collagen stimulation induced aggregation of DDR1, followed by a sharp increase in FRET signal, localized in the regions of aggregated receptor. Further analysis of DDR1 aggregation revealed that DDR1 undergoes cytoplasmic internalization and incorporation into the early endosome. We found the kinetics of DDR1 internalization to be fast, with a significant percentage of the receptor population being internalized in the first few minutes of collagen stimulation. Our results indicate that collagen stimulation induces the aggregation and internalization of DDR1 dimers at timescales much before receptor activation. These findings provide new insights into the cellular redistribution of DDR1 following its interaction with collagen type I.
🔬 Techniques
🔭 Microscopes
✨ Fluorophores
🧪 Sample Preparation
🔬 Cell Lines
🏭 Microscope Brands
🧪 Reagent Suppliers
💻 Software Details
🏛️ Research Organizations (ROR)
Affiliated research institutions:
📋 Methods
Reagents
Anti-DDR1 antibody sc-532, anti-glyceraldehyde 3-phosphate dehydrogenase (GAPDH) antibody, and anti-mouse and anti-rabbit IgG horseradish-peroxidase-conjugated antibodies were obtained from Santa Cruz Biotech (Santa Cruz, CA). Anti-rabbit IgG antibodies conjugated with Alexa Fluor 488 and protein-A-coated agarose beads were obtained from Invitrogen (Carlsbad, CA). Bovine dermal collagen type I was obtained from Invitrogen. Glass-bottom culture dishes for live cell microscopy were obtained from MatTek Glassware (Ashland, MA). NheI, Eco47III, and EcoRI restriction enzymes were obtained from New England Biolabs (Ipswich, MA). PfuTurbo polymerase and CIAP were obtained from Stratagene (La Jolla, CA).
DNA constructs
A plasmid containing the entire mouse DDR1a sequence was obtained from Regeneron Pharmaceuticals (Tarrytown, NY). To generate the DDR1–CFP construct, we used the cerulean variant of the pECFP-C1 vector, which was a generous gift by Dr. Dave Piston (Vanderbilt University, Nashville, TN). 36 This plasmid was linearized by restriction digestion with Eco47III and phosphatased using standard procedures. The DDR1 coding region was amplified by polymerase chain reaction (PCR) utilizing the following primers: 5′ primer, 5′-phos- ACCATGGGGACAGGGACCCTC ; 3′ primer, 5′-phos- CACCGTGTTGAGCGCATCATCC . The resulting PCR product blunt-end-ligated immediately upstream of the CFP open reading frame. To generate the DDR1–YFP construct, we used the pEYFP-N1 vector from Clontech (Carlsbad, CA). The DDR1 coding region was amplified by PCR using primers that introduced a NheI restriction site at the 5′ end (5′- AGAGGGTTCCGCTAGCGCCACCATGGGGACAGGGACCCTCTCATC ) and an EcoRI restriction site at the 3′ end (5′- GTCGACTGCAGAATTCGCACCGTGTTGAGCGCATCATCCG ). The PCR products were double-digested with NheI and EcoRI, and directionally ligated into the NheI and EcoRI restriction sites of the pEYFP-N1 vector. The authenticity (i.e., at correct orientation and in-frame with either the CFP coding region or the YFP coding region) of the resulting clones was verified by dideoxynucleotide sequencing. The selected clones were amplified in DH5α-competent cells (Invitrogen). A pEGFP-C3 vector for the expression of N-terminus GFP-labeled Rab5a was a kind gift from Dr. Heidi McBride (University of Ottawa Heart Institute, Canada).
Show full methods section
Reagents
Anti-DDR1 antibody sc-532, anti-glyceraldehyde 3-phosphate dehydrogenase (GAPDH) antibody, and anti-mouse and anti-rabbit IgG horseradish-peroxidase-conjugated antibodies were obtained from Santa Cruz Biotech (Santa Cruz, CA). Anti-rabbit IgG antibodies conjugated with Alexa Fluor 488 and protein-A-coated agarose beads were obtained from Invitrogen (Carlsbad, CA). Bovine dermal collagen type I was obtained from Invitrogen. Glass-bottom culture dishes for live cell microscopy were obtained from MatTek Glassware (Ashland, MA). NheI, Eco47III, and EcoRI restriction enzymes were obtained from New England Biolabs (Ipswich, MA). PfuTurbo polymerase and CIAP were obtained from Stratagene (La Jolla, CA).
DNA constructs
A plasmid containing the entire mouse DDR1a sequence was obtained from Regeneron Pharmaceuticals (Tarrytown, NY). To generate the DDR1–CFP construct, we used the cerulean variant of the pECFP-C1 vector, which was a generous gift by Dr. Dave Piston (Vanderbilt University, Nashville, TN). 36 This plasmid was linearized by restriction digestion with Eco47III and phosphatased using standard procedures. The DDR1 coding region was amplified by polymerase chain reaction (PCR) utilizing the following primers: 5′ primer, 5′-phos- ACCATGGGGACAGGGACCCTC ; 3′ primer, 5′-phos- CACCGTGTTGAGCGCATCATCC . The resulting PCR product blunt-end-ligated immediately upstream of the CFP open reading frame. To generate the DDR1–YFP construct, we used the pEYFP-N1 vector from Clontech (Carlsbad, CA). The DDR1 coding region was amplified by PCR using primers that introduced a NheI restriction site at the 5′ end (5′- AGAGGGTTCCGCTAGCGCCACCATGGGGACAGGGACCCTCTCATC ) and an EcoRI restriction site at the 3′ end (5′- GTCGACTGCAGAATTCGCACCGTGTTGAGCGCATCATCCG ). The PCR products were double-digested with NheI and EcoRI, and directionally ligated into the NheI and EcoRI restriction sites of the pEYFP-N1 vector. The authenticity (i.e., at correct orientation and in-frame with either the CFP coding region or the YFP coding region) of the resulting clones was verified by dideoxynucleotide sequencing. The selected clones were amplified in DH5α-competent cells (Invitrogen). A pEGFP-C3 vector for the expression of N-terminus GFP-labeled Rab5a was a kind gift from Dr. Heidi McBride (University of Ottawa Heart Institute, Canada).
Cell sample preparations
Substrates used for cell culture For SDS-PAGE experiments, the cells were seeded on NuClon culture dishes; for wide-field or FRET microscopy experiments, cells were seeded on 20-mm glass-bottom culture dishes; and for confocal microscopy, cells were seeded on 25-mm glass coverslips. The different cell types (HEK293 and 3T3) were used based on their suitability for FRET, confocal microscopy, or SDS-PAGE analysis. The factors determining the cell-type selection were based on cell adherence to the substrate, level of protein expression after transient transfection, and cell morphology. DDR1 activation experiments HEK293 cells (ATCC, Manassas, VA) were grown in DMEM (Gibco-Invitrogen) supplemented with 10% fetal bovine serum and antibiotics. The cells were transiently transfected with DDR1–CFP or DDR1–YFP using Fugene transfection reagent. After 24 h of transfection, the cells were serum-starved overnight and stimulated with 10 μg/ml collagen type I for time intervals ranging from 5 min to 2 h. Following stimulation, the cells were lysed and subjected to SDS-PAGE. Alternatively, the cells were washed with phosphate-buffered saline (PBS) supplemented with Ca and Mg ions and imaged live. Identical nonstimulated control samples were also prepared. FRET microscopy experiments Mouse osteoblast 3T3 cells obtained from ATCC were cultured in modified minimal essential medium alpha (Gibco) supplemented with 10% fetal bovine serum and antibiotics. Samples were transfected with DDR1–YFP and/or DDR1–CFP and stimulated with collagen as described above. The cells were then washed in PBS and imaged live using FRET microscopy.
Confocal microscopy experiments
HEK293 cells seeded on glass coverslips were transiently transfected with DDR1–CFP, Rab5a-GFP, or both, and stimulated with collagen as described above. Following stimulation, the cells were washed three times with PBS and fixed with 2% paraformaldehyde for 30 min. Following fixation, the coverslips were mounted on microscope glass slides using Prolong mounting media (Invitrogen). A similar sample was prepared using HEK293 cells transfected with DDR1–YFP wherein, following fixation, the cells were also nuclear-stained with 4 μM bisbenzimide (Calbiochem).
SDS-PAGE and Western blot analysis
Following stimulation, HEK293 cells were lysed in 20 mM Tris–HCl (pH 7.8), 150 mM NaCl, 2 mM sodium orthovanadate, 1% NP-40, 1 mM phenylmethylsulfonyl fluoride, 10 μg/ml aprotinin, 10 μg/ml leupeptin, and 2 mM ethylene-diaminetetraacetic acid. The whole-cell lysate was analyzed using SDS-PAGE performed as described previously. 21 Briefly, samples containing 15 μg of protein sample were prepared in 1× NuPage LDS sample buffer (Invitrogen). Electrophoresis was performed using 4–12% (wt/vol) NuPAGE® Novex Bis-Tris Gels (Invitrogen). BenchMark Protein Ladder (Invitrogen) was used as marker. SDS-PAGE was followed by Western blot analysis using nitrocellulose membranes (Invitrogen). The membranes were probed with anti-DDR1 antibodies and imaged using enhanced chemiluminescence (Amersham Biosciences) after incubation with anti-rabbit Ig horseradish peroxidase antibodies. Alternatively, cells were lysed in 20 mM Tris–HCl (pH 7.5), 150 mM NaCl, 2 mM sodium orthovanadate, 1% Triton, 1 mM phenylmethylsulfonyl fluoride, 10 μg/ml aprotinin, 10 μg/ml leupeptin, and 2 mM ethylene-diaminetetraacetic acid. DDR1 was immunoprecipitated from the whole-cell lysate using anti-DDR1 antibodies and protein-A-coupled agarose beads. Following overnight incubation, immunoprecipitation reactions were washed three times in lysis buffer, and the protein was separated from the beads by boiling for 5 min in 1× sample buffer. The resulting samples were analyzed for phosphorylation using SDS-PAGE, followed by Western blot analysis and incubation with anti-phosphotyrosine antibodies.
Microscopy Colocalization studies between
Rab5a-GFP and DDR1–CFP were performed using a Zeiss LSM 510 confocal microscope. GFP was imaged using the 488 line of argon laser, and CFP was imaged using a tunable Ti-sapphire laser at 830 nm in two-photon mode. Images were acquired using a 63× objective, with an acquisition rate of 12 kHz and a pixel resolution of 1024×1024. To establish eventual bleedthrough between the GFP and the CFP channels, we imaged control samples containing cells expressing only DDR1–CFP or only Rab5a-GFP. Under these imaging conditions, no bleedthrough was detected between the CFP and the GFP channels. To study colocalization between DDR1 and Rab5a, images were acquired sequentially in the CFP and GFP channels at the same field of view and focal plane. Imaging of HEK293 cell samples transfected with DDR1–YFP was performed using the 514 line of argon laser; the nuclear stain was imaged with the tunable Ti-sapphire laser at 750 nm in two-photon mode. FRET experiments and internalization dynamics studies were performed in wide-field microscopy, using a Zeiss Axiovert 200 equipped with an Excite 120 light source (Excite, Mississauga, Canada) and a cooled charged-coupled device ORCA camera (Hamamatzu, Bridgewater, NJ). The FRET experiments were performed in an acceptor-sensitizing setup, 37 , 38 directly measuring the emission of the acceptor while exciting the donor. Imaging was performed in a three-filter cube setup, using a 63× water immersion objective. The optical filters were obtained from Semrock (Rochester, NY): I DD channel, donor excitation–donor emission (excitation, 438/24; emission, 475/25); I AA channel, acceptor excitation–acceptor emission (excitation, 500/24; emission, 542/27); and I DA channel, donor excitation–donor emission (excitation, 438/24; emission, 542/27). The internalization dynamics studies were performed using the YFP-labeled receptor, with imaging performed in the acceptor channel described above.
FRET analysis
The nomenclature used below was the one proposed by Zal and Gascoigne. 38 The following bleedthrough constants were measured on samples containing the acceptor only (A) or the donor only (D), indicated in parentheses near the channel index: (1) a = I DA ( A ) / I AA ( A ) b = I DD ( A ) / I AA ( A ) c = I AA ( D ) / I DD ( D ) d = I DA ( D ) / I DD ( D ) FRET imaging was performed on samples expressing the donor and the acceptor, and the corrected sensitized fluorescence F C was calculated according to the formula: (2) F C = I DA − a ( I AA − c I DD ) − d ( I DD − b I AA ) After image acquisition, bleedthrough parameters were derived using PixFRET, an ImageJ plug-in proposed by Feige et al. 39 This allowed for pixel-by-pixel analysis and determination of the above constants for a large range of intensity values. The minor bleedthrough constants c and b were found to be negligible in our setup and henceforth were ignored in our calculations. We found a =0.150 and d =0.400; these values were constant across the entire range of intensities found in our samples, except for the very low range, which exhibited large fluctuations in the values of the constants. Those regions were excluded from our analysis. Equation (2) thus becomes: (3) F C = I DA − a I AA − d I DD The corrected FRET signal was normalized against the acceptor’s fluorescence, with the resulting FRET index shown to linearly depend on both the transfer efficiency and the number of acceptor–donor pairs: 38 (4) F C A = ε D 1 ε A 1 a E FRET N ad A or F C A = α E FRET N ad A where A is the number of acceptor-labeled receptors; ε D1 and ε A1 are the extinction coefficients of the donor and the acceptor, respectively, at donor excitation wavelength; a is the bleedthrough constant defined above; N ad is the number of acceptor–donor pairs; and E FRET is the FRET transfer efficiency for the current structure of the donor-labeled and acceptor-labeled DDR1 dimer; ε D1 , ε A1 , and a are constants for our experimental setup and can be written as α = ε D 1 ε A 1 a . In our numerical analysis, A is given by the signal intensity in the I AA channel, and D is given by the signal intensity in the I DD channel. As for most receptors, we define that only a fraction x of the DDR1 receptor population ( A + D ) participates in dimer formation. Collagen stimulation could induce structural changes, increasing the fraction of receptors involved in dimer formation, or alternatively aggregate the dimeric receptor, thus increasing the fraction of dimer-forming receptors in localized regions. To account for this, x can therefore change from nonstimulated to stimulated samples. The number of DDR1 dimers N max —considering complete dimerization of the fraction x —can therefore be written as: (5) N max = x ( A + D ) 2 Considering that the acceptor-labeled and donor-labeled receptors are expressed with equal efficiency, and that their incorporation into the dimer formation is random, the fraction of individual dimer species is given by: 40 , 41 (6) F i = ( 2 i ) f a i f d ( 2 − i ) where i =0, 1, 2; f a is the acceptor fraction; and f d is the donor fraction. The number of acceptor–donor dimers ( i =1) is given by: (7) N ad = N max F 1 = x ( A + D ) 2 2 A D ( A + D ) 2 = x A D A + D or (8) N ad = x A 1 + r where r = A / D is the ratio between acceptor-labeled receptors and donor-labeled receptors. Furthermore, considering the effects of receptor density on DDR1 dimerization, we introduce an additional term to the right-hand side of Eq. (5) , and the number of DDR1 dimers becomes: (9) N = f ( A , D ) x ( A + D ) 2 where f ( A , D ) is a function describing the dependency of dimer formation on receptor density; replacing N max in Eq. (7) with N , the number of acceptor–donor dimers N ad becomes: (10) N ad = f ( A , D ) x A 1 + r Equation (4) can now be written as: (11) F C A = α ( E FRET x ) 1 1 + r f ( A , D ) Image analysis Quantitative evaluation of the microscopy data was performed using ImageJ. For the FRET experiments, measurements were performed on defined cellular ROI. The mean fluorescence intensity was derived with ImageJ, and subsequent numerical calculations and statistical analysis were performed with Microsoft Excel according to the equations presented above. Internalization kinetics To evaluate the percentage of internalized receptor in the internalization kinetics experiments, we defined two ranges of receptor intensities: R1 for the noninternalized receptor and R2 for the internalized receptor. These intervals were determined for each cell by thresholding the background-corrected image to an intensity value ( T ) that allowed delineating the aggregated receptor regions. R2 was defined as the intensity range ( T –Max), where Max was the maximum intensity value, and R1 was defined as the intensity range (Min– T ), where Min was the minimum intensity value. The integrated intensity encompassed by either of these ranges was measured and used to derive the percentage of internalized receptor.
Colocalization analysis
We have performed a quantitative analysis of colocalization using JACoP, an ImageJ plug-in that allowed for determination of the Pearson coefficient. 42 The linear equation describing the relationship between the intensities in the two images is calculated by linear regression. Pearson coefficient values can range from 1 to −1, with 1=complete positive correlation, 0=no correlation, and −1=negative correlation. For an object-based colocalization analysis, we considered ROIs along the longitudinal and transversal axes of individual DDR1–CFP aggregates. We extracted the intensity profiles along each axis in both GFP and CFP channels and plotted them on the same graph. Colocalization was estimated based on the overlap of the two intensity profiles.
📊 Figures
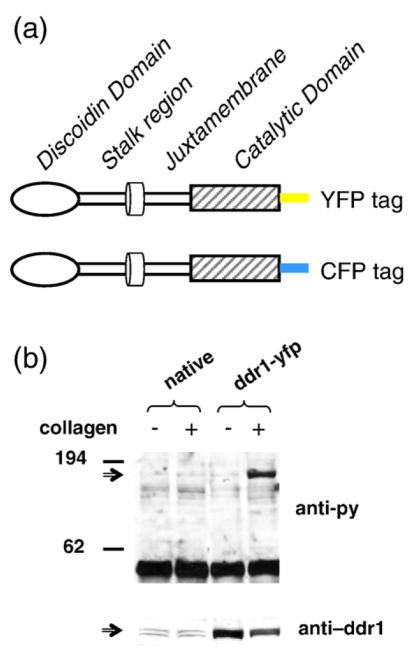
Fig. 1
The fluorescent DDR1 constructs are functional. (a) Schematic representation of the DDR1u2013YFP fusion proteins. (b) HEK293 cells, native or transiently transfected with DDR1u2013YFP, were stimulated...
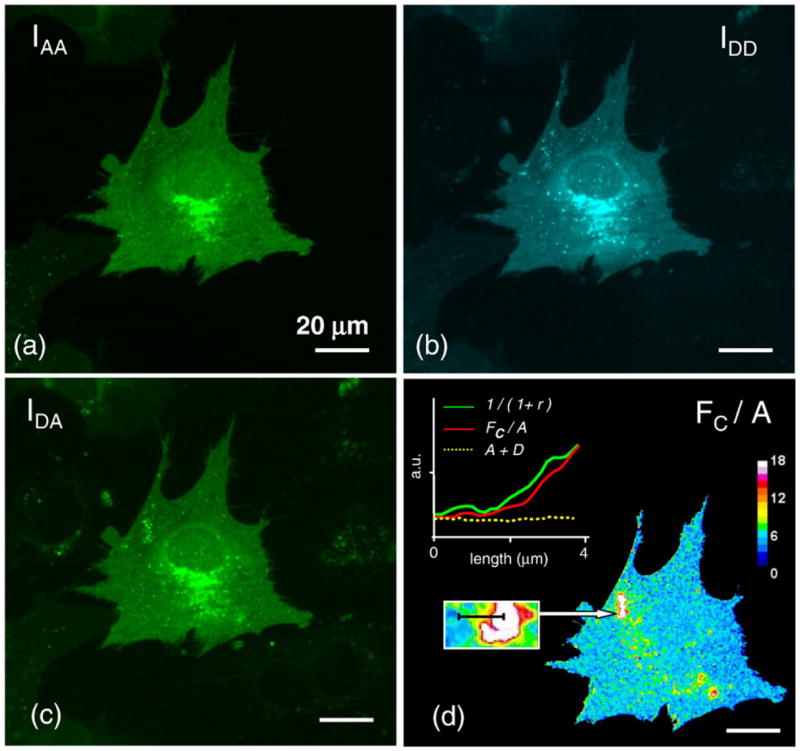
Fig. 2
FRET analysis of DDR1 dimerization. 3T3 cells transiently transfected with both DDR1u2013YFP and DDR1u2013CFP were imaged live. For the same region, images were acquired sequentially in the I AA , I D...
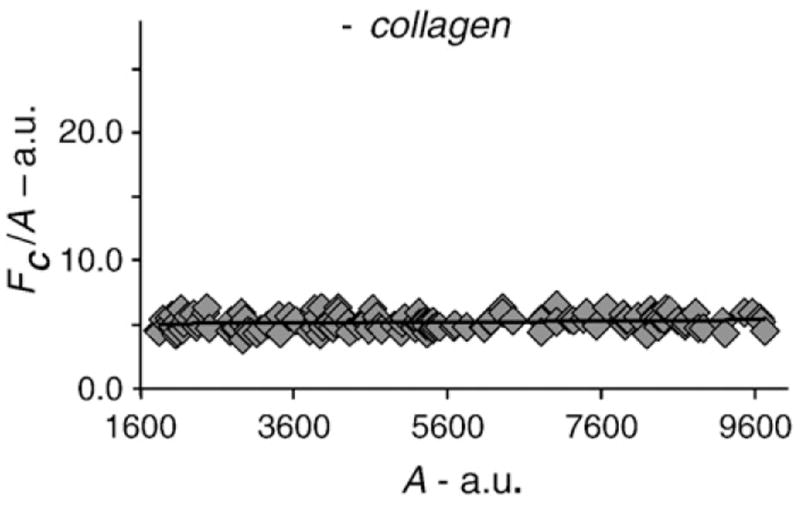
Fig. 3
The FRET index was plotted against the acceptor levels for nonstimulated samples. All data points (ROIs) included have similar A / D ratios, and the FRET index shows little dependence on the receptor ...
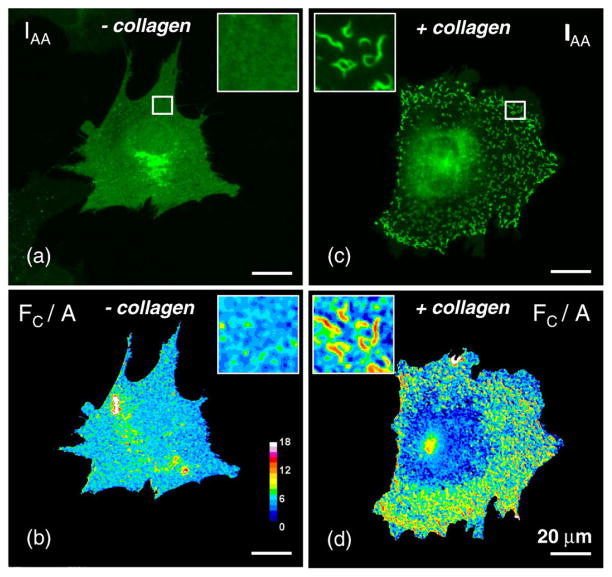
Fig. 4
Collagen induces DDR1 aggregation and increase in FRET signal. 3T3 cells cotransfected with DDR1u2013YFP and DDR1u2013CFP were imaged before and after stimulation with collagen type I (as indicated); ...
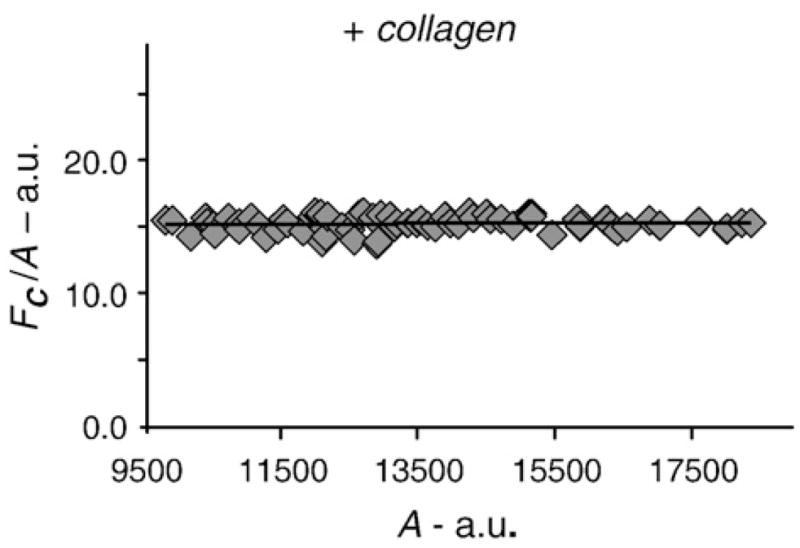
Fig. 5
The FRET index was plotted against the acceptor levels for collagen-stimulated samples (5-min time point). All data points (ROIs) included have similar A / D ratios, and the FRET index shows little de...
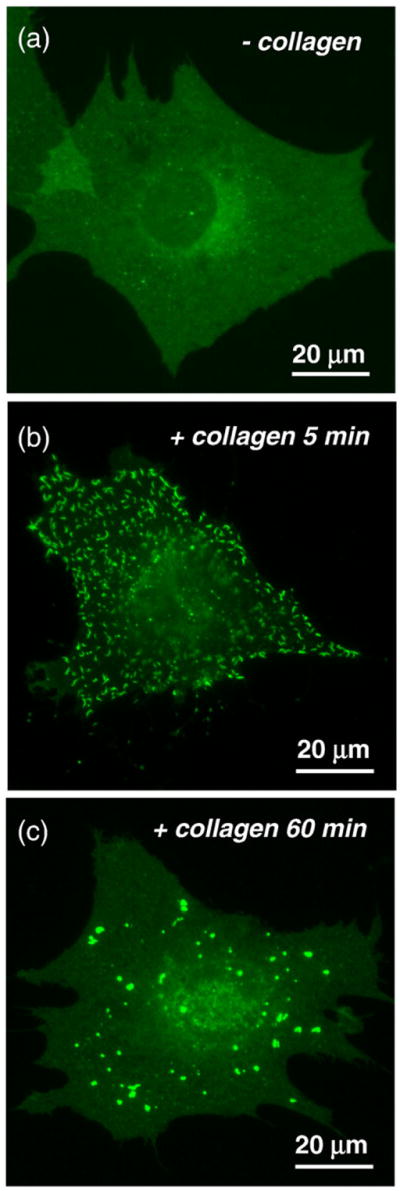
Fig. 6
Dynamics of DDR1 aggregation. 3T3 cells transiently transfected with DDR1u2013YFP were imaged live before and after stimulation with collagen type I. (a) Nonstimulated cells show uniform distribution ...
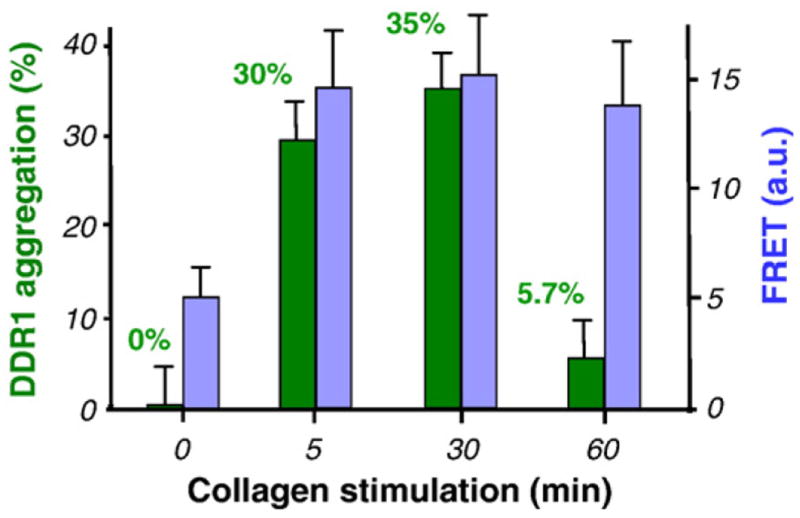
Fig. 7
Quantitative analysis of the aggregation process depicted in Fig. 6 . Aggregation percentage is depicted in green (left axis), together with the increase in FRET (blue; right axis). The two processes ...
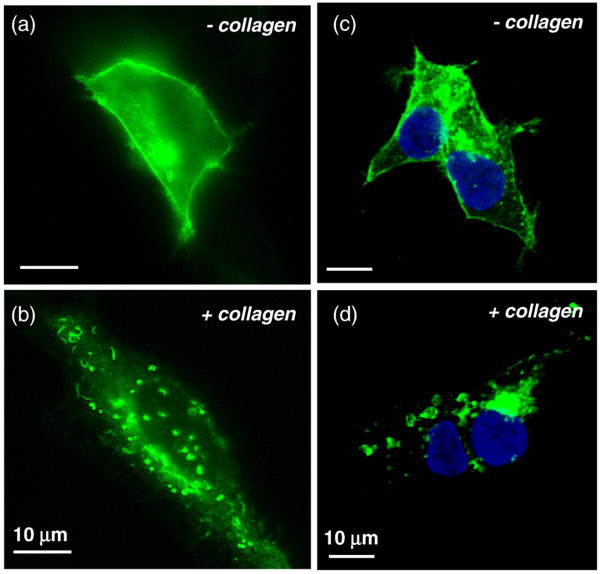
Fig. 8
DDR1 aggregation takes place through receptor internalization. HEK293 cells were cultured on glass-bottom culture dishes, transiently transfected with DDR1u2013YFP, and stimulated with collagen type I...
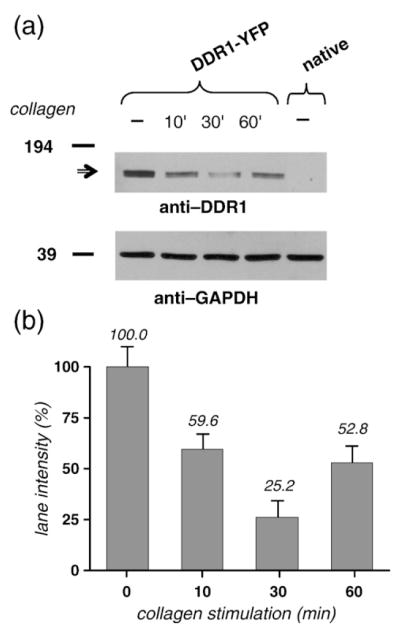
Fig. 9
Collagen stimulation decreases the amount of soluble DDR1 in the cell lysate. (a) HEK293 cells, transiently transfected with DDR1u2013YFP, were stimulated with 10 u03bcg/ml collagen type I for 0-min, ...
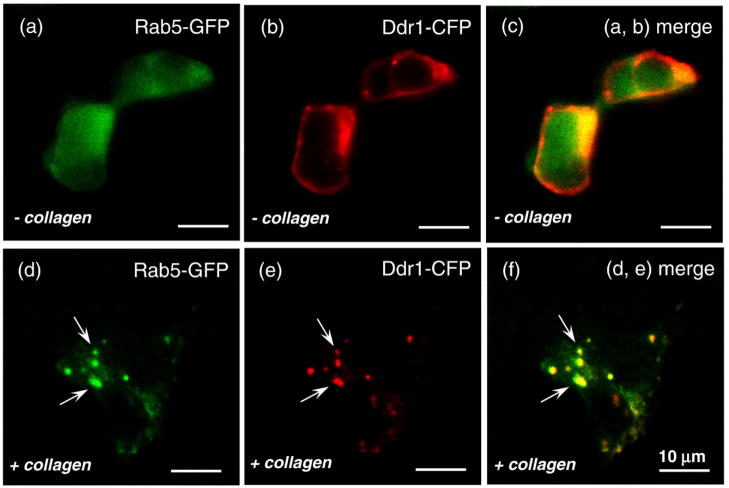
Fig. 10
DDR1 aggregates colocalize with Rab5a. HEK293 cells were transiently transfected with both DDR1u2013CFP and Rab5a-GFP and stimulated with collagen type I for 15 min (as indicated). Confocal images of ...
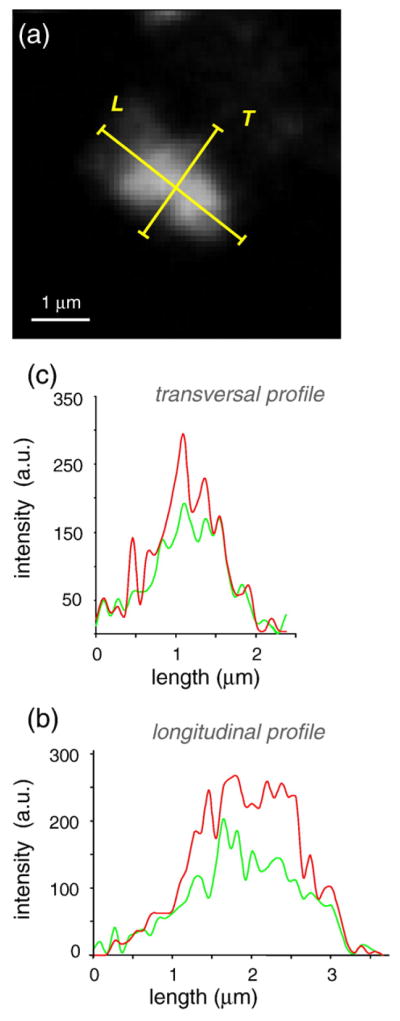
Fig. 11
Object-based colocalization analysis. (a) Longitudinal ( L ) and transversal ( T ) linear ROIs along a DDR1u2013CFP aggregate. Intensity profiles along the longitudinal (b) and transversal (c) ROIs in...
Scheme 1
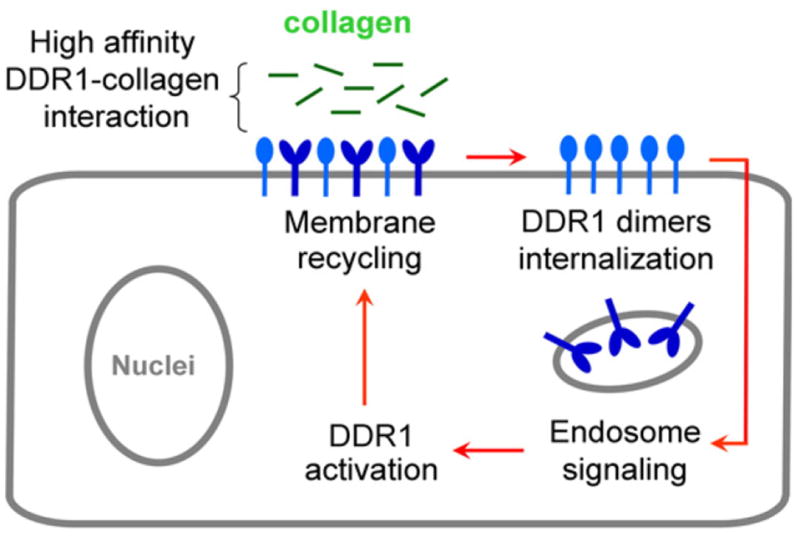
Proposed model of DDR1 activation mechanism. DDR1 exists on the cell membrane as a mixture of monomers and dimers. High-affinity interaction between DDR1 and collagen monomers induces internalization ...
Figure images are served from the NIH/NLM PubMed Central Open Access Subset or Europe PMC; copyright remains with the publishers and authors.
💬 Discussion
0 commentsNo comments yet. Be the first to start a discussion!
Leave a Comment