Abstract
SummaryWhen electron microscopy (EM) was introduced in the 1930s it gave scientists their first look into the nanoworld of cells. Over the last 80 years EM has vastly increased our understanding of the complex cellular structures that underlie the diverse functions that cells need to maintain life. One drawback that has been difficult to overcome was the inherent lack of volume information, mainly due to the limit on the thickness of sections that could be viewed in a transmission electron microscope (TEM). For many years scientists struggled to achieve three‐dimensional (3D) EM using serial section reconstructions, TEM tomography, and scanning EM (SEM) techniques such as freeze‐fracture. Although each technique yielded some special information, they required a significant amount of time and specialist expertise to obtain even a very small 3D EM dataset. Almost 20 years ago scientists began to exploit SEMs to image blocks of embedded tissues and perform serial sectioning of these tissues inside the SEM chamber. Using first focused ion beams (FIB) and subsequently robotic ultramicrotomes (serial block‐face, SBF‐SEM) microscopists were able to collect large volumes of 3D EM information at resolutions that could address many important biological questions, and do so in an efficient manner. We present here some examples of 3D EM taken from the many diverse specimens that have been imaged in our core facility. We propose that the next major step forward will be to efficiently correlate functional information obtained using light microscopy (LM) with 3D EM datasets to more completely investigate the important links between cell structures and their functions.
🔬 Techniques
🔭 Microscopes
🧬 Organisms
✨ Fluorophores
🧪 Sample Preparation
🔬 Cell Lines
🏭 Microscope Brands
🧪 Reagent Suppliers
🔴 Lasers
💻 Software Details
🏛️ Research Organizations (ROR)
Affiliated research institutions:
📋 Methods
SBF-SEM For SBF-SEM, samples were fixed and prepared with variations of the protocol as described by Deerinck et al . ( 2010 ). Resin embedded samples were mounted on an aluminium specimen pin (Gatan, www.gatan.com ), using conductive epoxy (Circuit Works, www.chemtronics.com ). The specimens were precision trimmed in a pyramid shape using an ultramicrotome and coated with 5 nm of Pt, in a Quorum Q 150T ES sputter coater ( www.quorumtech.com ). The aluminium pins were placed in the Gatan 3View2 ( www.gatan.com ) in a Zeiss Merlin SEM ( www.zeiss.com ). The block was faced with the 3View ultramicrotome unit to remove the platinum top layer and for imaging we used the Gatan Digiscan II ESB detector at an accelerating voltage of between 1.3 and 1.8 kV (sample dependent). An important adaptation to the staining protocol for Arabidopsis root tips and other fragile samples was an agarose embedding step after the initial fixation, and for plants the use of ruthenium red and Spurr’s epoxy. In brief, 5-day-old Arabidopsis seedlings on agar plates were fixed in 0.1 M phosphate buffer pH 6.8, 3% glutaraldehyde and 2% paraformaldehyde for 2 h. Individual samples were encased in rectangular agarose blocks, as described (Wu et al ., 2012 ). The samples were transferred to fresh fixative and kept overnight at 4 °C. The next day, samples were washed 5× 3 min in cold 0.15 M cacodylate buffer. E n bloc contrast staining was performed by consecutive incubations in heavy metal containing solutions. Between these steps samples were always washed 5× 3 min in ultrapure water (UPW). The first staining step was a 1-h incubation on ice in 0.2% ruthenium red and 2% aqueous osmium tetroxide in 0.15 M cacodylate buffer. After washing, the samples were incubated for 20 min in a fresh thiocarbohydrazide solution (1% w/v in UPW) at room temperature (RT). The next wash step was followed by incubation in 2% osmium in UPW at RT for 30 min and 2% uranyl acetate at 4 °C overnight. The following day, Walton’s lead aspartate staining was performed for 30 min at 60 °C. For this, a 30 mM L-aspartic acid solution was used to freshly dissolve lead nitrate (20 mM, pH 5.5), the solution was filtered and blocks incubated for 30 min at 60 °C. After final washing steps, the samples were dehydrated using ice-cold solutions of 30%, 50%, 70%, 90%, 2× 100% ethanol (anhydrous), 2× 100% aceton, 30 min each. Resin embedding was done using Spurr’s (Electron Microscopy Sciences, www.electronmicroscopysciences.com/ ) by first placing the samples in 30% propylene oxide/Spurr’s for 2 h, 50% propylene oxide/Spurr’s for 2 h, followed by three incubations in 100% Spurr’s (overnight, 8 h and overnight). The next day samples were put in fresh Spurr’s resin and placed at 60 °C for 24 h. The use of Spurr’s as embedding resin was also preferred for skin tissue due to its low viscosity. When making use of lanthanide salts, staining was performed as described (Deerinck et al ., 2010 ), replacing the uranyl acetate incubation step with overnight incubation in UAR-EMS uranyl acetate replacement stain (Electron Microscopy Sciences, www.electronmicroscopysciences.com ) 1:3 in H 2 O. FIB-SEM For FIB-SEM, cellular monolayers were grown either on Aclar (7.8 mils, Electron Microscopy Sciences, www.electronmicroscopysciences.com ) or on gridded coverslips (MatTek Corporation, 200 Homer Ave, Ashland, MA 01721, USA). Samples were prepared as described by Knott et al . ( 2011 ) and resin embedded samples were mounted on stubs and coated with 8 nm of Pt in a Quorum Q 150T ES sputter coater (Quorum Technologies, www.quorumtech.com ). The stubs were placed in the Zeiss Auriga FE-FIB-SEM ( www.zeiss.com ) and the SEM was used at 15 kV to visualize cells/tissues below the Pt layer and localize the cell or region of interest (ROI). Subsequently, the stage was tilted 54°, so that the surface was perpendicular to the FIB.
Show full methods section
SBF-SEM For SBF-SEM, samples were fixed and prepared with variations of the protocol as described by Deerinck et al . ( 2010 ). Resin embedded samples were mounted on an aluminium specimen pin (Gatan, www.gatan.com ), using conductive epoxy (Circuit Works, www.chemtronics.com ). The specimens were precision trimmed in a pyramid shape using an ultramicrotome and coated with 5 nm of Pt, in a Quorum Q 150T ES sputter coater ( www.quorumtech.com ). The aluminium pins were placed in the Gatan 3View2 ( www.gatan.com ) in a Zeiss Merlin SEM ( www.zeiss.com ). The block was faced with the 3View ultramicrotome unit to remove the platinum top layer and for imaging we used the Gatan Digiscan II ESB detector at an accelerating voltage of between 1.3 and 1.8 kV (sample dependent). An important adaptation to the staining protocol for Arabidopsis root tips and other fragile samples was an agarose embedding step after the initial fixation, and for plants the use of ruthenium red and Spurr’s epoxy. In brief, 5-day-old Arabidopsis seedlings on agar plates were fixed in 0.1 M phosphate buffer pH 6.8, 3% glutaraldehyde and 2% paraformaldehyde for 2 h. Individual samples were encased in rectangular agarose blocks, as described (Wu et al ., 2012 ). The samples were transferred to fresh fixative and kept overnight at 4 °C. The next day, samples were washed 5× 3 min in cold 0.15 M cacodylate buffer. E n bloc contrast staining was performed by consecutive incubations in heavy metal containing solutions. Between these steps samples were always washed 5× 3 min in ultrapure water (UPW). The first staining step was a 1-h incubation on ice in 0.2% ruthenium red and 2% aqueous osmium tetroxide in 0.15 M cacodylate buffer. After washing, the samples were incubated for 20 min in a fresh thiocarbohydrazide solution (1% w/v in UPW) at room temperature (RT). The next wash step was followed by incubation in 2% osmium in UPW at RT for 30 min and 2% uranyl acetate at 4 °C overnight. The following day, Walton’s lead aspartate staining was performed for 30 min at 60 °C. For this, a 30 mM L-aspartic acid solution was used to freshly dissolve lead nitrate (20 mM, pH 5.5), the solution was filtered and blocks incubated for 30 min at 60 °C. After final washing steps, the samples were dehydrated using ice-cold solutions of 30%, 50%, 70%, 90%, 2× 100% ethanol (anhydrous), 2× 100% aceton, 30 min each. Resin embedding was done using Spurr’s (Electron Microscopy Sciences, www.electronmicroscopysciences.com/ ) by first placing the samples in 30% propylene oxide/Spurr’s for 2 h, 50% propylene oxide/Spurr’s for 2 h, followed by three incubations in 100% Spurr’s (overnight, 8 h and overnight). The next day samples were put in fresh Spurr’s resin and placed at 60 °C for 24 h. The use of Spurr’s as embedding resin was also preferred for skin tissue due to its low viscosity. When making use of lanthanide salts, staining was performed as described (Deerinck et al ., 2010 ), replacing the uranyl acetate incubation step with overnight incubation in UAR-EMS uranyl acetate replacement stain (Electron Microscopy Sciences, www.electronmicroscopysciences.com ) 1:3 in H 2 O. FIB-SEM For FIB-SEM, cellular monolayers were grown either on Aclar (7.8 mils, Electron Microscopy Sciences, www.electronmicroscopysciences.com ) or on gridded coverslips (MatTek Corporation, 200 Homer Ave, Ashland, MA 01721, USA). Samples were prepared as described by Knott et al . ( 2011 ) and resin embedded samples were mounted on stubs and coated with 8 nm of Pt in a Quorum Q 150T ES sputter coater (Quorum Technologies, www.quorumtech.com ). The stubs were placed in the Zeiss Auriga FE-FIB-SEM ( www.zeiss.com ) and the SEM was used at 15 kV to visualize cells/tissues below the Pt layer and localize the cell or region of interest (ROI). Subsequently, the stage was tilted 54°, so that the surface was perpendicular to the FIB.
Using the gas injection system
(GIS) an additional layer of Pt was deposited on the ROI to protect the surface from beam damage (FIB current 500pA-1nA, 5 min). To create a surface to image with the SEM, a trench was milled just before the Pt covered area, using high currents (6.5–10 nA) to reduce the preparation time. After this, the sample was allowed to stabilize in the vacuum for at least 1 h, but preferably overnight to minimize drift during imaging. Images were acquired using an ESB detector (grid: 1194 V) at 1.5 kV and 3072 × 2304 pixels. Imaging parameters were adjusted so that imaging time did not exceed 1 min. Next, the FIB was set up to mill the Pt covered area at a current of 2 nA and 5–20 nm sections.
Microwave tissue processing
Tissue samples from mouse brain and skin were fixed in 2% PFA, 2.5% glutaraldehyde in 0.15 M Cacodylate buffer pH 7.4 with 2 mM CaCl 2 . Samples of Arabidopsis leaves were fixed in 0.5% PFA, 2.5% Glutaraldehyde in 0.1 M phosphate buffer pH 6.8. After several washes in buffer samples were processed in a Pelco Biowave Pro, (Ted Pella, Inc., www.tedpella.com ) with use of microwave energy and vacuum. Briefly, samples were fixed in 1% reduced Osmium in cacodylate buffer with CaCl 2 7× 2 min with alternating microwave power of 100 W/0 W. This step was repeated once. After two washes in UPW with power of 250 W, samples were stained in 1% Uranyl acetate 7× 1 min with alternating microwave power of 150 W/0 W. After two washes in UPW, samples were dehydrated in series of EtOH, each step 40 s at 250 W without vacuum. In the next steps samples were infiltrated in series of different dilutions of Epon resin: EtOH 7× 3 min each at 250 W with vacuum. Finally, samples were embedded in Epon resin 30 min at 200 W, 2× 45 min at 375 W with no vacuum.
Image processing
Images were acquired as a series of 2D tiff (FIB-SEM) or dm3 (3view) files. In order to compile a 3D tiff file format, the images were registered in Fiji (Schindelin et al ., 2012 ) ( http://fiji.sc/Fiji ; Plugin Registration > StackReg > Translation) or IMOD (Kremer et al ., 1996 ) ( http://bio3d.colorado.edu/imod/; tiltxcorr algorithm ). Representation of orthogonal views and/or threshold-based segmentation was done in Imaris (BitPlane, www.bitplane.com ) or Fiji’s 3D Viewer. Manual segmentation and visualization of 3D data was done using 3DMOD ( http://bio3d.colorado.edu/imod/doc/3dmodguide.html ). 3D reconstructions of confocal images were done using Volocity (PerkinElmer, www.perkinelmer.co.uk/volocity ). Near infrared branding After live-imaging, mouse brain samples were fixed for 3D EM using 2% PFA, 2.5% GA in 0.15 M cacodylate buffer. Subsequently, one hemisphere was sectioned at 60 μm using a Leica VT1200S vibratome (Leica, www.leica-microsystems.com ), and the ROI was reacquired using the pattern of blood vessels visualized with phase-contrast LM as a guide. After determining which section contained the region imaged by LM, four small laser brands were scarred into the tissue using the NIRB technique as described by Bishop et al . ( 2011 ) using a Zeiss LSM 780 ( www.zeiss.com ) equipped with a Spectra Physics MaiTai multiphoton laser. Tissue was subsequently prepared for EM.
📊 Figures
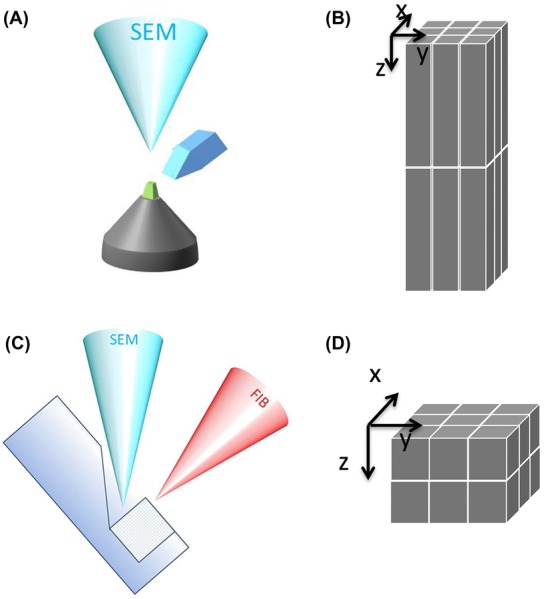
Figure 1
Schemes of serial block-face SEM techniques. (A) A schematic view of SBF-SEM: the electron beam scans the surface of the sample and sections (u226520 nm) are removed by a fully automated ultra-microto...
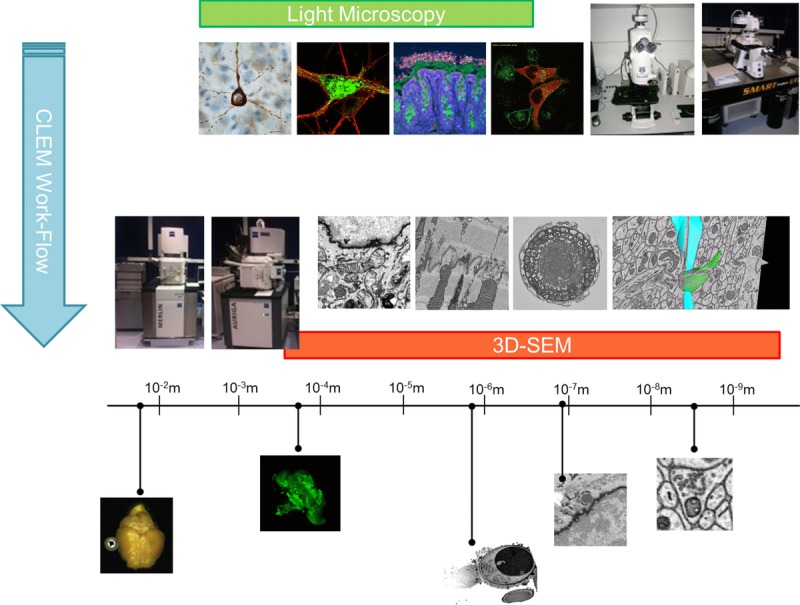
Figure 2
Summary of imaging modalities and scales. Diagram illustrating the imaging modalities and scales used in correlative microscopy. Making use of LM techniques that can yield large fields of view as well...
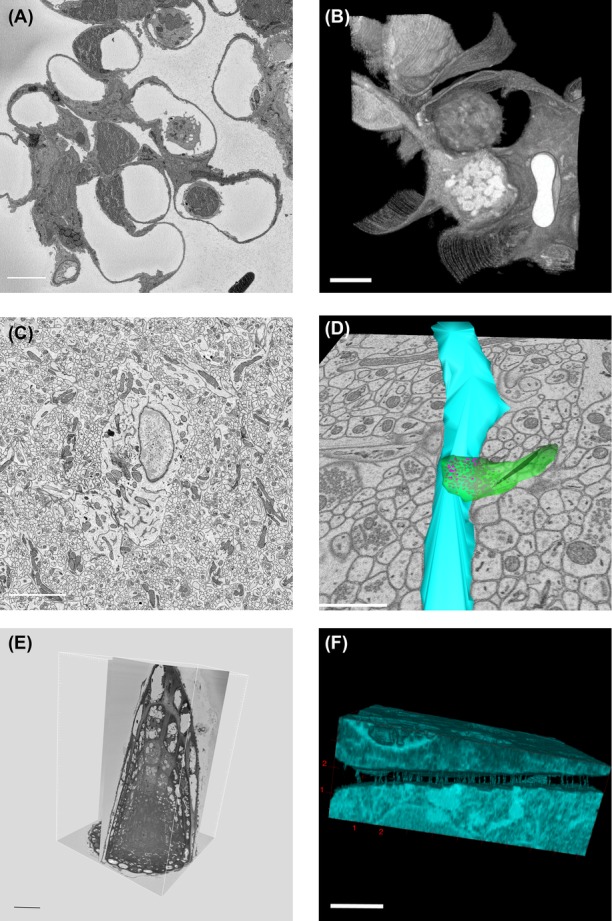
Figure 3
3D-EM images, acquired by SBF-SEM. (A) Mouse lung tissue imaged by SBF-SEM, X , Y pixels 37 nm, Z slices 70 nm. Single plane from 3D series showing lung alveoli and immune cells. Dark areas in left co...
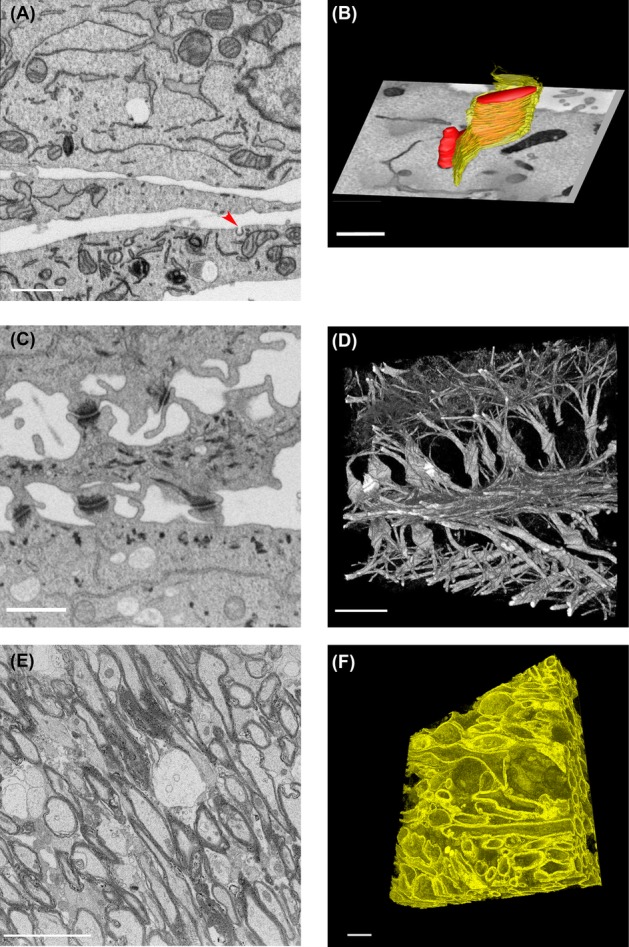
Figure 4
Examples of 3D-EM using FIB-SEM. (A) Mouse embryonic fibroblasts. A single image showing numerous subcellular organelles. The red arrowhead indicates a clathrin coated pit. Scale bar: 1 u03bcm. (B) Ma...
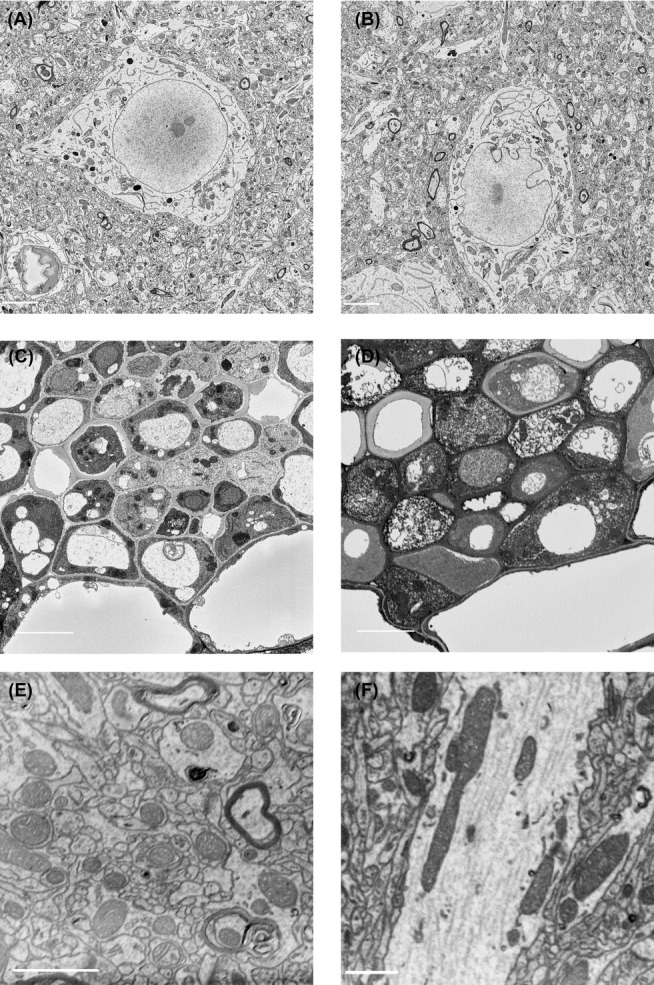
Figure 5
Developing new protocols for SBF-SEM. (A) Mouse brain tissue stained with an Osmium Thiocarbohydrazide Osmium protocol using Uranyl Acetate en bloc staining (Deerinck etu00a0al ., 2010). Scale bar: 10...
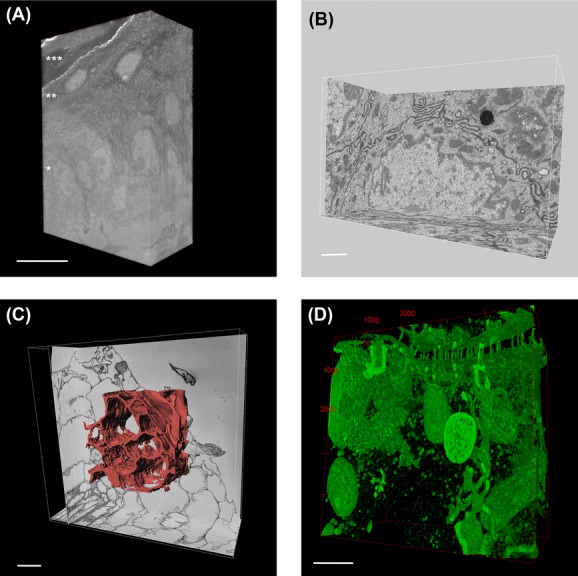
Figure 6
Consecutive SBF-SEM and FIB-SEM imaging. (A) A volume of 26,75 u00d7 38,20 u00d7 12,83 u03bcm of normal mouse skin reconsted from SBF-SEM imaging. Undifferentiated basal layer (*) and differentiated l...
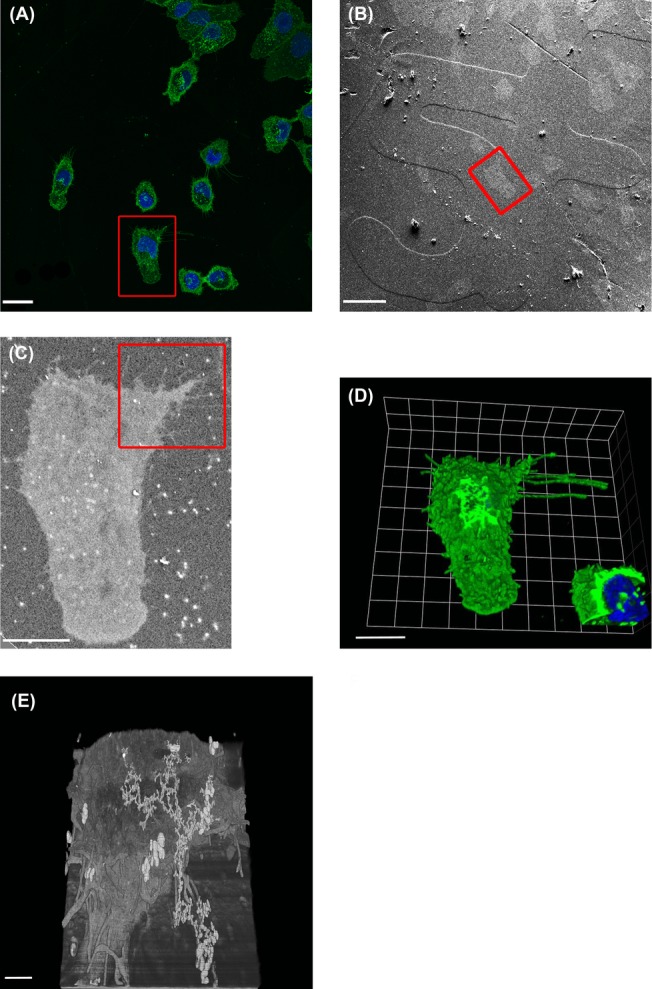
Figure 7
CLEM. (A) Human lung epithelial A549 cells were grown on gridded coverslips and imaged by confocal microscopy, with wheat germ agglutinin in green and nuclear dye in blue the cells of interest are hig...
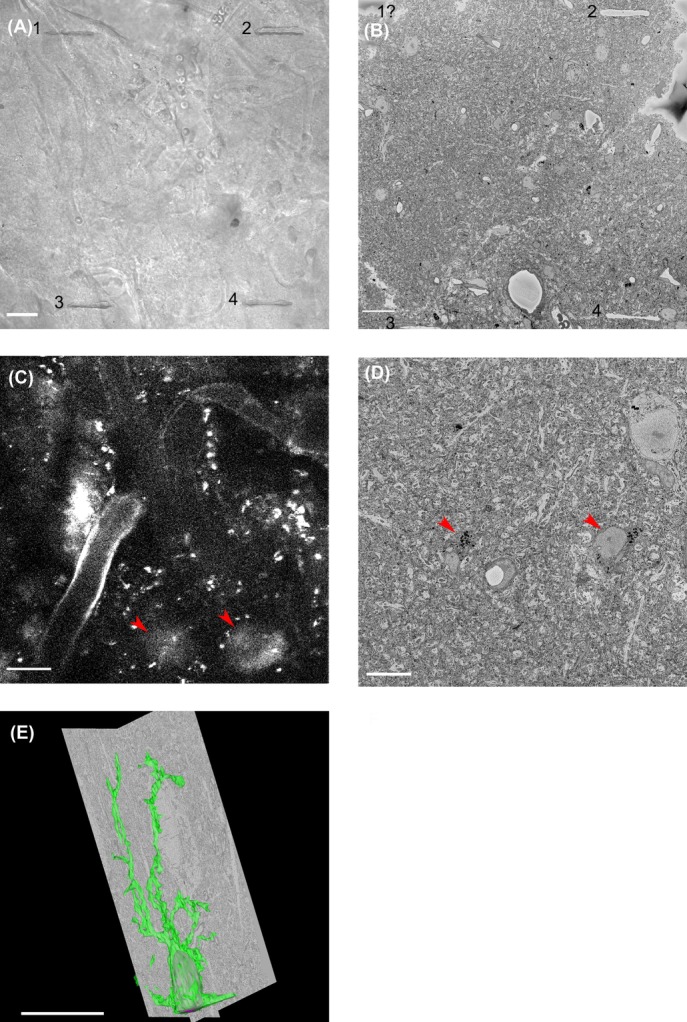
Figure 8
CLEM. (A) NIRB was used to introduce scars in brain tissue, after live-cell imaging, in order to create reference points that allow correlation of the LM images to SBF-SEM data. A bright-field image s...
Figure images are served from the NIH/NLM PubMed Central Open Access Subset or Europe PMC; copyright remains with the publishers and authors.
💬 Discussion
0 commentsNo comments yet. Be the first to start a discussion!
Leave a Comment