Abstract
The Eukaryotic RecA-like proteins Rad51 and Dmc1 cooperate during meiosis to promote recombination between homologous chromosomes by repairing programmed DNA double strand breaks (DSBs). Previous studies showed that Rad51 and Dmc1 form partially overlapping co-foci. Here we show these Rad51-Dmc1 co-foci are often arranged in pairs separated by distances of up to 400 nm. Paired co-foci remain prevalent when DSBs are dramatically reduced or when strand exchange or synapsis is blocked. Super-resolution dSTORM microscopy reveals that individual foci observed by conventional light microscopy are often composed of two or more substructures. The data support a model in which the two tracts of ssDNA formed by a single DSB separate from one another by distances of up to 400 nm, with both tracts often bound by one or more short (about 100 nt) Rad51 filaments and also by one or more short Dmc1 filaments.
🔬 Techniques
🧬 Organisms
💻 Software
✨ Fluorophores
🧪 Sample Preparation
🏭 Microscope Brands
🧪 Reagent Suppliers
💻 Software Details
🏛️ Research Organizations (ROR)
Affiliated research institutions:
📋 Methods
Strains
Tetraploid spo11 hypomorphic strains were constructed by mating a SPO11/spo11-Y135F a/Δ diploid with a spo11-Y135F/spo11-Y135F α/Δ diploid[ 63 ]. The a/Δ and α/Δ diploids were obtained by gene targeting with DNA constructs designed to delete the MATα or the MATa locus, respectively. The strain with cytological landmarks in Fig 2 was constructed by combining the HIS4 :: LEU2 DSB hotspot[ 55 ], a tetO array, a lacO array, YFP-TetR, and 3xHA-LacI via genetic crosses[ 64 ]. lacO and tetO arrays were inserted into Chr III , centromere proximal and distal to the HIS4 :: LEU2 DSB hotspot, respectively, using the cloning-free method[ 65 ]. For the spo11 VDE cut site heterozygote experiment in Fig 2 , DKB 4571 was constructed by mating of YOC 3524 and YOC 3525[ 30 ], provided by the Ohya Lab. DKB 5369 was constructed by transformation of YOC 3524 and YOC 3525 with a PCR product designed to introduce an mnd1 mutation followed by mating. See S1 Text for further details and S1 Table for genotypes. Meiosis and Cytology Transfer to sporulation medium was used to induce synchronous meiotic cultures and preparation of spread chromosomes was previously described[ 16 ]. For experiments requiring visualization of LacI-3xHA, 4 mM PMSF was added to spheroplast suspensions and the solutions used for spreading. Rabbit anti-Rad51 (#159) and goat or guinea pig anti-Dmc1 (#189 or #174) antibodies were utilized at 1:1000 dilutions. Chicken anti-GFP (Invitrogen) was used at 1:1000, and mouse anti-HA (Santa Cruz) was used at 1:100. Alexa fluor 488 and 594 labeled secondary antibodies (Invitrogen) were used to stain Rad51 and Dmc1. Alexa fluor 647 and 750 labeled secondary antibodies (Invitrogen) were used to stain for GFP and HA. All secondary antibodies were used at 1:1000, except Alexa fluor 750 which was used at 1:100. For Fig 2A–2E , the goat anti-Zip1 antibody (Santa Cruz, sc-15632) was used at 1:1000 and stained with 1:1000 Alexa 594 secondary antibody. Images were acquired on a Zeiss Axiovision 4.6 microscope at 100X magnification and adjusted for brightness and contrast on ImageJ/FIJI software. For all two-color experiments, proper registration of image pairs obtained with different filter sets was confirmed using fluorescent beads (Molecular Probes, L-5241). For dSTORM microscopy, spreads were stained with 1:1000 rabbit anti-Rad51 (or 1:1000 goat anti-Dmc1) and then with 1:1000 Alexa fluor 647 secondary. 0.05% Triton X-100 was included in the TBS washes to reduce background. Coverslips were mounted on a depression well slide filled with 10 mM MEA (prepared in PBS) and sealed with a two-part curable rubber product called “Body Double” (Smooth-On, Inc). Image sequences were acquired on a Leica SR GSD 3D microscope in 2D epifluorescence mode. Depletion with the 642 laser at 100% power was performed until the frame correlation dropped below 0.05, then acquisition commenced at 60% laser power. At least 25,000 frames were acquired. Images were reconstructed with the QuickPALM plugin[ 66 ] on FIJI using: an input pixel size of 100 nm, a reconstruction pixel size of 20 nm, a minimum SNR of 5.00, minimum symmetry of 0%, local threshold of 25%, maximum iterations per frame of 1000, and 50 threads. Also, a FWHM of 2 pixels was used to eliminate an artifact in which a large fraction of adjacent structures appear to be connected by a thin, sparsely populated thread (see S1 Text ). This artifact is due to the almost simultaneous blinking of two adjacent fluorophores resulting in a “mis-called” event half way between two diffraction-limited blinks ( S2 Fig ). A 0.75 pixel Gaussian blur was applied to each micrograph before analysis. For Fig 5Q–5T , Rad51 was over-expressed[ 46 , 67 ]. For Fig 4A–4D , in vitro Rad51 assembly reactions were performed as previously described[ 9 ] with the following exceptions. The assembly reaction included 0.5 nM 2.7 kb linear dsDNA (1.35 μM bp) generated by asymmetric PCR of pRS306 with one biotinylated primer, 1.6 μM Rad51, and 1 μM Hed1 to stabilize the filament[ 68 ]. The reaction was fixed with 3% PFA prepared in reaction buffer and then added to previously prepared coverslips coated with streptavidin by a modified version of a previously established protocol[ 69 ]. Slides were stained and imaged using dSTORM as described above.
Show full methods section
Strains
Tetraploid spo11 hypomorphic strains were constructed by mating a SPO11/spo11-Y135F a/Δ diploid with a spo11-Y135F/spo11-Y135F α/Δ diploid[ 63 ]. The a/Δ and α/Δ diploids were obtained by gene targeting with DNA constructs designed to delete the MATα or the MATa locus, respectively. The strain with cytological landmarks in Fig 2 was constructed by combining the HIS4 :: LEU2 DSB hotspot[ 55 ], a tetO array, a lacO array, YFP-TetR, and 3xHA-LacI via genetic crosses[ 64 ]. lacO and tetO arrays were inserted into Chr III , centromere proximal and distal to the HIS4 :: LEU2 DSB hotspot, respectively, using the cloning-free method[ 65 ]. For the spo11 VDE cut site heterozygote experiment in Fig 2 , DKB 4571 was constructed by mating of YOC 3524 and YOC 3525[ 30 ], provided by the Ohya Lab. DKB 5369 was constructed by transformation of YOC 3524 and YOC 3525 with a PCR product designed to introduce an mnd1 mutation followed by mating. See S1 Text for further details and S1 Table for genotypes. Meiosis and Cytology Transfer to sporulation medium was used to induce synchronous meiotic cultures and preparation of spread chromosomes was previously described[ 16 ]. For experiments requiring visualization of LacI-3xHA, 4 mM PMSF was added to spheroplast suspensions and the solutions used for spreading. Rabbit anti-Rad51 (#159) and goat or guinea pig anti-Dmc1 (#189 or #174) antibodies were utilized at 1:1000 dilutions. Chicken anti-GFP (Invitrogen) was used at 1:1000, and mouse anti-HA (Santa Cruz) was used at 1:100. Alexa fluor 488 and 594 labeled secondary antibodies (Invitrogen) were used to stain Rad51 and Dmc1. Alexa fluor 647 and 750 labeled secondary antibodies (Invitrogen) were used to stain for GFP and HA. All secondary antibodies were used at 1:1000, except Alexa fluor 750 which was used at 1:100. For Fig 2A–2E , the goat anti-Zip1 antibody (Santa Cruz, sc-15632) was used at 1:1000 and stained with 1:1000 Alexa 594 secondary antibody. Images were acquired on a Zeiss Axiovision 4.6 microscope at 100X magnification and adjusted for brightness and contrast on ImageJ/FIJI software. For all two-color experiments, proper registration of image pairs obtained with different filter sets was confirmed using fluorescent beads (Molecular Probes, L-5241). For dSTORM microscopy, spreads were stained with 1:1000 rabbit anti-Rad51 (or 1:1000 goat anti-Dmc1) and then with 1:1000 Alexa fluor 647 secondary. 0.05% Triton X-100 was included in the TBS washes to reduce background. Coverslips were mounted on a depression well slide filled with 10 mM MEA (prepared in PBS) and sealed with a two-part curable rubber product called “Body Double” (Smooth-On, Inc). Image sequences were acquired on a Leica SR GSD 3D microscope in 2D epifluorescence mode. Depletion with the 642 laser at 100% power was performed until the frame correlation dropped below 0.05, then acquisition commenced at 60% laser power. At least 25,000 frames were acquired. Images were reconstructed with the QuickPALM plugin[ 66 ] on FIJI using: an input pixel size of 100 nm, a reconstruction pixel size of 20 nm, a minimum SNR of 5.00, minimum symmetry of 0%, local threshold of 25%, maximum iterations per frame of 1000, and 50 threads. Also, a FWHM of 2 pixels was used to eliminate an artifact in which a large fraction of adjacent structures appear to be connected by a thin, sparsely populated thread (see S1 Text ). This artifact is due to the almost simultaneous blinking of two adjacent fluorophores resulting in a “mis-called” event half way between two diffraction-limited blinks ( S2 Fig ). A 0.75 pixel Gaussian blur was applied to each micrograph before analysis. For Fig 5Q–5T , Rad51 was over-expressed[ 46 , 67 ]. For Fig 4A–4D , in vitro Rad51 assembly reactions were performed as previously described[ 9 ] with the following exceptions. The assembly reaction included 0.5 nM 2.7 kb linear dsDNA (1.35 μM bp) generated by asymmetric PCR of pRS306 with one biotinylated primer, 1.6 μM Rad51, and 1 μM Hed1 to stabilize the filament[ 68 ]. The reaction was fixed with 3% PFA prepared in reaction buffer and then added to previously prepared coverslips coated with streptavidin by a modified version of a previously established protocol[ 69 ]. Slides were stained and imaged using dSTORM as described above.
Analysis
Custom written ImageJ macros designated 4-spot macro were used to generate the nearest neighbor distributions in Figs 1 and 2 and 3 and S1 . Specifically, the (x,y) coordinates of focal centroids were determined manually with the ImageJ multipoint selection tool within the context of the macro. Note that Rad51 and Dmc1 foci were assumed to be diffraction limited spots (a valid assumption based on dSTORM micrographs). Thus, focus centroids as close as about 150 nm were often recognized as being distinct based on the fine appearance of staining structures (elongation vs perfectly circular focus, appearance of two maxima, etc), despite the fact that they were closer together than the resolution limit (around 250 nm). The nearest neighbor distributions were generated by coalescing output from the ImageJ macro using Excel. Simulated distributions were generated with custom written ImageJ macros (see S1 Text for details). dSTORM reconstructions were scored in FIJI. The elliptical selection tool was fit to each observed sr focus. The (x,y) coordinates and various other descriptors of the ellipses were measured. Nearest neighbor distributions were determined in Excel workbooks, and simulations were performed in ImageJ as above. For the Zip1 experiment in Fig 2 , the (x,y) coordinates of both Rad51 and Zip1 foci were determined in early prophase nuclei. Nuclei were selected for having both Rad51 and Zip1 staining, but only nuclei with a completely punctate Zip1 staining pattern were chosen for analysis. Scoring and simulation of nearest neighbor positions were performed as above. For the spo11 VDE cut site heterozygote experiment in Fig 2 , unselected nuclei were scored, but only focus-positive nuclei are included in the analysis. Single foci (category I) include Rad51-only, Dmc1-only, and Rad51-Dmc1 co-foci. Similarly, paired foci include all varieties of single foci, located within 1 μm of each other (category II). The “>2 Rad51 and/or Dmc1 foci” class (category III) includes structures where all of those foci are within 1 μm one another. The distant class (category IV) represents nuclei in which foci are separated by distances greater than 1 μm, but there are no more than 2 Rad51 or Dmc1 foci. Finally, the “>2 Rad51 and/or Dmc1 foci and distant” class (category V) consists of nuclei with two distinct cytological complexes separated by greater than 1 μm where the sum or Rad51 or Dmc1 foci is greater than two. Scoring the cytological landmark experiment in Fig 2 required multiple levels of filtering. First, only nuclei displaying lacO and tetO arrays were scored for experiments involving both landmarks. Meiotic proteolysis resulted in a large fraction of nuclei without lacO spots. Also, rare nuclei with >2 lacO or tetO spots were excluded from analysis. Furthermore, only nuclei with one Dmc1 focus within 300 nm of the point between the closest tetO and lacO foci and 0–2 Dmc1 foci within 1 μm of that Dmc1 focus were analyzed. All analysis was performed with ImageJ software.
Supporting Information S1 Fig Paired Rad51-Dmc1 co-foci are not the result of focus crowding and the staining intensities of Rad51 and Dmc1 in each constituent co-focus are unrelated to the other co-focus. ( A-F) Focus crowding does not account for pairing of Rad51 foci or pairing of Dmc1 foci. Observed (red) and simulated (blue) Rad51-Rad51 nearest neighbor distributions (A,C,E) and Dmc1-Dmc1 nearest neighbor distributions (B,D,F) in different subsets of foci from wild type spo11 hypomorphic nuclei. (A,B) The raw, unfiltered set of nuclei replicated from Fig 1F and 1G for comparison. (C,D) Nearest neighbor distributions of low-density nuclei (
📊 Figures
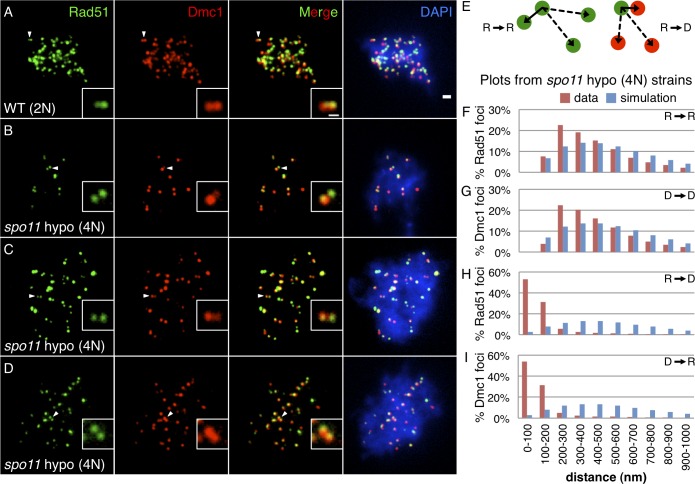
Fig 1
Rad51-Dmc1 co-foci occur in pairs separated by 200u2013400 nm.
(A) Spread wild type diploid [WT (2N)] nucleus stained for Rad51 (green) and Dmc1 (red). (B,C,D) Spread spo11 hypomorphic tetraploid [ spo11 hypo (4N)] nuclei with relatively low densities of Rad51-Dm...
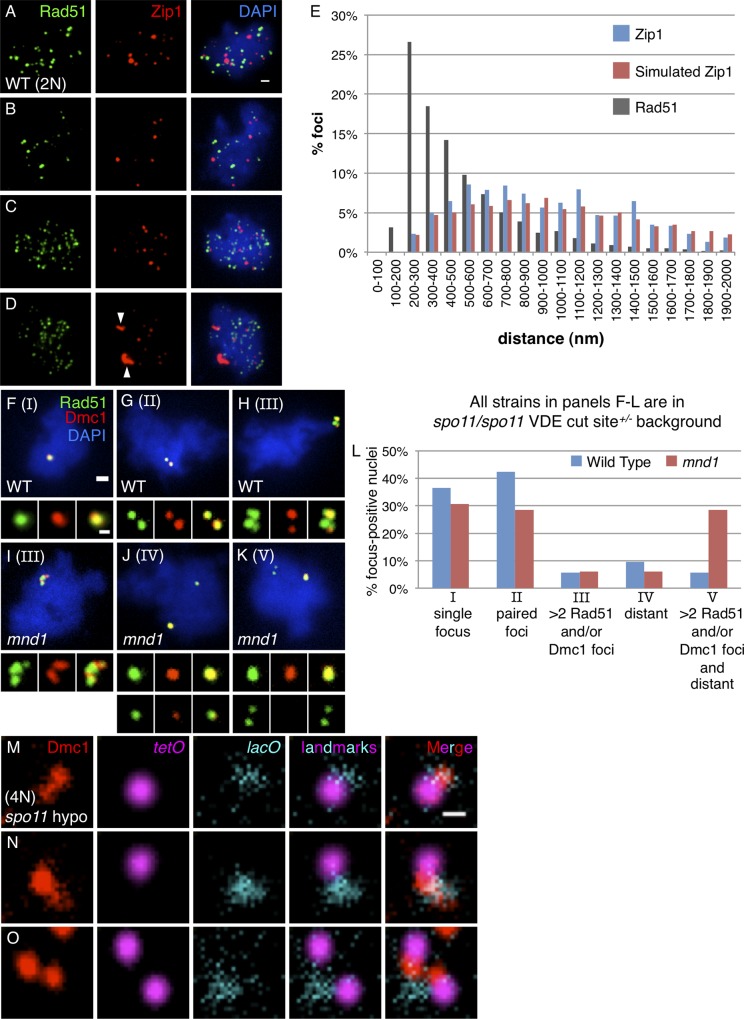
Fig 2
Rad51 and Dmc1 form structures inconsistent with asymmetric loading at individual meiotic DSBs.
( A-E ) Rad51 focus pairing is distinct from the spatial arrangement of Zip1. ( A-C ) Micrographs of wild type diploid leptotene (3 hr) nuclei included in the analysis in (E). Rad51 staining is shown ...
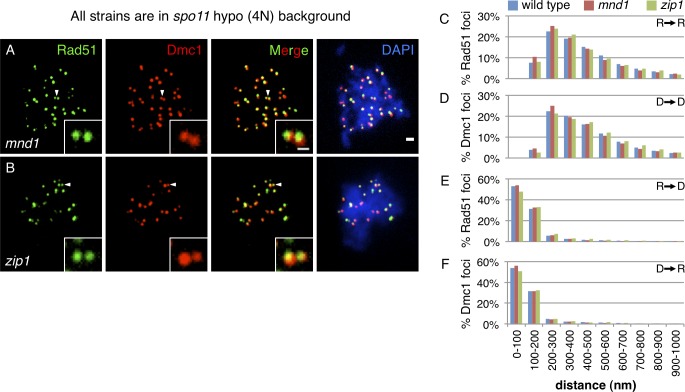
Fig 3
The paired architecture of Rad51-Dmc1 co-foci is independent of strand exchange and synapsis.
(A,B) Micrographs of (A) mnd1 and (B) zip1 mutant nuclei in the spo11 hypomorphic tetraploid background. Scale bar = 1 u03bcm, 400 nm for the inset. Rad51 staining is shown in green, Dmc1 in red, and ...
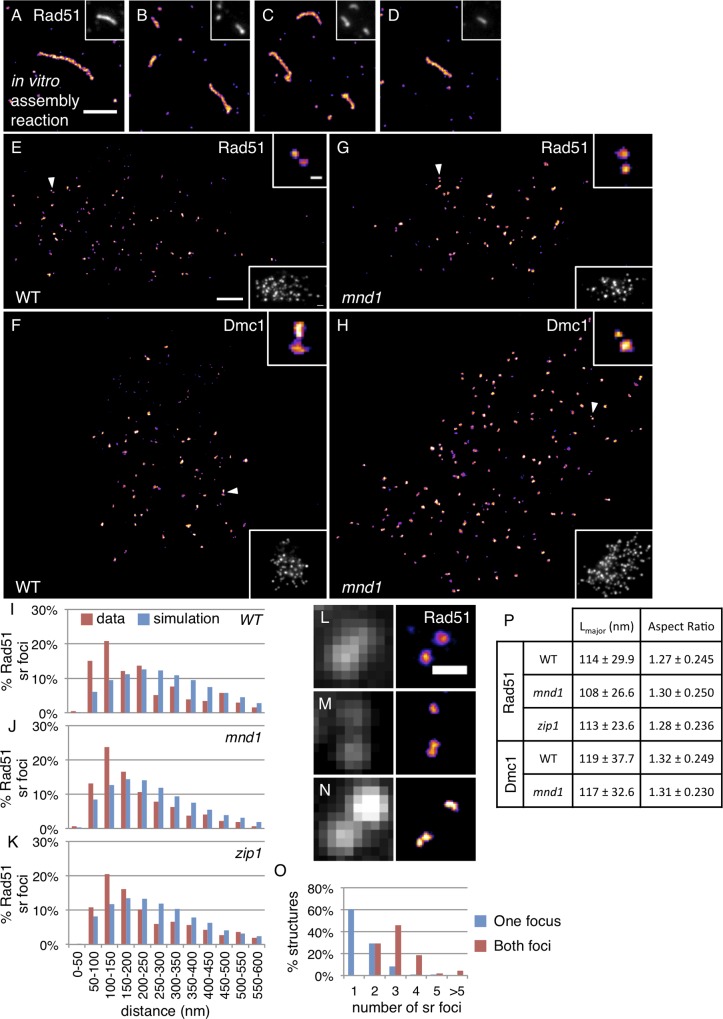
Fig 4
Rad51 and Dmc1 sr foci are extremely small and clustered at sub-diffraction distances.
(A-D) dSTORM micrographs of Rad51 filaments assembled on a linear 2.7 kbp dsDNA in vitro in the presence of the meiotic protein Hed1. Corresponding widefield micrographs are inset at top right and the...
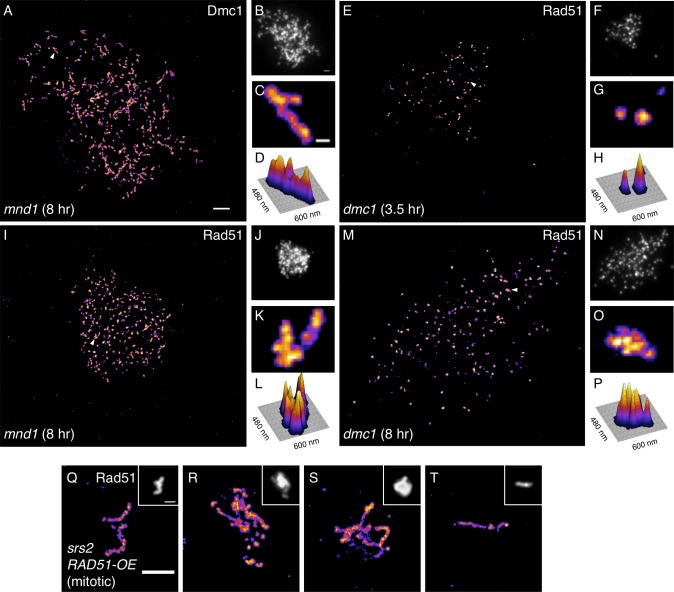
Fig 5
Elongated Dmc1 structures and higher order clustered Rad51 structures accumulate in strand exchange mutants at late times.
( A-D ) 8 hr mnd1 nucleus stained for Dmc1. ( A ) dSTORM and ( B) widefield micrographs each with 1 u03bcm scale bars. ( C ) Magnified region from (A) indicated by arrowhead, highlighting elongated Dm...
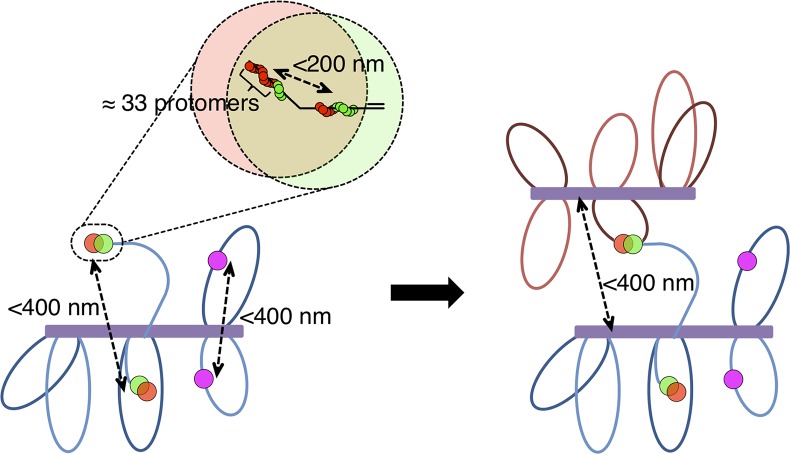
Fig 6
Recombinosome Model: Rad51 and Dmc1 each form short filaments on both spatially separated ends of a DSB.
(Top) Short helical Rad51 and Dmc1 nucleoprotein homofilaments (green and red, respectively) form on adjacent segments of a single DSB-associated ssDNA tract. Each of these filaments is on the order o...
Figure images are served from the NIH/NLM PubMed Central Open Access Subset or Europe PMC; copyright remains with the publishers and authors.
💬 Discussion
0 commentsNo comments yet. Be the first to start a discussion!
Leave a Comment