Abstract
Some neural circuits operate with simple dynamics characterized by one or a few well-defined spatiotemporal scales (e.g. central pattern generators). In contrast, cortical neuronal networks often exhibit richer activity patterns in which all spatiotemporal scales are represented. Such "scale-free" cortical dynamics manifest as cascades of activity with cascade sizes that are distributed according to a power-law. Theory and in vitro experiments suggest that information transmission among cortical circuits is optimized by scale-free dynamics. In vivo tests of this hypothesis have been limited by experimental techniques with insufficient spatial coverage and resolution, i.e., restricted access to a wide range of scales. We overcame these limitations by using genetically encoded voltage imaging to track neural activity in layer 2/3 pyramidal cells across the cortex in mice. As mice recovered from anesthesia, we observed three changes: (a) cortical information capacity increased, (b) information transmission among cortical regions increased and (c) neural activity became scale-free. Our results demonstrate that both information capacity and information transmission are maximized in the awake state in cortical regions with scale-free network dynamics.
🔬 Techniques
✨ Fluorophores
🧪 Sample Preparation
🏭 Microscope Brands
📷 Detectors
💻 Software Details
🏛️ Research Organizations (ROR)
Affiliated research institutions:
📋 Methods
Animals
Two groups of mice were used. Group 1 consisted of three wild type mice, which were electroporated three times in utero (E14.5–E15.5) with the pCAG-voltage-sensitive fluorescent protein (VSFP) Butterfly 1.2 plasmid ( Akemann et al. 2012 , 2013 ), resulting in the expression of the Butterfly 1.2 VSFP in layer 2/3 pyramidal cells in one hemisphere. Experimental procedures for Group 1 were approved by the Institutional Animal Care and Use Committee of the RIKEN Wako Research Centre (Japan) and were conducted according to the US National Institutes of Health guidelines for animal research. Group 2 consisted of two triple transgenic (Ai78(TITL-VSFPB)-D; Camk2a-tTA; Rasgrf2-2A-dCre) mice that selectively expressed the Butterfly 1.2 VSFP in pyramidal neurons of cortical layer 2/3 in both hemispheres ( Madisen et al. 2015 ). All mice in Groups 1 and 2 (aged 2–6 months, either sex) were under surgical anesthesia for the entire cranial window implantation surgery as described previously ( Akemann et al. 2012 , 2013 ). In brief, a head post was implanted onto the thinned mouse skull and secured using a self-cure adhesive resin cement (Super-Bond C&B, Sun Medical, Japan). The thinned skull was reinforced by a cover glass using a cyanoacrylate adhesive (group 1) ( Drew et al. 2010 ) or a layer of Super-Bond C&B topped by a thin layer of clear nail polish (group 2) ( Sofroniew et al. 2015 ). The mice underwent voltage imaging after at least 48 hours recovery from surgery, being head-fixed via implanted head post in a custom-made stereotaxic frame, with body temperature controlled and maintained at 37 °C by means of a feedback-controlled heat pad (Fine Science Tools). Experimental procedures for Group 2 were performed in accordance with the UK Animal Scientific Procedures Act (1986) at Imperial College London under Home Office Personal and Project licenses following appropriate ethical review. Animals were experienced in recovering from anesthesia under the scope. At some point during this recovery, the animals went from a resting awake state to an active state, in which they have a drive to explore and walk. In the active state movement artifacts can occur, but these are easily recognized as positively correlated changes in the fluorescence recorded by the two cameras, as opposed to the negatively correlated optical signals that represent membrane voltage transients. However, in the present study only data obtained in the anesthetized and resting awake states were included in the analysis, minimizing the chance of movement artifacts. Voltage Imaging Group 1 was imaged after being re-anesthetized with pentobarbital sodium (40 mg/kg i.p.). Group 2 was imaged in a fully awake state, at least 48 hours after sedation. Image acquisition for both groups of mice was performed with a dual emission wide-field epifluorescence microscope equipped with two synchronized CCD cameras (Sensicam, PCO), using high-power halogen lamps (Moritex, BrainVision) and optics (Semrock). The voltage imaging signal was calculated as the ratio of mKate2 to mCitrine fluorescence, taken after offset subtraction and equalization of heartbeat-related modulation of fluorescence. Image sequences of 60s duration followed by 60s pauses were acquired at 50 Hz, with 320 × 240 pixel resolution ( Akemann et al. 2012 ). Data Preprocessing All data were baseline normalized on a pixel-wise level, i.e., each pixel's baseline is the average over its values, for each 60s image sequence. Each 60s dataset was temporally smoothed using a sliding window to average pixel activity across 4 consecutive time points and then spatially smoothed using an 8 × 8 pixel averaging filter. Data were then high-pass filtered at 0.5 Hz in order to reduce the effect of slow trends in the baseline signal that may cause artificial (i.e., non-neural) correlations ( Akemann et al. 2012 ). The first 10s of each image sequence were discarded to remove possible contribution from environmental cues present at the start of each imaging sequence (e.g., shutter noise and excitation light). Subsequent analyses were constrained to pixels within masks, drawn by hand for each mouse, which defined the extents of the bone window. We refined these masks by excluding regions with poor signal-to-noise ratios, defined as those pixels in which the protein expression (estimated as time-averaged absolute fluorescence intensity) was less than 50% of the maximum level across the field of view for each mouse. Imaging data were analyzed with Matlab using the Image and Signal Processing Toolboxes (Mathworks) and ImagePro 6.2 image processing software.
Show full methods section
Animals
Two groups of mice were used. Group 1 consisted of three wild type mice, which were electroporated three times in utero (E14.5–E15.5) with the pCAG-voltage-sensitive fluorescent protein (VSFP) Butterfly 1.2 plasmid ( Akemann et al. 2012 , 2013 ), resulting in the expression of the Butterfly 1.2 VSFP in layer 2/3 pyramidal cells in one hemisphere. Experimental procedures for Group 1 were approved by the Institutional Animal Care and Use Committee of the RIKEN Wako Research Centre (Japan) and were conducted according to the US National Institutes of Health guidelines for animal research. Group 2 consisted of two triple transgenic (Ai78(TITL-VSFPB)-D; Camk2a-tTA; Rasgrf2-2A-dCre) mice that selectively expressed the Butterfly 1.2 VSFP in pyramidal neurons of cortical layer 2/3 in both hemispheres ( Madisen et al. 2015 ). All mice in Groups 1 and 2 (aged 2–6 months, either sex) were under surgical anesthesia for the entire cranial window implantation surgery as described previously ( Akemann et al. 2012 , 2013 ). In brief, a head post was implanted onto the thinned mouse skull and secured using a self-cure adhesive resin cement (Super-Bond C&B, Sun Medical, Japan). The thinned skull was reinforced by a cover glass using a cyanoacrylate adhesive (group 1) ( Drew et al. 2010 ) or a layer of Super-Bond C&B topped by a thin layer of clear nail polish (group 2) ( Sofroniew et al. 2015 ). The mice underwent voltage imaging after at least 48 hours recovery from surgery, being head-fixed via implanted head post in a custom-made stereotaxic frame, with body temperature controlled and maintained at 37 °C by means of a feedback-controlled heat pad (Fine Science Tools). Experimental procedures for Group 2 were performed in accordance with the UK Animal Scientific Procedures Act (1986) at Imperial College London under Home Office Personal and Project licenses following appropriate ethical review. Animals were experienced in recovering from anesthesia under the scope. At some point during this recovery, the animals went from a resting awake state to an active state, in which they have a drive to explore and walk. In the active state movement artifacts can occur, but these are easily recognized as positively correlated changes in the fluorescence recorded by the two cameras, as opposed to the negatively correlated optical signals that represent membrane voltage transients. However, in the present study only data obtained in the anesthetized and resting awake states were included in the analysis, minimizing the chance of movement artifacts. Voltage Imaging Group 1 was imaged after being re-anesthetized with pentobarbital sodium (40 mg/kg i.p.). Group 2 was imaged in a fully awake state, at least 48 hours after sedation. Image acquisition for both groups of mice was performed with a dual emission wide-field epifluorescence microscope equipped with two synchronized CCD cameras (Sensicam, PCO), using high-power halogen lamps (Moritex, BrainVision) and optics (Semrock). The voltage imaging signal was calculated as the ratio of mKate2 to mCitrine fluorescence, taken after offset subtraction and equalization of heartbeat-related modulation of fluorescence. Image sequences of 60s duration followed by 60s pauses were acquired at 50 Hz, with 320 × 240 pixel resolution ( Akemann et al. 2012 ). Data Preprocessing All data were baseline normalized on a pixel-wise level, i.e., each pixel's baseline is the average over its values, for each 60s image sequence. Each 60s dataset was temporally smoothed using a sliding window to average pixel activity across 4 consecutive time points and then spatially smoothed using an 8 × 8 pixel averaging filter. Data were then high-pass filtered at 0.5 Hz in order to reduce the effect of slow trends in the baseline signal that may cause artificial (i.e., non-neural) correlations ( Akemann et al. 2012 ). The first 10s of each image sequence were discarded to remove possible contribution from environmental cues present at the start of each imaging sequence (e.g., shutter noise and excitation light). Subsequent analyses were constrained to pixels within masks, drawn by hand for each mouse, which defined the extents of the bone window. We refined these masks by excluding regions with poor signal-to-noise ratios, defined as those pixels in which the protein expression (estimated as time-averaged absolute fluorescence intensity) was less than 50% of the maximum level across the field of view for each mouse. Imaging data were analyzed with Matlab using the Image and Signal Processing Toolboxes (Mathworks) and ImagePro 6.2 image processing software.
Noise Datasets
We generated noise on a pixel-wise level with the same power spectrum as the ratio image data. These noise datasets were then passed through the same preprocessing pipeline as the experimental data. By showing null results for these noise data, we eliminate the possibility that the preprocessing pipeline and/or changes in the power spectrum are responsible for the relationships observed.
Cascade Detection and Statistics
Cascades were detected as spatiotemporally contiguous clusters of active pixels ( Tagliazucchi et al. 2012 ; Scott et al. 2014 ). Cascade detection was performed both across the entire image and also for regional subdivisions of the image. A pixel was defined as “active” at times when the voltage signal crossed above a threshold of +1 S.D. from below. A positive threshold was chosen as positive deflections of our optical signals indicate population depolarization ( Akemann et al. 2012 ). Cascade detection results were previously tested for robustness between +0.5 and +1.5 S.D. ( Scott et al. 2014 ). The cumulative event count at +1 S.D. for the entire recording area across all mice was 240 ± 12 per mouse per second. Clusters of active pixels were identified based on detection of connected pixels in a coactive first neighbors graph. Cascades were then defined as starting with the activation of a previously inactive cluster and continuing while at least one contiguous cluster was active in the next time point. We defined the size of a cascade (z) as the number of active pixels comprising the cascade. The shape of the cascade size distribution changed systematically as animals awoke from anesthesia. In the awake resting state, the distribution was close to a power-law with exponent −1.5. To parameterize these changes, cascade size probability distributions were compared to a power law with exponent −1.5 using a measure κ ( Shew et al. 2009 ; Yang et al. 2012 ). Thus, we do not interpret κ as a statistical test confirming a power-law distribution. Rather, κ is a measure of deviation from a power-law. In brief, to compute κ for one dataset, one first obtains a cumulative probability distribution function (CDF) of cascade sizes. Second, the distance between the observed CDF and a reference CDF is calculated at 10 equally spaced points, where the reference is a perfect power law with exponent −1.5 and κ is defined as 1 plus the average of the 10 differences. Our choice to use a reference power-law with an exponent of −1.5 in the calculation of κ was based both on theory ( Larremore et al. 2012 ) as well as our previous work ( Scott et al. 2014 ). However, one potential limitation of the κ metric is that cascade sizes could be distributed according to a power-law with an exponent other than −1.5, which would result in κ deviating from unity. k-means Clustering In order to assess the repertoire of cortical brain states we applied a k-means clustering algorithm to the point-process data from the entire imaged area to produce a time course of cortical states. Prior to clustering, image sequences were spatially downsampled by a factor of 2 using interpolation with a box-shaped kernel, in order to reduce computational demands. We performed clustering separately on each 50s image sequence in order to eliminate bias in the clustering algorithm due to varying proportions of data from different brain states. The analyses were repeated with k = 10,50,200 clusters. For each resulting state time course, we quantified the repertoire of states by calculating the state visitation entropy (H state ) of the probability distribution p i as follows: 1 H s t a t e = − ∑ i = 1 k p i l o g 2 p i where p i is the probability of the system being observed in state i , for i = 1,2,…, k . The probabilities used to calculate state visitation entropy are calculated separately for each 50s window. Using the state time courses, a first-order Markov model was used to create a state transition probability distribution of moving from state i to state j , where i,j = 1,2,…, k . The state transition entropy H trans was then calculated using [ 1 ]. Regional Entropy and Mutual Information The point-process image sequences were divided into 8 × 8 pixel regions. An event was defined at each time point for each region with 1 bit per pixel. A bit was set to 1 if the corresponding pixel was active during the event and 0 otherwise. The entropy of this set of patterns was calculated for each region using [ 1 ]. The information transmission for a given region was defined as the sum of its mutual information (MI) with all other regions ( Cover and Thomas 2012 ). The presence of mutual information between disparate regions of the cortex should be regarded as a somewhat generalized form of “correlation”, indicating encoding overlapping information content without shedding light on the neuronal code or the mechanism of information transport. MI is by definition a nonnegative quantity. As such, for finite size samples, even independent random variables will have positive MI, rendering interpretation difficult. To account for this, we adopt an approach similar to that used for “adjusted mutual information” and subtract from our MI measurements a control value of MI ( Vinh et al. 2010 ). We calculate the control MI as above, but with a randomized order of states for one of the variables ( Margolin et al. 2006 ). The control MI has values near zero (and can take negative values) for insignificant levels of MI and is positive for significant levels of MI. We exclude values of MI calculated between pairs of regions that are closer to one another than 10% of the maximum extent of the imaged cortex. This is to reduce the possibility of spurious correlations arising due to spatial smoothing operations in the preprocessing pipeline. Regional information capacity and transmission were also calculated for different spatial extents, spatial resolutions and time steps: (a) 5 × 5 square regions, (b) 8 × 8 square regions, (c) half spatial resolution data and (d) half temporal resolution data. We use these different spatiotemporal definitions in order to demonstrate that the results are not dependent on a particular combination of analysis parameters.
Supplementary Material Supplementary material can be found at: http://www.cercor.oxfordjournals.org /.
Supplementary Material Supplementary Data Click here for additional data file.
📊 Figures
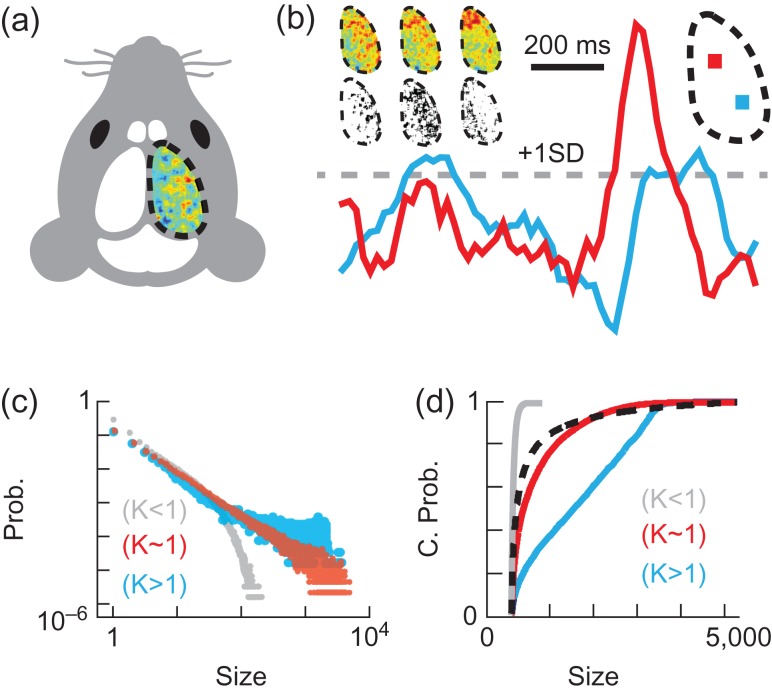
Figure 1.
Experimental setup and data analysis. ( a ) Voltage map for 20 ms over one cortical hemisphere in a head-fixed mouse with trans-cranial window. ( b ) Voltage traces from two pixels (each covering a 33...
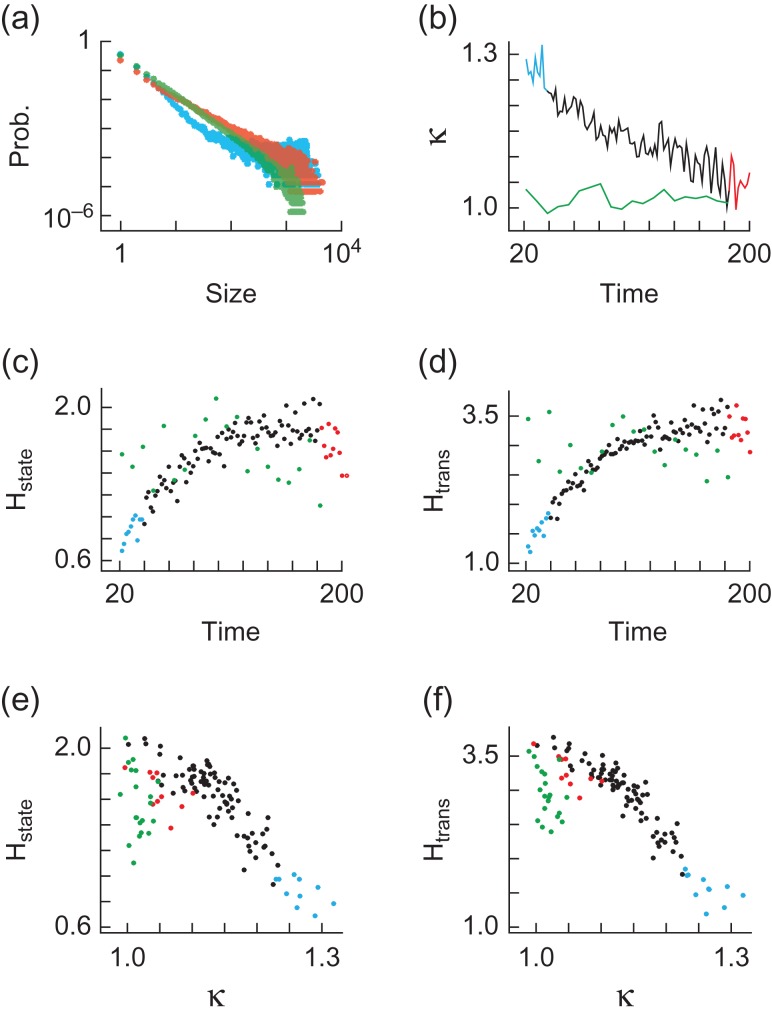
Figure 2.
Cortex-wide dynamics with recovery from anesthesia. ( a ) Cascade size (pixels) probability distributions are shown for anesthetized (blue) and awake (red) states from mouse A1 and fully awake results...
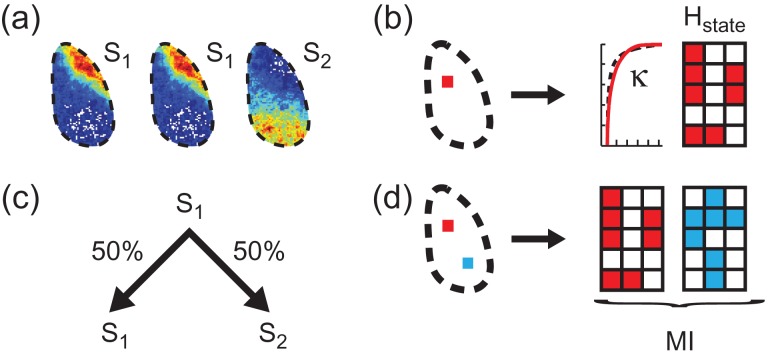
Figure 3.
State analysis, u03ba, entropy and mutual information. ( a ) Three voltage images are assigned state labels S 1 and S 2 according to a k-means clustering algorithm. ( b ) Toy model showing a sequence ...
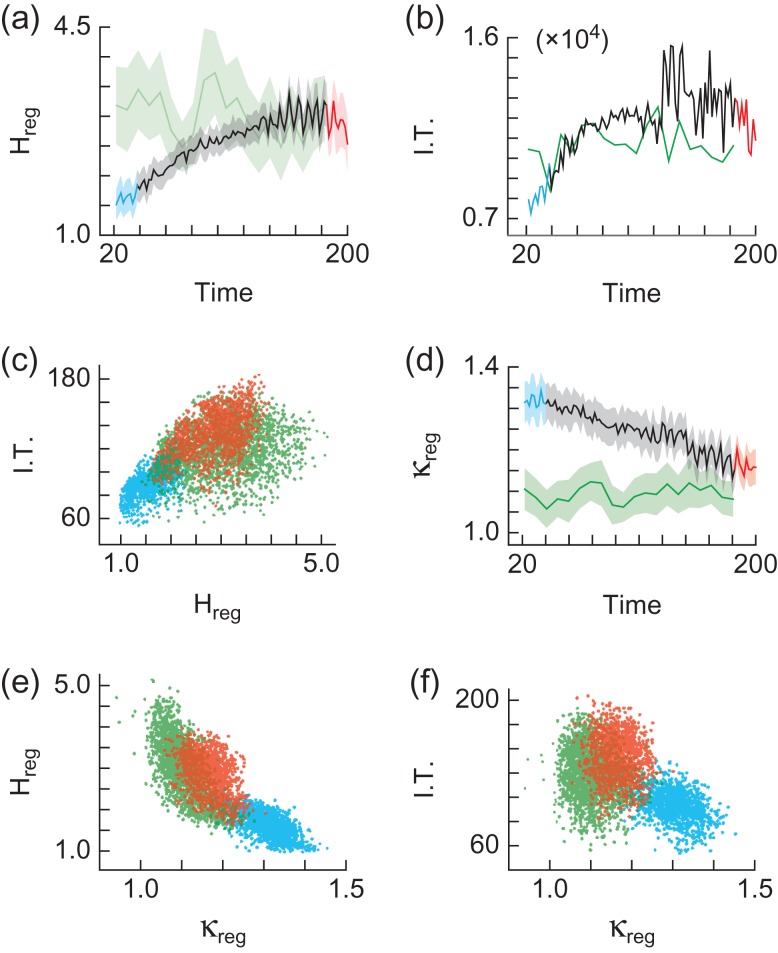
Figure 4.
Regional information transmission with recovery from anesthesia. ( a ) Regional entropy H reg (bits) vs. time (minutes) since drug delivery. Shaded region represents standard deviation. Color coding a...
Figure images are served from the NIH/NLM PubMed Central Open Access Subset or Europe PMC; copyright remains with the publishers and authors.
💬 Discussion
0 commentsNo comments yet. Be the first to start a discussion!
Leave a Comment