Abstract
AbstractThe microscopic viscosity plays an essential role in cellular biophysics by controlling the rates of diffusion and bimolecular reactions within the cell interior. While several approaches have emerged that have allowed the measurement of viscosity and diffusion on a single cell level in vitro, the in vivo viscosity monitoring has not yet been realized. Here we report the use of fluorescent molecular rotors in combination with Fluorescence Lifetime Imaging Microscopy (FLIM) to image microscopic viscosity in vivo, both on a single cell level and in connecting tissues of subcutaneous tumors in mice. We find that viscosities recorded from single tumor cells in vivo correlate well with the in vitro values from the same cancer cell line. Importantly, our new method allows both imaging and dynamic monitoring of viscosity changes in real time in live animals and thus it is particularly suitable for diagnostics and monitoring of the progress of treatments that might be accompanied by changes in microscopic viscosity.
🔬 Techniques
💻 Software
✨ Fluorophores
🧪 Sample Preparation
🔬 Cell Lines
🧪 Reagent Suppliers
🔴 Lasers
🎨 Filters
💻 Software Details
🏛️ Research Organizations (ROR)
Affiliated research institutions:
📋 Methods
General BODIPY1 32 , BODIPY2 29 and polymeric brushes 36 were synthesised as reported previously. All solvents used for spectroscopic characterisation of rotors were spectroscopic grade. Quartz cuvettes with a 10 mm path length were used in all spectroscopic measurements. The concentration of BODIPY dyes was adjusted to the maximum absorbance of below 0.1 for all spectroscopic measurements to avoid reabsorption artefacts. Absorption spectra were measured using an Agilent 8453 UV-Vis spectrophotometer. Fluorescence spectra were recorded using a Fluoromax-4 spectrofluorometer (Jobin-Yvon; Horiba). The fluorescence decay traces in bulk samples were collected using a DeltaFlex Time-Correlated Single Photon Counting system (Horiba). The samples were excited at 467 nm using a pulsed NanoLED excitation source (IRF ca. 300 ps). Fluorescence was collected at 513 ± 10 nm. Decays were recorded until peak counts reached 10000 at a controlled temperature using a thermostatic circulating chiller (RE104, Lauda Technology Ltd.). Data were fitted to the appropriate exponential model after deconvolution of the instrument response function by an iterative deconvolution technique, using the IBH DAS6 fluorescence decay analysis software, where reduced (χ 2 ) and weighted residuals serve as parameters for goodness of the fit.
Cell culture
CT26 (murine colon carcinoma) cell line was used in the study. The cells were cultured in DMEM containing 100 μg/ml penicillin, 100 μg/ml streptomycin sulfate and 10% fetal bovine serum (FBS) at 37 °C in a humidified atmosphere with 5% CO 2 . For microscopic imaging the cells were seeded on glass-bottom FluoroDishes in complete DMEM media without phenol red (Life Technologies). Before imaging, the culture media was replaced with ice-cold Hank’s solution without Ca 2+ /Mg 2+ , and cells were incubated at + 4 °C for 7 min. Afterwards, Hank’s solution was replaced with ice-cold BODIPY solution (4.5 μM, 0.1% DMSO). The cells treated in a similar manner but without BODIPY, served as control. We performed MTT assays of all probes at the working conditions used in this manuscript and we find no evidence of toxicity, Figure S7 . The viability of cultured cells exposed to polymeric brushes was previously evaluated in 52 and high cell viability was confirmed.
Show full methods section
General BODIPY1 32 , BODIPY2 29 and polymeric brushes 36 were synthesised as reported previously. All solvents used for spectroscopic characterisation of rotors were spectroscopic grade. Quartz cuvettes with a 10 mm path length were used in all spectroscopic measurements. The concentration of BODIPY dyes was adjusted to the maximum absorbance of below 0.1 for all spectroscopic measurements to avoid reabsorption artefacts. Absorption spectra were measured using an Agilent 8453 UV-Vis spectrophotometer. Fluorescence spectra were recorded using a Fluoromax-4 spectrofluorometer (Jobin-Yvon; Horiba). The fluorescence decay traces in bulk samples were collected using a DeltaFlex Time-Correlated Single Photon Counting system (Horiba). The samples were excited at 467 nm using a pulsed NanoLED excitation source (IRF ca. 300 ps). Fluorescence was collected at 513 ± 10 nm. Decays were recorded until peak counts reached 10000 at a controlled temperature using a thermostatic circulating chiller (RE104, Lauda Technology Ltd.). Data were fitted to the appropriate exponential model after deconvolution of the instrument response function by an iterative deconvolution technique, using the IBH DAS6 fluorescence decay analysis software, where reduced (χ 2 ) and weighted residuals serve as parameters for goodness of the fit.
Cell culture
CT26 (murine colon carcinoma) cell line was used in the study. The cells were cultured in DMEM containing 100 μg/ml penicillin, 100 μg/ml streptomycin sulfate and 10% fetal bovine serum (FBS) at 37 °C in a humidified atmosphere with 5% CO 2 . For microscopic imaging the cells were seeded on glass-bottom FluoroDishes in complete DMEM media without phenol red (Life Technologies). Before imaging, the culture media was replaced with ice-cold Hank’s solution without Ca 2+ /Mg 2+ , and cells were incubated at + 4 °C for 7 min. Afterwards, Hank’s solution was replaced with ice-cold BODIPY solution (4.5 μM, 0.1% DMSO). The cells treated in a similar manner but without BODIPY, served as control. We performed MTT assays of all probes at the working conditions used in this manuscript and we find no evidence of toxicity, Figure S7 . The viability of cultured cells exposed to polymeric brushes was previously evaluated in 52 and high cell viability was confirmed.
Collagen gel preparation
In order to prepare three-dimensional collagen gel phantoms, 133 μL of 0.34 M sterile solution of sodium hydroxide was mixed with 200 μL concentrated (x10) culture medium 199, 8 μL glutamine, 70 μL 7.5% sodium bicarbonate and 40 μL HEPES. A cooled solution of type I collagen was added to this medium, and the mixture was placed on ice to prevent rapid gelation. At this stage a cell suspension of human skin fibroblasts was introduced into the mixture (20 000 cells per 1 mL). The resulting mixture was placed in glass-bottom FluoroDishes, and DMEM medium containing 100 μg/ml penicillin, 100 μg/ml streptomycin sulfate and 10% fetal bovine serum (FBS) was added and kept at 37 °C in a humidified atmosphere with 5% CO 2 . FLIM imaging of the cellularized collagen gel was performed after 3 days. To measure viscosity of collagen, BODIPY solutions were added at a concentration of 45 μM, containing 0.5% DMSO. For better penetration of the rotors into the gel matrix, glass dishes were placed in a shaker for 3 hours at 22 °C before a microscopic investigation. To confirm the presence of collagen fibers, the second harmonic generation (SHG) signal was registered. Mice Female BALB/c mice 10 weeks old, weighing 20–25 g were used. To generate tumors, the animals were challenged subcutaneously with 5 × 10 5 CT26 (mouse colon carcinoma) cells in 100 μL PBS in the right flank. The experiments started 10–12 days after the cell injection, when the tumors had reached 7–8 mm in diameter. All experimental procedures conducted on animals were approved by the Ethical Committee of the Nizhny Novgorod State Medical Academy (Russia). All methods were carried out in accordance with relevant guidelines and regulations. BODIPY1 and BODIPY2 were injected intravenously into the tail vain in doses 2–10 mg/kg. Tumor-bearing mice that did not receive BODIPY were used as controls. For imaging, animals were anesthetized with intramuscular injection of a mixture of Zoletil 100 (50 μL per animal, 40 mg/kg, Virbac SA, Carros, France) and 2% Rometar (10 μL per animal, 10 mg/kg, Spofa, Czech Republic).
Fluorescence whole-body imaging
A molecular imaging system IVIS-Spectrum (Caliper Life Sciences, USA) was used for fluorescence whole-body imaging. Fluorescence of rotors was excited at a wavelength of 500/30 nm and detected at 540/20 nm. The images were acquired in vivo before the injection of rotor, after 15 min, 1, 2, 5 or 6 h, and 24 h. For imaging procedure, animals were anesthetized with 2% Isoflurane. The average fluorescence intensity (FI), (p/s/cm 2 /sr)/(μW/cm 2 ), of each tumor was calculated at different time-points in Living Image 2.5 software, and corresponding value measured before the injection was subtracted. Biodistribution study To analyze distribution of rotor in the animal body, fluorescence imaging ex vivo was performed. 24 hours after injection mice were sacrificed by cervical dislocation, tumor nodules and organs were immediately excised, washed with PBS and the fluorescence images were acquired on the IVIS-Spectrum system, as described above, and on the multiphoton tomograph MPTflex (JenLab, Germany). The average fluorescence intensity of tumor nodules and organs ex vivo was quantified from macroscopic images and normalized to corresponding values of the ones from CT26 bearing mice without any treatment.
Plasma concentration analysis
To measure plasma drug level, BODIPY1 and BODIPY2 were injected intravenously to mice with CT26 tumor at the dose of 5 mg/kg and 10 mg/kg, respectively. Blood (20 μl) was collected from the retro-orbital sinus with a heparinized capillary tube after 5 min, l h, 2 h or 3 h, 4 h or 5 h, 6 h, 24 h and 48 h and centrifuged at 2500 rpm for 15 min to prepare plasma. Then 10 μL of the plasma was sampled, and dissolved in 2 mL of sterile saline. BODIPY fluorescence was analyzed by spectrofluorometry (Shimadzu RF-5301PC) (excitation at 475 nm, emission was scanned from 550–680 nm). The quantity of the rotors was determined by comparison of the relative fluorescence intensities at the wavelength of 510 nm with the calibration curves. To construct calibration curves, a known amount of the BODIPY was added in sterile saline.
Multiphoton fluorescence microscopy and FLIM
Multiphoton tomograph MPTflex (JenLab, Germany) equipped with a tuneable 80 MHz, 200 fs Ti:Sapphire laser (MaiTai) and a TCSPC-based FLIM module (Becker&Hickl Inc., Germany) was used for multiphoton fluorescence microscopy and FLIM. The images were acquired through a 40x, 1.3 NA oil immersion objective. BODIPY fluorescence was excited at the wavelength of 800 nm and detected in the range 409–680 nm. Autofluorescence in cells was excited at the wavelength of 750 nm and detected in the range 409–680 nm. SHG in collagen was exited at 750 nm and detected from 373 to 387 nm. The average power applied to the sample was ~ 12 mW. Image size was 512 × 512 pixels, and the acquisition time for one optical section was typically 7 seconds. Two-photon excited (TPE) fluorescence and FLIM images of cultured CT26 cells were acquired within 5–10 min after adding BODIPY dyes. For imaging, a skin flap over the tumor was surgically opened and the objective was placed directly on the tumor surface. TPE fluorescence, SHG and FLIM images were acquired every 20 min for 1.5 hours after an injection of BODIPYs and then again in 24 hours. Immediately after the imaging procedure, the skin flap was closed with 2–0 surgical suture.
Fluorescence lifetime analysis
Fluorescence lifetime analysis was performed in the SPCImage software (Becker&Hickl Inc., Germany). Autofluorescence was shown to contribute insignificantly to the signal at 800 nm excitation. Time resolved fluorescence decays at each pixel of the whole image was fitted using a monoexponential model, and the fluorophore lifetime τ was calculated. The fluorescence lifetime distribution and the goodness of fit (χ 2 ) histograms were analysed for each FLIM image. The χ 2 ≤ 1.20 value for in vitro images and χ 2 ≤ 1.40 for in vivo images indicated that the model used provided a reasonable fit. The viscosity was correlated to the decay traces using the modified form of the Förster–Hoffmann equation in the logarithmic form: log τf = α log η + const. Using previously measured calibration plots for BODIPY1 and BODIPY2 17 experimentally measured lifetimes (in ns) were converted to viscosity values (in cP).
Statistical analysis
The mean values (M) and standard deviations (SD) were calculated for the long and short components of fluorescence lifetimes of BODIPY. The number of cells for mean value calculations was 20–30 in 7–10 fields of view.
📊 Figures
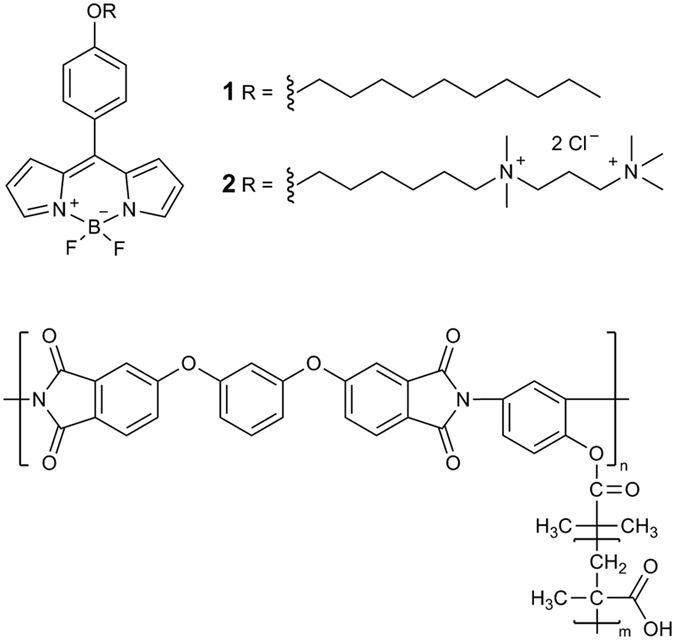
Figure 1
The molecular structures of molecular rotors BODIPY1, BODIPY2 and a polymeric brush used for solubilisation of BODIPY1.
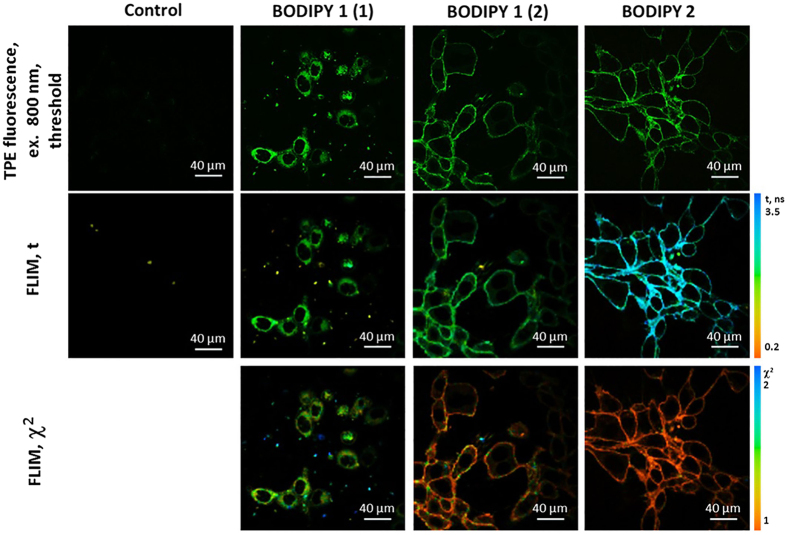
Figure 2
Two-photon excited (TPE) fluorescence and FLIM images of CT26 cells incubated with 4.5u2009u03bcM solutions of BODIPY1 and BODIPY2.
BODIPY1 was dissolved in high and low concentration of polymeric brushes (2 and 12.4u2009mg/ml, corresponding to labels (1) and (2), respectively). BODIPY2 was dissolved in PBS. Excitation was 800u200...
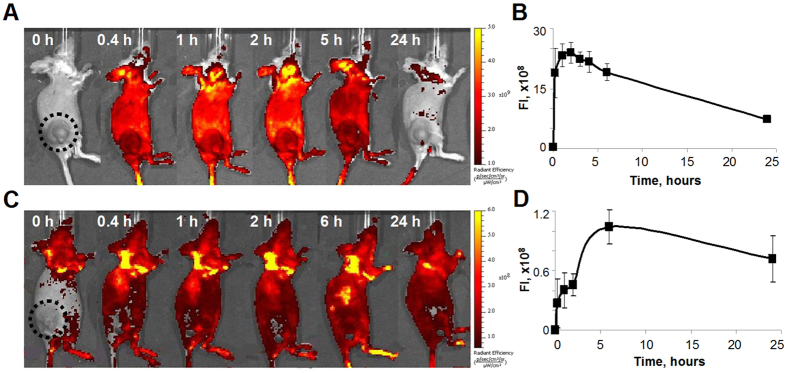
Figure 3
Monitoring the accumulation of molecular rotors BODIPY1 and BODIPY2 in CT26 tumor in vivo .
Fluorescence images of mice ( A , C ) and kinetics of fluorescence in tumors ( B , D ) after injection of BODIPY2 at 10u2009mg/kg ( A , B ) or BODIPY1 at 5u2009mg/kg dissolved in polymeric brushes (at...
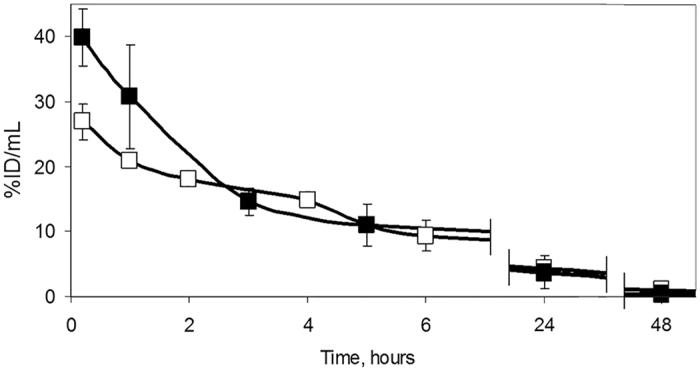
Figure 4
Time course of concentrations of BODIPY2 (u25a0), at 10u2009mg/kg, and BODIPY1 at 5u2009mg/kg, dissolved in polymeric brushes (at 12u2009mg/kg) (u25a1), expressed as percentage of injected dose per mL of plasma after intravenous injection into Balb/c mice with the subcutaneous CT26 tumor.
Meanu2009u00b1u2009SD, nu2009=u20094 mice per group.
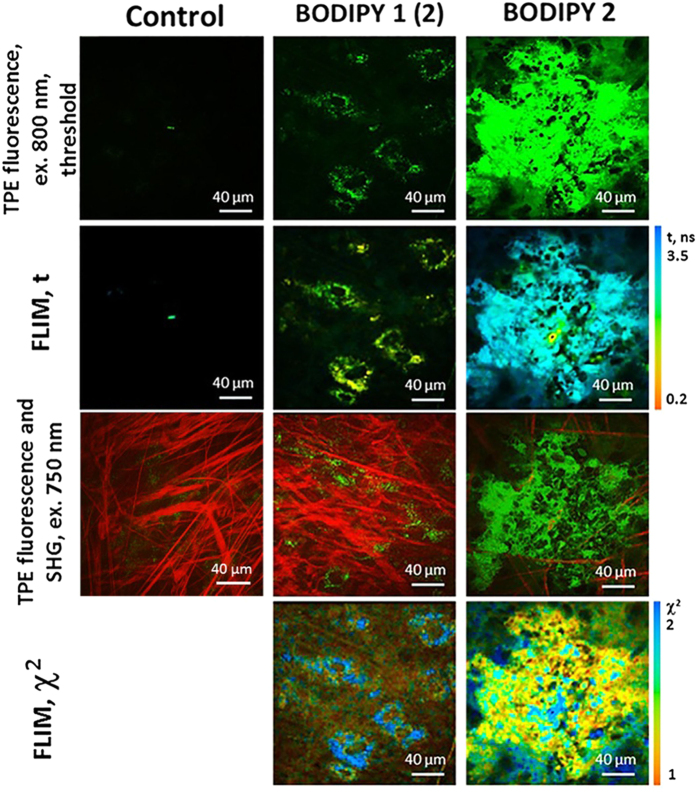
Figure 5
Representative in vivo two-photon excited (TPE) fluorescence and FLIM images of CT26 tumor at 40u2009min after an i.v. injection of BODIPY1 dissolved in polymeric brushes (3u2009mg/kg BODIPY1 in 8u2009mg/kg brushes) and at 60u2009min after an i.v. injection of BODIPY2 (3u2009mg/kg).
Excitation was 800u2009nm, detection 409u2013680u2009nm. The contribution from autofluorescence was low following 800u2009nm excitation. The second-harmonic generation (SHG) signal from connective tis...
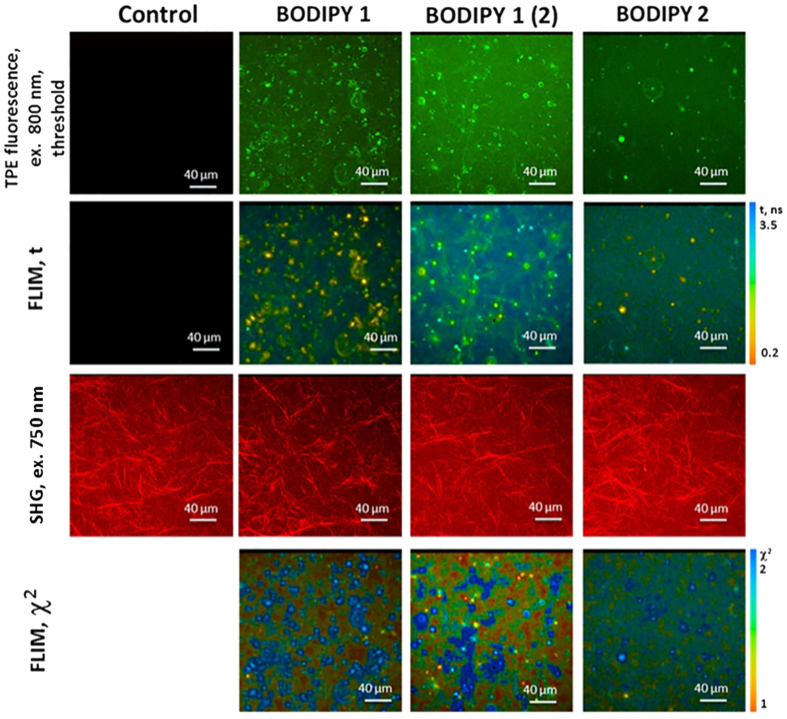
Figure 6
Two photon excited (TPE) fluorescence and FLIM images of cellularized collagen fibres incubated with 45u2009u03bcM solutions of BODIPY1 (0.5% DMSO), BODIPY1 with polymer brushes (12.4u2009mg/ml, label (2)) and BODIPY2.
Images were recorded using 800u2009nm excitation and 409u2013680u2009nm detection. Control collagen without the addition of BODIPY imaged at identical conditions is also shown in the first column. SHG...
Figure images are served from the NIH/NLM PubMed Central Open Access Subset or Europe PMC; copyright remains with the publishers and authors.
💬 Discussion
0 commentsNo comments yet. Be the first to start a discussion!
Leave a Comment