Abstract
To measure nanometric features with super-resolution requires that the stage, which holds the sample, be stable to nanometric precision. Herein we introduce a new method that uses conventional equipment, is low cost, and does not require intensive computation. Fiduciary markers of approximately 1 µm x 1 µm x 1 µm in x, y, and z dimensions are placed at regular intervals on the coverslip. These fiduciary markers are easy to put down, are completely stationary with respect to the coverslip, are bio-compatible, and do not interfere with fluorescence or intensity measurements. As the coverslip undergoes drift (or is purposely moved), the x-y center of the fiduciary markers can be readily tracked to 1 nanometer using a Gaussian fit. By focusing the light slightly out-of-focus, the z-axis can also be tracked to < 5 nm for dry samples and <17 nm for wet samples by looking at the diffraction rings. The process of tracking the fiduciary markers does not interfere with visible fluorescence because an infrared light emitting diode (IR-LED) (690 and 850 nm) is used, and the IR-light is separately detected using an inexpensive camera. The resulting motion of the coverslip can then be corrected for, either after-the-fact, or by using active stabilizers, to correct for the motion. We applied this method to watch kinesin walking with ≈ 8 nm steps.
🔬 Techniques
💻 Software
🧪 Sample Preparation
🏭 Microscope Brands
🧪 Reagent Suppliers
🔴 Lasers
💻 Software Details
🏛️ Research Organizations (ROR)
Affiliated research institutions:
📊 Figures
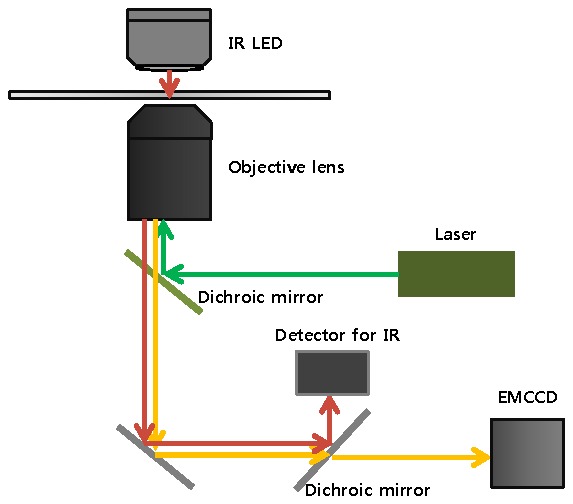
Fig. 1
The optical configuration to track the fiduciary markers using IR scattering with the Total Internal Reflection Fluorescence.
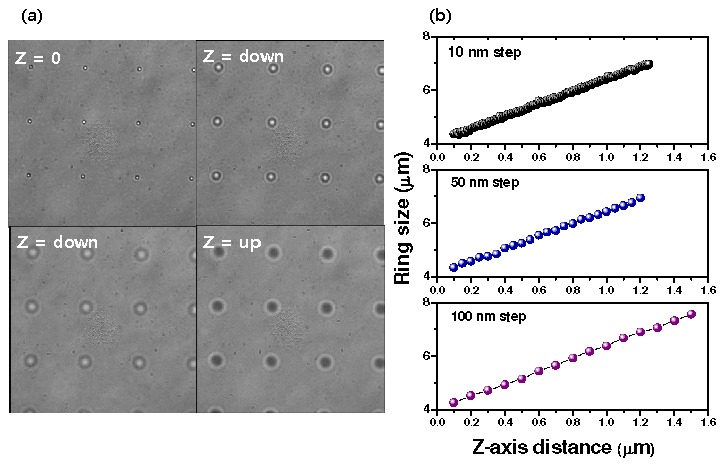
Fig. 2
(a) IR scattering image for fiduciary markers at different position along the z axis. (Down and up means below and above focal point) Pillars place every 16 u03bcm. (b) Plots for calibration the relat...
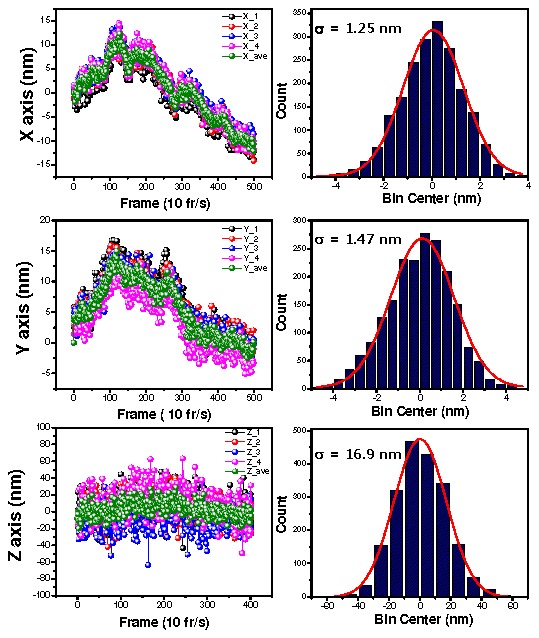
Fig. 3
Traces and histograms along x (top), y (middle) and z (bottom) for fiduciary markers. In traces (left panel), green traces are the averaged for traces of four fiduciary markers which are taken for 1 m...
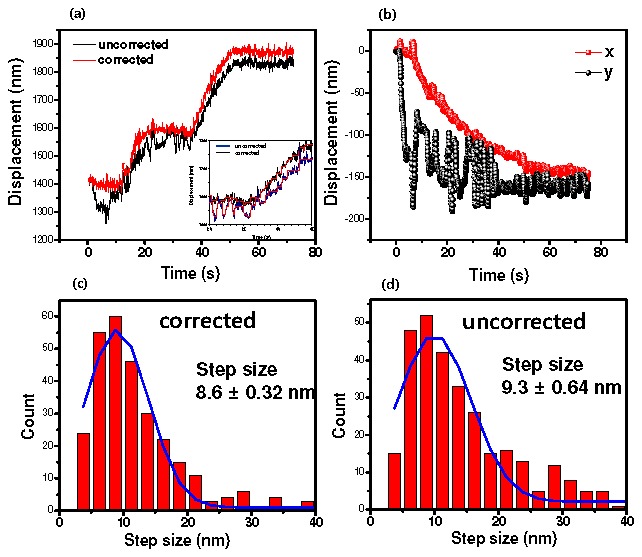
Fig. 4
(a) Traces of kinesin walking. Inset is the zoom in trace. Red line of inset represents the fitting line. (b) traces of the stage drift which is the averaged traces for four fiduciary markers. In case...
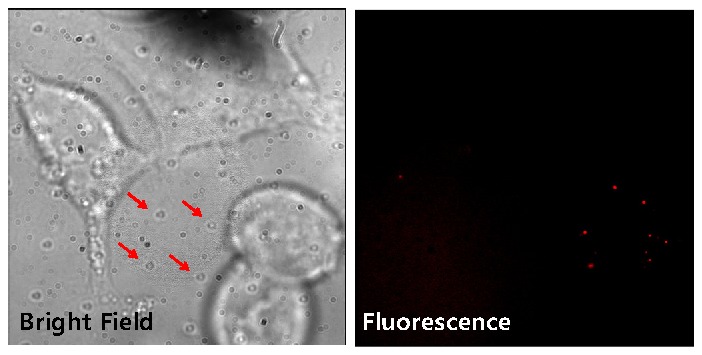
Fig. 5
Bright field (left) and fluorescence (right) images of the HEK cells cultured on the fiduciary-marked coverslip with quantum dots (605 nm emission; Invitrogen) labeling. In the bright-field image, the...
Figure images are served from the NIH/NLM PubMed Central Open Access Subset or Europe PMC; copyright remains with the publishers and authors.
💬 Discussion
0 commentsNo comments yet. Be the first to start a discussion!
Leave a Comment