Abstract
In this perspective, we discuss how the nonlinear optical technique of second-harmonic generation (SHG) microscopy has been used to greatly enhance our understanding of the tumor microenvironment (TME) of breast and ovarian cancer. Striking changes in collagen architecture are associated with these epithelial cancers, and SHG can image these changes with great sensitivity and specificity with submicrometer resolution. This information has not historically been exploited by pathologists but has the potential to enhance diagnostic and prognostic capabilities. We summarize the utility of image processing tools that analyze fiber morphology in SHG images of breast and ovarian cancer in human tissues and animal models. We also describe methods that exploit the SHG physical underpinnings that are effective in delineating normal and malignant tissues. First we describe the use of polarization-resolved SHG that yields metrics related to macromolecular and supramolecular structures. The coherence and corresponding phase-matching process of SHG results in emission directionality (forward to backward), which is related to sub-resolution fibrillar assembly. These analyses are more general and more broadly applicable than purely morphology-based analyses; however, they are more computationally intensive. Intravital imaging techniques are also emerging that incorporate all of these quantitative analyses. Now, all these techniques can be coupled with rapidly advancing miniaturization of imaging systems to afford their use in clinical situations including enhancing pathology analysis and also in assisting in real-time surgical determination of tumor margins.
🔬 Techniques
✨ Fluorophores
🧪 Sample Preparation
🔬 Cell Lines
🏭 Microscope Brands
🏛️ Research Organizations (ROR)
Affiliated research institutions:
📊 Figures
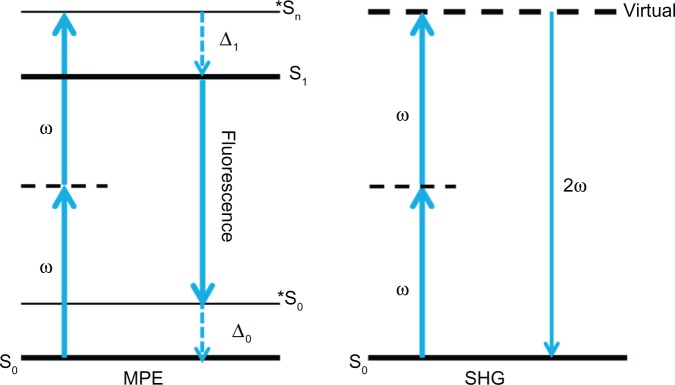
Figure 1
Jablonski energy diagram for MPE and SHG. Energy lost in MPE is signified by u2206 1 and u2206 0 . S 0 is the ground state; *S 0 is the vibrationally excited state S 0 state; S 1 is the lowest singlet...
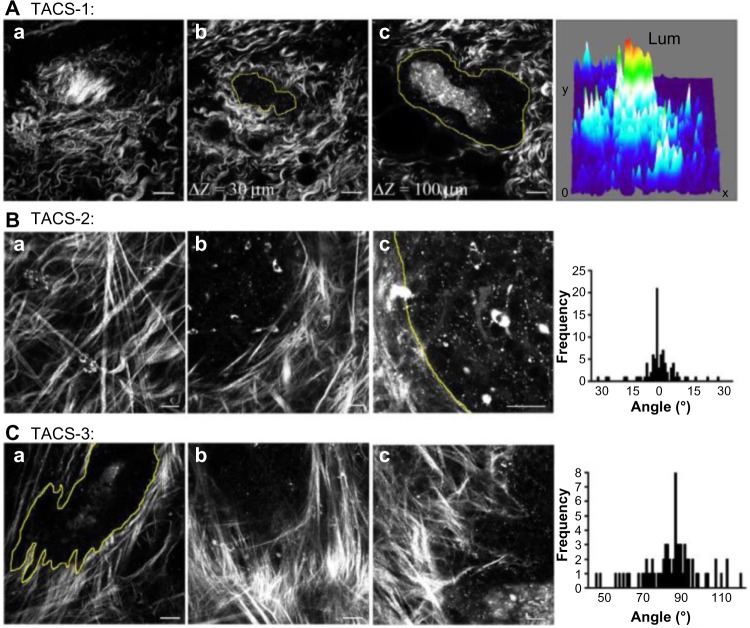
Figure 2
TACS collagen fiber alignment characterization of the MMTV-PyMT breast cancer model accurately characterizes disease progression using SHG microscopy. Adapted from Ref. 37 (courtesy of Patricia Keely)...
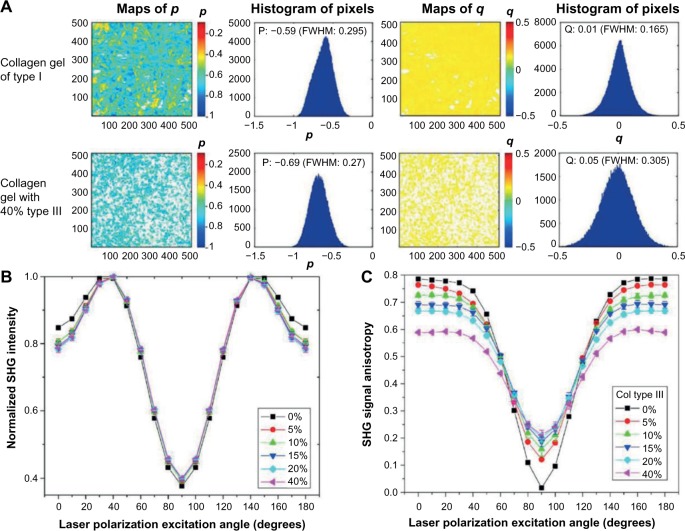
Figure 3
Polarization-resolved microscopy of collagen types I and III. ( A ) Pixel maps of the p and q values used to minimize the error of dipoles not well aligned within the PSF. ( B ) Simulated SHG intensit...
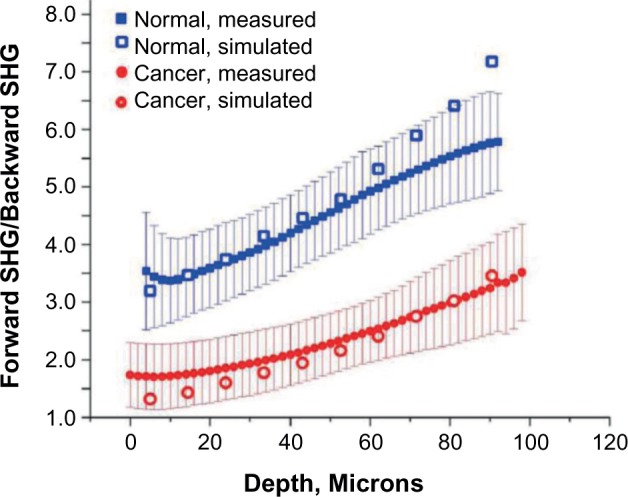
Figure 4
Depth-dependent SHG F / B measurements of normal and high-grade serous ovarian cancer. Best fits using Monte Carlo simulations and independently measured u03bc s and g resulted in 93% and 77% forward-...
Figure images are served from the NIH/NLM PubMed Central Open Access Subset or Europe PMC; copyright remains with the publishers and authors.
💬 Discussion
0 commentsNo comments yet. Be the first to start a discussion!
Leave a Comment