Abstract
BACKGROUND: Critical advances in the investigation of brain functions and treatment of brain disorders are hindered by our inability to selectively target neurons in a noninvasive manner in the deep brain. OBJECTIVE: This study aimed to develop sonothermogenetics for noninvasive, deep-penetrating, and cell-type-specific neuromodulation by combining a thermosensitive ion channel TRPV1 with focused ultrasound (FUS)-induced brief, non-noxious thermal effect. METHODS: The sensitivity of TRPV1 to FUS sonication was evaluated in vitro. It was followed by in vivo assessment of sonothermogenetics in the activation of genetically defined neurons in the mouse brain by two-photon calcium imaging. Behavioral response evoked by sonothermogenetic stimulation at a deep brain target was recorded in freely moving mice. Immunohistochemistry staining of ex vivo brain slices was performed to evaluate the safety of FUS sonication. RESULTS: TRPV1 was found to be an ultrasound-sensitive ion channel. FUS sonication at the mouse brain in vivo selectively activated neurons that were genetically modified to express TRPV1. Temporally precise activation of TRPV1-expressing neurons was achieved with its success rate linearly correlated with the peak temperature within the FUS-targeted brain region as measured by in vivo magnetic resonance thermometry. FUS stimulation of TRPV1-expressing neurons at the striatum repeatedly evoked locomotor behavior in freely moving mice. FUS sonication was confirmed to be safe based on inspection of neuronal integrity, inflammation, and apoptosis markers. CONCLUSIONS: This noninvasive and cell-type-specific neuromodulation approach with the capability to stimulate deep brain has the promise to advance the study of the intact nervous system and uncover new ways to treat neurological disorders.
🔬 Techniques
✨ Fluorophores
🧪 Sample Preparation
🔬 Cell Lines
🏭 Microscope Brands
🧪 Reagent Suppliers
💻 Software Details
💾 Data Repositories
🏛️ Research Organizations (ROR)
Affiliated research institutions:
📋 Methods
The sensitivity of TRPV1 to FUS sonication was evaluated in vitro . It was followed by in vivo assessment of the success rate of sonothermogenetics in the activation of genetically defined neurons in the mouse brain by two-photon microscopic calcium imaging. Behavioral response evoked by sonothermogenetic stimulation at a deep brain target was recorded in freely moving mice. Immunohistochemistry staining of ex vivo brain slices was performed to evaluate the safety of FUS sonication.
Methods
In vitro cell culture experiment. Our first experiment was performed to determine whether TRPV1 is a sonothermogenetic actuator by evaluating whether FUS could selectively control intracellular Ca 2+ influx in TRPV1-expressing HEK293T cells (see Supplementary Information for more details). We developed an experimental setup that allows simultaneous fluorescence imaging and FUS stimulation of HEK293T cells ( Fig. S1 ). The TRPV1 transgene was placed under the excitatory neuronal promoter calmodulin kinase II a-subunit and linked with mCherry by the posttranscriptional cleavage linker p2A (CaMKII-TRPV1-p2A-mCherry) [ 28 ]. This transgene was packed into a lentiviral vector and transfected to HEK293T cells in vitro to express TRPV1 ( Fig. S2 ). Cells that were transfected by the control lentivirus (CaMKII-mCherry) without TRPV1 were used as control. Fluo-4 AM (Thermo Fisher Scientific), a calcium (Ca 2+ ) indicator, was used to image the dynamics of Ca 2+ response to FUS stimulation using a fluorescence microscope (LX70, Olympus). The expression of TRPV1 in the HEK293T cells was confirmed to be mainly localized on the plasma membrane ( Fig. S3a ). The functionality of TRPV1 was confirmed by the observation of Ca 2+ influx in response to capsaicin, a TRPV1 agonist ( Fig. S3b ). FUS (frequency = 1.7 MHz, peak negative pressure = 1.0 MPa, duty cycle = 40%, PRF = 10 Hz, duration = 30 s) was applied to the cells with and without TRPV1 expression. An additional control experiment was performed by adding TRPV1 antagonist capsazepine [ 40 , 41 ] before FUS stimulation. Calcium images were recorded during FUS sonication, and the local temperature rise was simultaneously recorded using a fiber-optic thermometer (Luxtron, now LumaSense Technologies). For the positive control experiment, the cells were heated by water-bath heating using the resistor-based heating unit. In vivo two-photon calcium imaging experiment. After establishing TRPV1 as a sonothermogenetic actuator through in vitro experiments, we then tested whether FUS could selectively activate TRPV1 + neurons in the mouse brain in vivo. Lentivirus (1.0 μl of pLenti-CaMKII-TRPV1-p2A-mCherry-WPRE solution or 0.64 μl pLenti-CaMKII-mCherry-WPRE to achieve the same viral vector number) was injected into the somatosensory cortex (−0.5 mm dorsoventral, −1.2 mm anterior-posterior, and −1.2 mm mediolateral) of Thy1-GCaMP6f mice (Jackson Laboratory) following the intracranial injection procedure described in the Supplementary Information . At 4–6 weeks following virus injection, mice were used for FUS stimulation with simultaneous in vivo two-photon microscopic imaging (2PM) to record the neural activity based on the GCaMP6f, a Ca 2+ indicator. Sparse expression of TRPV1 was achieved with 2 – 4 neurons co-expressing TRPV1 and GCaMP6f in the small field of view (FOV) of the 2PM images to minimize crosstalk among TRPV1 + neurons once activated and allow morphological recognition of each individual TRPV1 + neurons [ 29 ]. We intentionally avoided using electrophysiological recordings because electrodes inserted in the brain interfere with ultrasound wave propagation, and ultrasound wave-induced mechanical vibration generates artifacts in electrical recordings. Before 2PM imaging, a chronic cranial window was created on the mouse head to obtain optical access to the mouse cerebral cortex for time-lapse Ca 2+ imaging using 2PM following an established protocol [ 30 ]. After the optical window surgery, the mice were anesthetized and head-fixed for acquiring in -vivo time-lapse 2PM images (see Supplementary Information ) with a custom-built 2PM microscope [ 31 ] during FUS stimulation. The FUS transducer was specially designed so that the inner edge of the ring FUS transducer geometrically fit the outer edge of the microscope objective to align the optical beam and FUS beam confocally. In the repeated FUS stimulation studies, the interval between two sequential stimulations was 80 s to minimize interference among repeated stimulations. A total of 5 different parameter groups were evaluated with the ultrasound frequency (1.7 MHz) and peak negative pressure (1.3 MPa) kept the same among all the groups: (1) pulsed wave (PW) with a duty cycle of 40% and total sonication duration of 15 s; (2) PW with a duty cycle of 40% and duration of 7 s; (3) continuous wave (CW) with a duty cycle of 100% and duration of 7 s; (4) CW with a duty cycle of 100% and duration of 4 s; (5) CW with a duty cycle of 100% and duration of 1 s. For group 1, we imaged a total of 17 neurons with coexpression of TRPV1 and GCaMP6f from 6 mice injected with the lentiviral vector encoding TRPV1. Two repeated FUS stimulations were delivered to each of these neurons. For comparison purposes, we imaged 16 neurons from 5 control mice with overexpression of mCherry without TRPV1 (TRPV1 − ). To test the temporal precision and repeatability of different FUS parameters, we applied 10 repeated stimuli to 5 individual neurons in mice from groups 2–5, which provided a total of 50 measurements of Ca 2+ signals for each FUS parameter set. To minimize the activation of the auditory pathway by FUS sonication [ 32 ], we used a pulse repetition frequency of 10 Hz for groups 1 and 2, which is outside the mouse hearing range [ 33 ], and smoothed the onset and offset of each ultrasound stimulus in all groups [ 34 ]. Calcium imaging data analysis. The calcium images recorded in the in vitro cell culture experiment were analyzed by MATLAB using a published algorithm [ 35 ]. Cells were automatically identified after applying a constrained nonnegative matrix factorization (CNMF) framework. Then, 100 cells were randomly selected from independent trials. Relative fluorescence intensity changes were computed for Ca 2+ signal as ΔF/F=(F-F 0 )/F 0 , where F 0 represents the average of a 1.5 s-long fluorescent signal acquired before FUS onset. Successful FUS stimulation was defined by the criteria that the normalized Ca 2+ fluorescence intensity (ΔF/F) acquired from the onset of FUS stimulation to 1.5-s after FUS was both >0.1 and > 2× standard deviation (SD) of 1.5 s-long signals acquired before FUS [ 36 ]. The percentage of responsive cells was calculated by dividing the number of successfully stimulated cells over the total number of all selected cells. For the in vivo study, regions of interest were manually selected to cover individual soma of the neurons expressing both GCaMP6f and mCherry with TRPV1 (TRPV1 + neurons) and without TRPV1 (TRPV1 − neurons). Successful FUS stimulation was defined as the same as the above in vitro study (ΔF/F > 0.1 and >2× SD). The success rate was quantified by the proportion of successful FUS stimulations to all the applied stimulations for every single neuron. The mean success rate was then calculated by averaging the success rate over all mCherry and GCaMP6f double-positive neurons in each mouse. Latency to threshold was defined as the time from the onset of FUS to the onset of a successful stimulation. Time to 50% relaxation was defined as the time when the Ca 2+ signal reached its peak amplitude to the time that it decayed to half of the peak amplitude. In vivo MR thermometry. MR thermometry was used to noninvasively image the spatiotemporal distribution of FUS-induced temperature rise in the mouse brain in vivo. MR thermometry is an established technique that can provide noninvasive, real-time, volumetric, and quantitative temperature measurements during FUS sonication [ 37 , 38 ]. BALB/c mice without viral injection were used in this study. MR thermometry was performed using a 4.7 T MRI system (Agilent/Varian DirectDrive Console). Temperature images were acquired using a continuously applied gradient-echo imaging sequence with a flip angle of 20 degrees, T R of 10 ms and T E of 4 ms, slice thickness of 1.5 mm, and matrix size of 128 × 128 for 60 × 60 mm FOV. Phase images were processed in real-time using ThermoGuide software (Image Guided Therapy). An MR-compatible FUS transducer (Image Guided Therapy) was targeted at the same brain location as the 2PM study. During the experiments, mice were anesthetized using 1–2% isoflurane and placed in a small animal cradle coupled with an MRI saddle coil (Image Guided Therapy, Pessac, France). The mouse head was stabilized by a bite bar and two ear bars. The rectal temperature was monitored throughout the experiment and maintained at ~37 °C using warm air, and the respiration rate was monitored using a respiratory pillow sensor. Although FUS can penetrate through the intact mice skull, we performed the same surgical procedure as described in the 2PM study to add the glass window in the mouse skull to better mimic the experimental condition of the 2PM study. For each mouse, 6 FUS stimuli were applied to the same brain location with the same acoustic pressure and duty cycles as in the 2PM study. Behavior test assay. We used adeno-associated viruses (AAVs) to target the TRPV1 specifically to CaMKII-expressing neurons in the striatum of wild-type mice (C57BL/6, female, 6–8 weeks old) and determined whether sonothermogenetics could achieve causal control of the locomotor behavior by activating the basal ganglia circuit in freely moving mice. We selected the striatum as the targeted brain site to demonstrate the unique advantage of sonothermogenetic in facilitating noninvasive deep brain neuromodulation. TRPV1 + mice were injected with 1.2 μL AAV5-CaMKII-TRPV1-p2A-DsRed (5.3 × 10 12 vg/ml) at the left striatum (−3.0 mm dorsoventral, 0.0 mm anterior-posterior, and −2.3 mm mediolateral). Mice in the control group (TRPV1 − mice) were injected with 0.5 μL of AAV5-CaMKII-DsRed (1.2 × 10 13 vg/ml) to achieve the same viral vector dose. A miniaturized wearable transducer was custom-made using a lead zirconate titanate (PZT) ceramic resonator (DL-43, DeL Piezo Specialties, FL) with a frequency of 1.5 MHz, an aperture of 10 mm, and a radius of curvature of 10 mm. The PZT transducer with air backing was packaged in a 3D printed cone-shape housing ( Fig. 5b ). The 3D-printed housing was designed to fit a base plate that was glued on the mouse skull 3 weeks post virus injection. The center point of the base plate was aligned with the striatum. Before the behavior testing, degassed ultrasound gel was filled in the cone, and the wearable transducer was plugged into the base plate. Following a 2-day adaption (1 hour per day) to the behavior test environment, the locomotor behavior of the mice in response to FUS stimulation was assessed. FUS sonication was repeatedly applied in both TRPV1 + and TRPV1 − mice using the similar acoustic parameters as those used in the 2PM study (frequency = 1.5 MHz, peak negative pressure = 1.3 MPa, duty cycle = 40%, PRF = 10 Hz, duration = 15 s). To reveal the parameter dependency of the behavior response, we evaluated another two FUS intensities in additional groups of TRPV1 + and TRPV1 − mice: peak negative pressure = 0, and 0.9 MPa. MPa acoustic pressure was corresponding to approximately half of the acoustic intensity of 1.3 MPa. A total of 10 TRPV1 + mice were sonicated at 1.3 MPa with n = 8 for all other groups. Each mouse was subjected to 3 or 5 repeated sonication. Previous studies showed that optogenetic stimulation at the same striatum location evoked rotational behavior in mice in the contralateral direction to the stimulation site [ 39 ]. We recorded the locomotor behavior of mice using a camera before, during, and after FUS sonication. The mean rotating angular speed and rotation direction were calculated and compared between TRPV1 + and TRPV1 − mice. The onset of rotation was defined as when the angular speed was > (mean + 3 × SD) of the angular speed obtained within a 5-s window before FUS on. The latency to rotation was calculated as the time delay between the starting time point of FUS sonication to the onset of animal rotation. An additional control experiment was performed with AAVs encoding TRPV1 injected in the left striatum, and the FUS sonication applied in the right striatum with the same FUS. A total of 4 mice were tested with each received 5 repeated sonication. The locomotor behavior of the mice was recorded and analyzed using the same method. Histological analysis. One practical consideration of thermal-based neuromodulation tools is the risk of damaging effects from the temperature increase. Two groups of mice without the injection of viral vectors were used to evaluate the safety of FUS exposure (n = 4 for each group). One group was sacrificed after FUS sonication with identical parameters to those used in the above study at 1.3 MPa. The other group served as the control without FUS exposure. Inspection of neuronal integrity, inflammation, and apoptosis by immunohistochemical staining of neurons (NeuN), astrocytes (GFAP), and microglia (Iba1) and staining for cell death (caspase-3 and TUNEL). The percentage of positive-stained cells over total DAPI-stained cells was calculated for each mice. Statistics. Data were analyzed using either a two-tailed t-test with unequal variance or ANOVA with the Bonferroni post hoc test. Statistical differences were considered significant whenever P < 0.05. All the graphs presented the results as average ± standard error of the mean (SEM).
Show full methods section
The sensitivity of TRPV1 to FUS sonication was evaluated in vitro . It was followed by in vivo assessment of the success rate of sonothermogenetics in the activation of genetically defined neurons in the mouse brain by two-photon microscopic calcium imaging. Behavioral response evoked by sonothermogenetic stimulation at a deep brain target was recorded in freely moving mice. Immunohistochemistry staining of ex vivo brain slices was performed to evaluate the safety of FUS sonication.
Methods
In vitro cell culture experiment. Our first experiment was performed to determine whether TRPV1 is a sonothermogenetic actuator by evaluating whether FUS could selectively control intracellular Ca 2+ influx in TRPV1-expressing HEK293T cells (see Supplementary Information for more details). We developed an experimental setup that allows simultaneous fluorescence imaging and FUS stimulation of HEK293T cells ( Fig. S1 ). The TRPV1 transgene was placed under the excitatory neuronal promoter calmodulin kinase II a-subunit and linked with mCherry by the posttranscriptional cleavage linker p2A (CaMKII-TRPV1-p2A-mCherry) [ 28 ]. This transgene was packed into a lentiviral vector and transfected to HEK293T cells in vitro to express TRPV1 ( Fig. S2 ). Cells that were transfected by the control lentivirus (CaMKII-mCherry) without TRPV1 were used as control. Fluo-4 AM (Thermo Fisher Scientific), a calcium (Ca 2+ ) indicator, was used to image the dynamics of Ca 2+ response to FUS stimulation using a fluorescence microscope (LX70, Olympus). The expression of TRPV1 in the HEK293T cells was confirmed to be mainly localized on the plasma membrane ( Fig. S3a ). The functionality of TRPV1 was confirmed by the observation of Ca 2+ influx in response to capsaicin, a TRPV1 agonist ( Fig. S3b ). FUS (frequency = 1.7 MHz, peak negative pressure = 1.0 MPa, duty cycle = 40%, PRF = 10 Hz, duration = 30 s) was applied to the cells with and without TRPV1 expression. An additional control experiment was performed by adding TRPV1 antagonist capsazepine [ 40 , 41 ] before FUS stimulation. Calcium images were recorded during FUS sonication, and the local temperature rise was simultaneously recorded using a fiber-optic thermometer (Luxtron, now LumaSense Technologies). For the positive control experiment, the cells were heated by water-bath heating using the resistor-based heating unit. In vivo two-photon calcium imaging experiment. After establishing TRPV1 as a sonothermogenetic actuator through in vitro experiments, we then tested whether FUS could selectively activate TRPV1 + neurons in the mouse brain in vivo. Lentivirus (1.0 μl of pLenti-CaMKII-TRPV1-p2A-mCherry-WPRE solution or 0.64 μl pLenti-CaMKII-mCherry-WPRE to achieve the same viral vector number) was injected into the somatosensory cortex (−0.5 mm dorsoventral, −1.2 mm anterior-posterior, and −1.2 mm mediolateral) of Thy1-GCaMP6f mice (Jackson Laboratory) following the intracranial injection procedure described in the Supplementary Information . At 4–6 weeks following virus injection, mice were used for FUS stimulation with simultaneous in vivo two-photon microscopic imaging (2PM) to record the neural activity based on the GCaMP6f, a Ca 2+ indicator. Sparse expression of TRPV1 was achieved with 2 – 4 neurons co-expressing TRPV1 and GCaMP6f in the small field of view (FOV) of the 2PM images to minimize crosstalk among TRPV1 + neurons once activated and allow morphological recognition of each individual TRPV1 + neurons [ 29 ]. We intentionally avoided using electrophysiological recordings because electrodes inserted in the brain interfere with ultrasound wave propagation, and ultrasound wave-induced mechanical vibration generates artifacts in electrical recordings. Before 2PM imaging, a chronic cranial window was created on the mouse head to obtain optical access to the mouse cerebral cortex for time-lapse Ca 2+ imaging using 2PM following an established protocol [ 30 ]. After the optical window surgery, the mice were anesthetized and head-fixed for acquiring in -vivo time-lapse 2PM images (see Supplementary Information ) with a custom-built 2PM microscope [ 31 ] during FUS stimulation. The FUS transducer was specially designed so that the inner edge of the ring FUS transducer geometrically fit the outer edge of the microscope objective to align the optical beam and FUS beam confocally. In the repeated FUS stimulation studies, the interval between two sequential stimulations was 80 s to minimize interference among repeated stimulations. A total of 5 different parameter groups were evaluated with the ultrasound frequency (1.7 MHz) and peak negative pressure (1.3 MPa) kept the same among all the groups: (1) pulsed wave (PW) with a duty cycle of 40% and total sonication duration of 15 s; (2) PW with a duty cycle of 40% and duration of 7 s; (3) continuous wave (CW) with a duty cycle of 100% and duration of 7 s; (4) CW with a duty cycle of 100% and duration of 4 s; (5) CW with a duty cycle of 100% and duration of 1 s. For group 1, we imaged a total of 17 neurons with coexpression of TRPV1 and GCaMP6f from 6 mice injected with the lentiviral vector encoding TRPV1. Two repeated FUS stimulations were delivered to each of these neurons. For comparison purposes, we imaged 16 neurons from 5 control mice with overexpression of mCherry without TRPV1 (TRPV1 − ). To test the temporal precision and repeatability of different FUS parameters, we applied 10 repeated stimuli to 5 individual neurons in mice from groups 2–5, which provided a total of 50 measurements of Ca 2+ signals for each FUS parameter set. To minimize the activation of the auditory pathway by FUS sonication [ 32 ], we used a pulse repetition frequency of 10 Hz for groups 1 and 2, which is outside the mouse hearing range [ 33 ], and smoothed the onset and offset of each ultrasound stimulus in all groups [ 34 ]. Calcium imaging data analysis. The calcium images recorded in the in vitro cell culture experiment were analyzed by MATLAB using a published algorithm [ 35 ]. Cells were automatically identified after applying a constrained nonnegative matrix factorization (CNMF) framework. Then, 100 cells were randomly selected from independent trials. Relative fluorescence intensity changes were computed for Ca 2+ signal as ΔF/F=(F-F 0 )/F 0 , where F 0 represents the average of a 1.5 s-long fluorescent signal acquired before FUS onset. Successful FUS stimulation was defined by the criteria that the normalized Ca 2+ fluorescence intensity (ΔF/F) acquired from the onset of FUS stimulation to 1.5-s after FUS was both >0.1 and > 2× standard deviation (SD) of 1.5 s-long signals acquired before FUS [ 36 ]. The percentage of responsive cells was calculated by dividing the number of successfully stimulated cells over the total number of all selected cells. For the in vivo study, regions of interest were manually selected to cover individual soma of the neurons expressing both GCaMP6f and mCherry with TRPV1 (TRPV1 + neurons) and without TRPV1 (TRPV1 − neurons). Successful FUS stimulation was defined as the same as the above in vitro study (ΔF/F > 0.1 and >2× SD). The success rate was quantified by the proportion of successful FUS stimulations to all the applied stimulations for every single neuron. The mean success rate was then calculated by averaging the success rate over all mCherry and GCaMP6f double-positive neurons in each mouse. Latency to threshold was defined as the time from the onset of FUS to the onset of a successful stimulation. Time to 50% relaxation was defined as the time when the Ca 2+ signal reached its peak amplitude to the time that it decayed to half of the peak amplitude. In vivo MR thermometry. MR thermometry was used to noninvasively image the spatiotemporal distribution of FUS-induced temperature rise in the mouse brain in vivo. MR thermometry is an established technique that can provide noninvasive, real-time, volumetric, and quantitative temperature measurements during FUS sonication [ 37 , 38 ]. BALB/c mice without viral injection were used in this study. MR thermometry was performed using a 4.7 T MRI system (Agilent/Varian DirectDrive Console). Temperature images were acquired using a continuously applied gradient-echo imaging sequence with a flip angle of 20 degrees, T R of 10 ms and T E of 4 ms, slice thickness of 1.5 mm, and matrix size of 128 × 128 for 60 × 60 mm FOV. Phase images were processed in real-time using ThermoGuide software (Image Guided Therapy). An MR-compatible FUS transducer (Image Guided Therapy) was targeted at the same brain location as the 2PM study. During the experiments, mice were anesthetized using 1–2% isoflurane and placed in a small animal cradle coupled with an MRI saddle coil (Image Guided Therapy, Pessac, France). The mouse head was stabilized by a bite bar and two ear bars. The rectal temperature was monitored throughout the experiment and maintained at ~37 °C using warm air, and the respiration rate was monitored using a respiratory pillow sensor. Although FUS can penetrate through the intact mice skull, we performed the same surgical procedure as described in the 2PM study to add the glass window in the mouse skull to better mimic the experimental condition of the 2PM study. For each mouse, 6 FUS stimuli were applied to the same brain location with the same acoustic pressure and duty cycles as in the 2PM study. Behavior test assay. We used adeno-associated viruses (AAVs) to target the TRPV1 specifically to CaMKII-expressing neurons in the striatum of wild-type mice (C57BL/6, female, 6–8 weeks old) and determined whether sonothermogenetics could achieve causal control of the locomotor behavior by activating the basal ganglia circuit in freely moving mice. We selected the striatum as the targeted brain site to demonstrate the unique advantage of sonothermogenetic in facilitating noninvasive deep brain neuromodulation. TRPV1 + mice were injected with 1.2 μL AAV5-CaMKII-TRPV1-p2A-DsRed (5.3 × 10 12 vg/ml) at the left striatum (−3.0 mm dorsoventral, 0.0 mm anterior-posterior, and −2.3 mm mediolateral). Mice in the control group (TRPV1 − mice) were injected with 0.5 μL of AAV5-CaMKII-DsRed (1.2 × 10 13 vg/ml) to achieve the same viral vector dose. A miniaturized wearable transducer was custom-made using a lead zirconate titanate (PZT) ceramic resonator (DL-43, DeL Piezo Specialties, FL) with a frequency of 1.5 MHz, an aperture of 10 mm, and a radius of curvature of 10 mm. The PZT transducer with air backing was packaged in a 3D printed cone-shape housing ( Fig. 5b ). The 3D-printed housing was designed to fit a base plate that was glued on the mouse skull 3 weeks post virus injection. The center point of the base plate was aligned with the striatum. Before the behavior testing, degassed ultrasound gel was filled in the cone, and the wearable transducer was plugged into the base plate. Following a 2-day adaption (1 hour per day) to the behavior test environment, the locomotor behavior of the mice in response to FUS stimulation was assessed. FUS sonication was repeatedly applied in both TRPV1 + and TRPV1 − mice using the similar acoustic parameters as those used in the 2PM study (frequency = 1.5 MHz, peak negative pressure = 1.3 MPa, duty cycle = 40%, PRF = 10 Hz, duration = 15 s). To reveal the parameter dependency of the behavior response, we evaluated another two FUS intensities in additional groups of TRPV1 + and TRPV1 − mice: peak negative pressure = 0, and 0.9 MPa. MPa acoustic pressure was corresponding to approximately half of the acoustic intensity of 1.3 MPa. A total of 10 TRPV1 + mice were sonicated at 1.3 MPa with n = 8 for all other groups. Each mouse was subjected to 3 or 5 repeated sonication. Previous studies showed that optogenetic stimulation at the same striatum location evoked rotational behavior in mice in the contralateral direction to the stimulation site [ 39 ]. We recorded the locomotor behavior of mice using a camera before, during, and after FUS sonication. The mean rotating angular speed and rotation direction were calculated and compared between TRPV1 + and TRPV1 − mice. The onset of rotation was defined as when the angular speed was > (mean + 3 × SD) of the angular speed obtained within a 5-s window before FUS on. The latency to rotation was calculated as the time delay between the starting time point of FUS sonication to the onset of animal rotation. An additional control experiment was performed with AAVs encoding TRPV1 injected in the left striatum, and the FUS sonication applied in the right striatum with the same FUS. A total of 4 mice were tested with each received 5 repeated sonication. The locomotor behavior of the mice was recorded and analyzed using the same method. Histological analysis. One practical consideration of thermal-based neuromodulation tools is the risk of damaging effects from the temperature increase. Two groups of mice without the injection of viral vectors were used to evaluate the safety of FUS exposure (n = 4 for each group). One group was sacrificed after FUS sonication with identical parameters to those used in the above study at 1.3 MPa. The other group served as the control without FUS exposure. Inspection of neuronal integrity, inflammation, and apoptosis by immunohistochemical staining of neurons (NeuN), astrocytes (GFAP), and microglia (Iba1) and staining for cell death (caspase-3 and TUNEL). The percentage of positive-stained cells over total DAPI-stained cells was calculated for each mice. Statistics. Data were analyzed using either a two-tailed t-test with unequal variance or ANOVA with the Bonferroni post hoc test. Statistical differences were considered significant whenever P < 0.05. All the graphs presented the results as average ± standard error of the mean (SEM).
Supplementary Material Movie S1 Movie S2 Supplementary material
📊 Figures
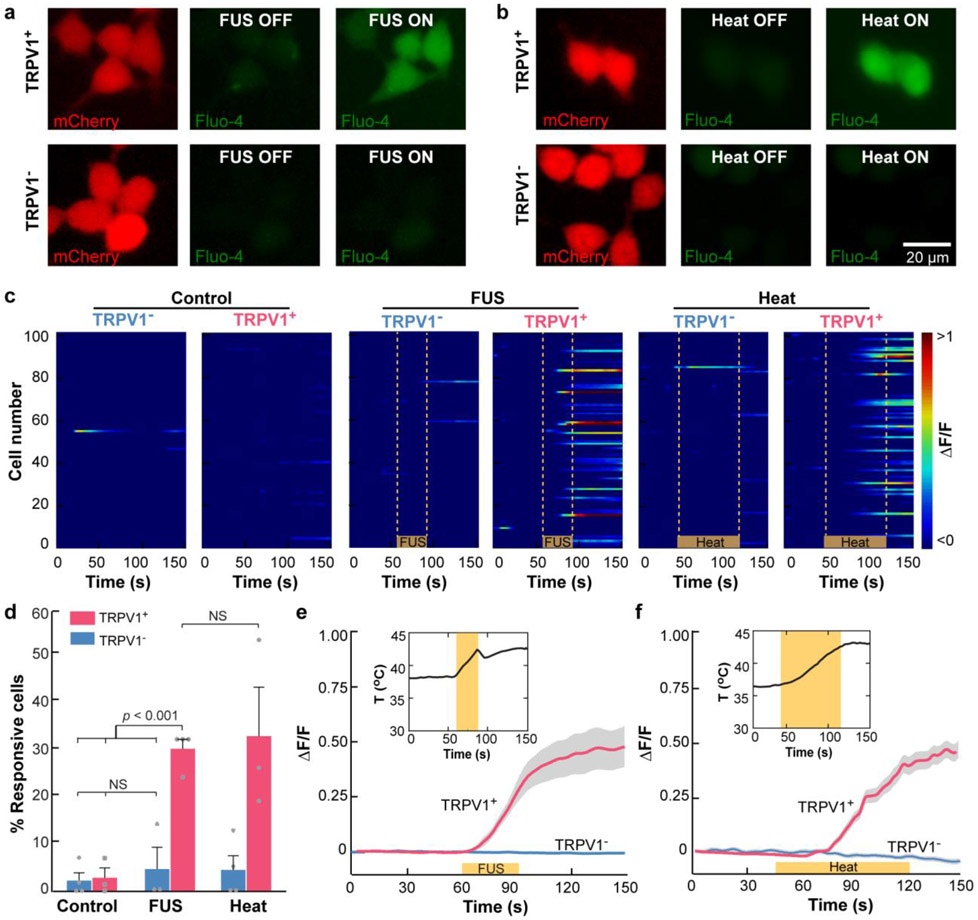
Fig. 1.
TRPV1 enables FUS activation of HEK293T cells in vitro .
( a, b ) Fluorescence images of HEK293T cells. Red: HEK293T cells expressing mCherry with the TRPV1 ion channel (TRPV1 + , top row) or without the TRPV1 ion channel (TRPV1 u2212 , bottom row). Green: ...
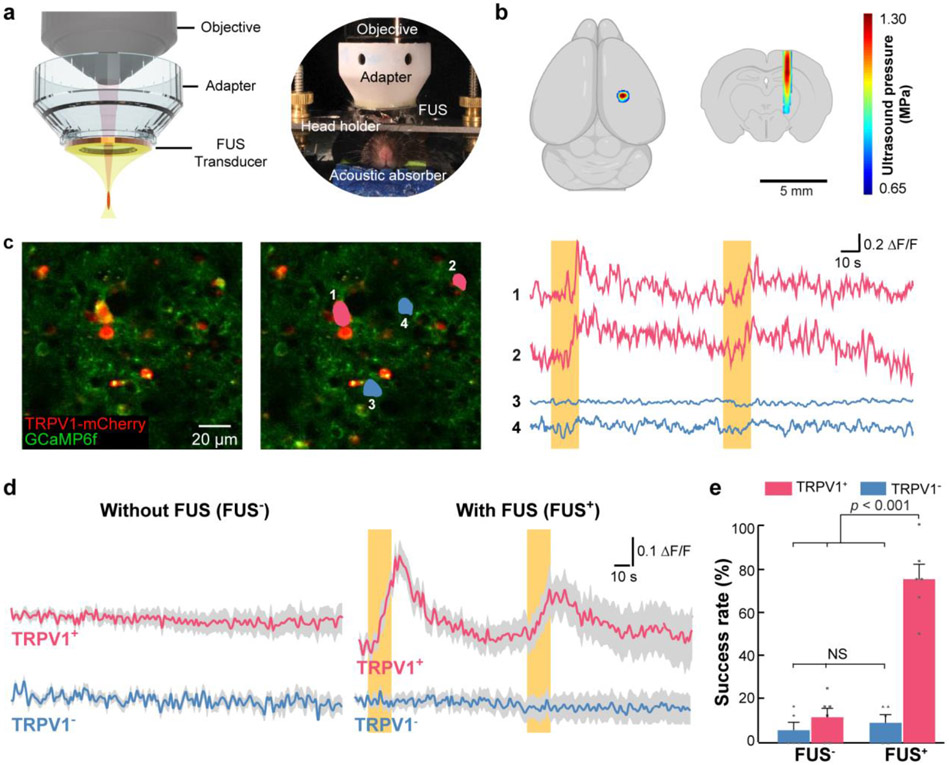
Fig. 2.
Sonothermogenetics selectively activates TRPV1 + neurons in vivo .
(a) Schematic illustration (left) and a photo (right) of the 2PM setup that couples a ring-shaped FUS transducer with the microscope objective using a customized adapter. The mouse head was fixed by a...
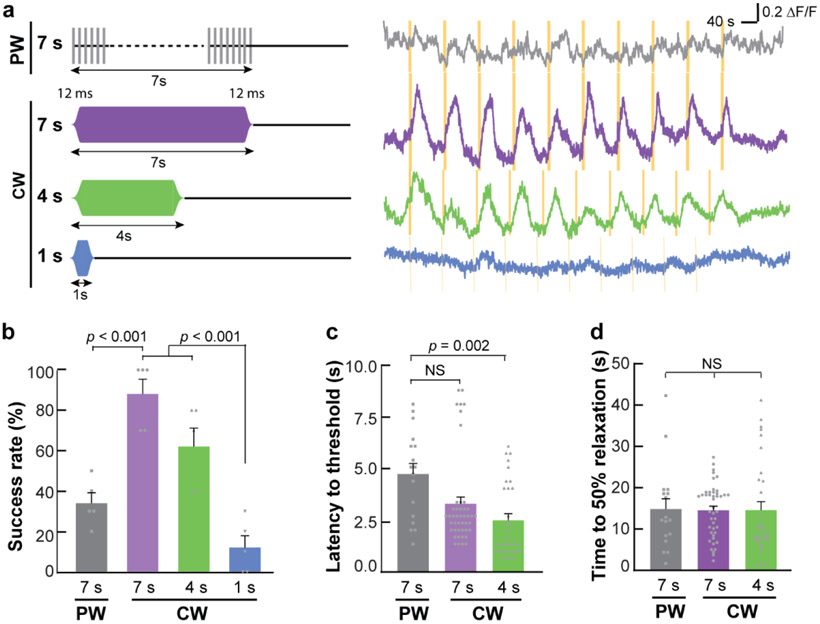
Fig. 3.
Temporally precise modulation of neural activity by sonothermogenetics.
( a ) Illustration of the smoothed pulsed wave (PW) and continuous wave (CW) (left). Representative Ca 2+ dynamics in response to 10 repeated FUS stimulations using different parameters (right). Yello...
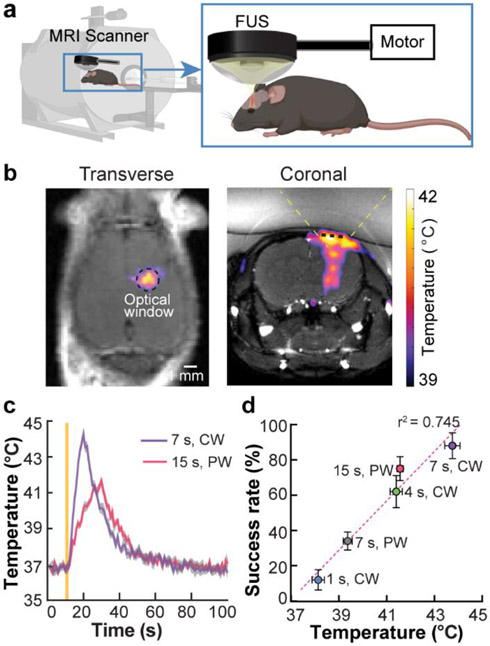
Fig. 4.
Control of sonothermogenetics by FUS-induced local heating.
(a) Integration of FUS with MR for imaging FUS-induced temperature rise in the mouse brain by in vivo real-time MR thermometry. ( b ) Spatial distribution of FUS-induced heating in the transverse and ...
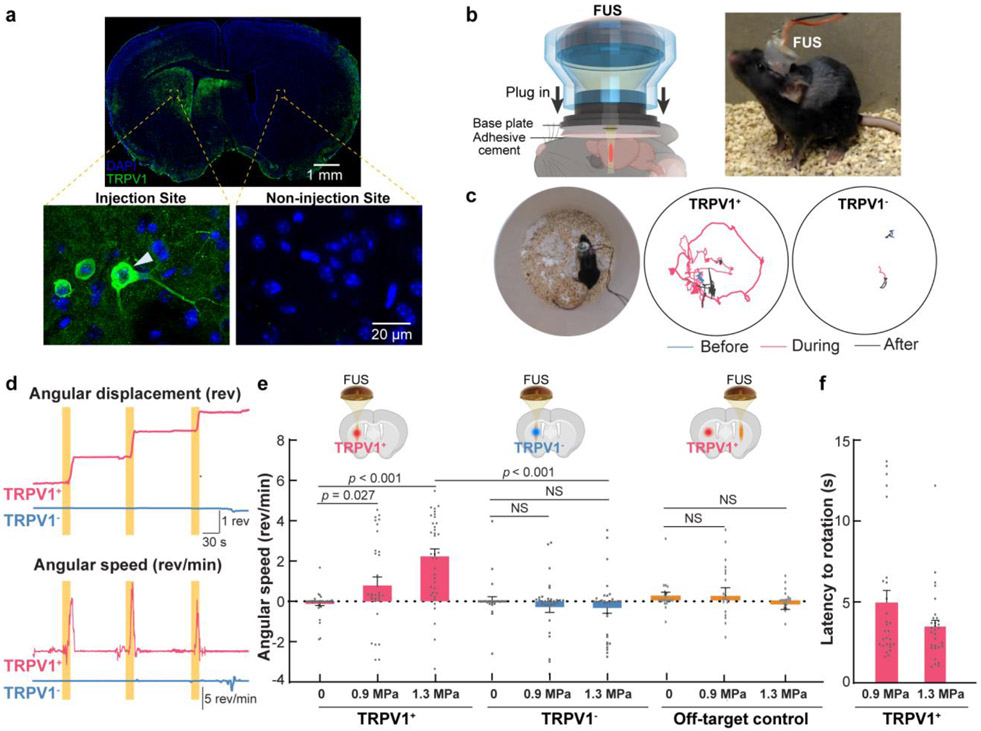
Fig. 5.
Sonothermogenetic modulation of mouse locomotor behavior.
( a ) Expression of TRPV1 in the mouse brain that was extracted one month after the viral injection and assessed by immunofluorescence staining with an anti-TRPV1 antibody. The arrowhead points at an ...
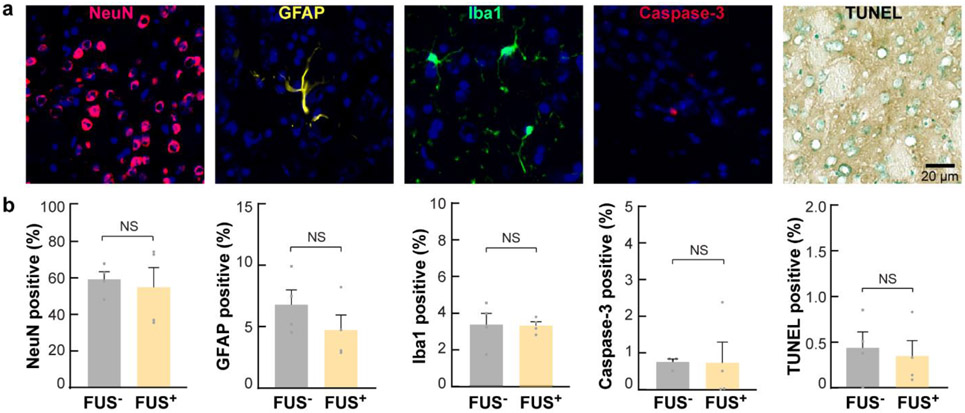
Fig. 6.
Sonothermogenetics is safe at the cellular level.
(a) Evaluation of neuronal integrity, inflammation, and apoptosis after FUS exposure in the FUS-targeted brain location using immunohistochemical staining of neurons (NeuN), astrocytes (GFAP), microgl...
Figure images are served from the NIH/NLM PubMed Central Open Access Subset or Europe PMC; copyright remains with the publishers and authors.
💬 Discussion
0 commentsNo comments yet. Be the first to start a discussion!
Leave a Comment