Abstract
The capsid structures of most Adeno-associated virus (AAV) serotypes, already assigned to an antigenic clade, have been previously determined. This study reports the remaining capsid structures of AAV7, AAV11, AAV12, and AAV13 determined by cryo-electron microscopy and three-dimensional image reconstruction to 2.96, 2.86, 2.54, and 2.76 Å resolution, respectively. These structures complete the structural atlas of the AAV serotype capsids. AAV7 represents the first clade D capsid structure; AAV11 and AAV12 are of a currently unassigned clade that would include AAV4; and AAV13 represents the first AAV2-AAV3 hybrid clade C capsid structure. These newly determined capsid structures all exhibit the AAV capsid features including 5-fold channels, 3-fold protrusions, 2-fold depressions, and a nucleotide binding pocket with an ordered nucleotide in genome-containing capsids. However, these structures have viral proteins that display clade-specific loop conformations. This structural characterization completes our three-dimensional library of the current AAV serotypes to provide an atlas of surface loop configurations compatible with capsid assembly and amenable for future vector engineering efforts. Derived vectors could improve gene delivery success with respect to specific tissue targeting, transduction efficiency, antigenicity or receptor retargeting.
🔬 Techniques
🔭 Microscopes
💻 Software
🧪 Sample Preparation
🔬 Cell Lines
🏭 Microscope Brands
🧪 Reagent Suppliers
📷 Detectors
💻 Software Details
💾 Data Repositories
🏛️ Research Organizations (ROR)
Affiliated research institutions:
📋 Methods
2.1. AAV Production and Purification The AAV7, AAV11, AAV12, and AAV13 producer plasmid cap genes were synthesized by GenArt (Thermo Fisher, Waltham, MA, USA) and subcloned into a plasmid with the AAV2 rep gene to generate pR2V7, pR2V11, pR2V12, and pR2V13, respectively. Recombinant AAV7, AAV11, AAV12, and AAV13 vectors, with a packaged luciferase gene, were produced by the triple transfection of HEK293 cells, utilizing pTR-UF3-Luciferase, pHelper (Stratagene, San Diego, CA, USA), and either pR2V7, pR2V11, pR2V12, or pR2V13, and harvested 72 h post transfection as previously described [ 41 ]. The cleared lysates containing AAV7, AAV12, and AAV13 capsids were purified by AVB Sepharose and AAV11 by POROS Capture Select AAVX affinity chromatography as previously described [ 42 ]. Sample purity and capsid integrity were monitored by SDS-PAGE and negative- stain electron microscopy using a Spirit microscope (FEI, Hillsboro, OR, USA). 2.2.
Cryo-Electron Microscopy Data Collection and 3D Image Reconstruction
For each of the purified AAV capsids, 3.5 μL was applied to a glow-discharged Quantifoil copper grid with 2 nm continuous carbon support over holes (Quantifoil R 2/4 400 mesh), blotted, and vitrified using a Vitrobot Mark 4 (FEI, Hillsboro, OR, USA) at 95% humidity and 4 °C. The capsid distribution and ice quality of the grids were screened in-house using an FEI Tecnai G2 F20-TWIN microscope (FEI) operated under low-dose conditions (200 kV, ≈20e − /Å 2 ). Images were collected on a GatanUltraScan 4000 CCD camera (Gatan, Pleasanton, CA, USA). Grids deemed suitable for high-resolution data collection were used for collecting micrograph movie frames using the Leginon application [ 43 ] on a Titan Krios electron microscope. The microscope was operated at 300 kV and data were collected on a Gatan K3 direct electron detector. During data collection, a total dose of ≈60 e − /Å 2 was utilized for 45 to 71 movie frames per micrograph ( Table 1 ). The movie frames were aligned using MotionCor2 with dose weighting [ 44 ]. All datasets were collected as part of the NIH “Southeastern Center for Microscopy of MacroMolecular Machines (SECM4)” project. For the three-dimensional image reconstruction, the cisTEM software package was utilized [ 45 ] and the data were processed as described previously [ 46 ]. The sharpened density maps were inspected using Coot and Chimera [ 47 , 48 ]. The −90 Å 2 /0 Å 2 sharpened maps were utilized for assignment of the amino acid main- and side chains. The resolution of the cryo-reconstructed density maps for empty (no DNA) and genome-containing AAV7, AAV11, AAV12, and AAV13 capsids were estimated based on a Fourier Shell Correlation of 0.143 ( Table 1 ). 2.3.
Show full methods section
2.1. AAV Production and Purification The AAV7, AAV11, AAV12, and AAV13 producer plasmid cap genes were synthesized by GenArt (Thermo Fisher, Waltham, MA, USA) and subcloned into a plasmid with the AAV2 rep gene to generate pR2V7, pR2V11, pR2V12, and pR2V13, respectively. Recombinant AAV7, AAV11, AAV12, and AAV13 vectors, with a packaged luciferase gene, were produced by the triple transfection of HEK293 cells, utilizing pTR-UF3-Luciferase, pHelper (Stratagene, San Diego, CA, USA), and either pR2V7, pR2V11, pR2V12, or pR2V13, and harvested 72 h post transfection as previously described [ 41 ]. The cleared lysates containing AAV7, AAV12, and AAV13 capsids were purified by AVB Sepharose and AAV11 by POROS Capture Select AAVX affinity chromatography as previously described [ 42 ]. Sample purity and capsid integrity were monitored by SDS-PAGE and negative- stain electron microscopy using a Spirit microscope (FEI, Hillsboro, OR, USA). 2.2.
Cryo-Electron Microscopy Data Collection and 3D Image Reconstruction
For each of the purified AAV capsids, 3.5 μL was applied to a glow-discharged Quantifoil copper grid with 2 nm continuous carbon support over holes (Quantifoil R 2/4 400 mesh), blotted, and vitrified using a Vitrobot Mark 4 (FEI, Hillsboro, OR, USA) at 95% humidity and 4 °C. The capsid distribution and ice quality of the grids were screened in-house using an FEI Tecnai G2 F20-TWIN microscope (FEI) operated under low-dose conditions (200 kV, ≈20e − /Å 2 ). Images were collected on a GatanUltraScan 4000 CCD camera (Gatan, Pleasanton, CA, USA). Grids deemed suitable for high-resolution data collection were used for collecting micrograph movie frames using the Leginon application [ 43 ] on a Titan Krios electron microscope. The microscope was operated at 300 kV and data were collected on a Gatan K3 direct electron detector. During data collection, a total dose of ≈60 e − /Å 2 was utilized for 45 to 71 movie frames per micrograph ( Table 1 ). The movie frames were aligned using MotionCor2 with dose weighting [ 44 ]. All datasets were collected as part of the NIH “Southeastern Center for Microscopy of MacroMolecular Machines (SECM4)” project. For the three-dimensional image reconstruction, the cisTEM software package was utilized [ 45 ] and the data were processed as described previously [ 46 ]. The sharpened density maps were inspected using Coot and Chimera [ 47 , 48 ]. The −90 Å 2 /0 Å 2 sharpened maps were utilized for assignment of the amino acid main- and side chains. The resolution of the cryo-reconstructed density maps for empty (no DNA) and genome-containing AAV7, AAV11, AAV12, and AAV13 capsids were estimated based on a Fourier Shell Correlation of 0.143 ( Table 1 ). 2.3.
Model
Building and Structure Refinement Three-dimensional (3D) homology models of AAV7, AAV11, AAV12, and AAV13 VP3 were generated with the protein structure homology-modeling server Swiss model ( https://swissmodel.expasy.org ) [ 49 ] using their amino acid sequences (NCBI accession numbers YP_077178 , AAT46339 , ABI16639 and ABZ10812 , respectively) and supplying the VP3 structures of AAV8 (PDB accession number: 2QA0) for AAV7, AAV4 (2G8G) for AAV11 and AAV12, and AAV3 (3KIC) for AAV13 as templates [ 9 , 14 , 15 ]. A T = 1 60-mer capsid coordinate model was generated from the respective VP3 with the VIPERdb2 Oligomer generator subroutine by icosahedral matrix multiplication [ 50 ]. The 60-mer capsid models of each AAV were docked into their cryo-reconstructed density maps by rigid body rotations and translations using the ‘fit in map’ subroutine within UCSF-Chimera [ 48 ]. This application uses a correlation coefficient (CC) calculation to assess the quality of the fit between the map generated from the model and the reconstructed map. During the model fitting, the voxel (pixel) size of each reconstructed map was adjusted to optimize the CC between the models and maps. The fitted models were exported relative to the respective map for further use. Each map was resized to the voxel size determined in Chimera using the “e2proc3D.py” subroutine in EMAN2 [ 51 ] and then converted to the CCP4 format using the program MAPMAN [ 52 ]. A VP monomer was extracted from each 60-mer and the side- and main chains were adjusted into the maps by manual building and the real-space refinement subroutine in Coot [ 47 ]. The adjusted capsid model was refined against the map utilizing the rigid body, real space, and B-factor refinement subroutines in Phenix [ 53 ]. Capsid model refinement was alternated with visualization and adjustment of VP side- and main chains using Coot while maintaining model geometry as well as rotamer and Ramachandran constraints [ 47 ]. The CC and refinement statistics, including root mean square deviations (RMSD) from ideal bond lengths and angles ( Table 1 ), were analyzed using Phenix [ 53 ]. 2.4. AAV Capsid Structure Comparison The Cα positions of the ordered amino acids within the VP3 atomic coordinates for each of the AAVs were superposed using secondary structure matching (SSM) in Coot [ 54 ]. This SSM subroutine also generates a list of the Cα–Cα distances between the aligned structures, which was used to calculate the overall root mean square deviation (RMSD). Deviations between non-overlapping Cα positions, because of residue deletions or insertions, were measured using the distance tool in Coot. Structural identity was determined using PDBeFold ( https://www.ebi.ac.uk/msd-srv/ssm/ ) and calculated as the number of aligned residues (
📊 Figures
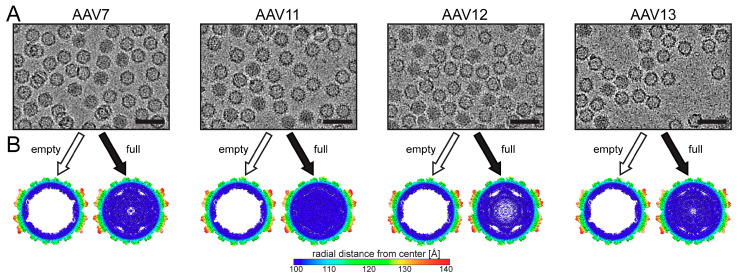
Figure 1
Cryo-electron microscopy (cryo-EM) reconstruction of genome containing (full) and empty AAV7 and AAV11u2013AAV13 capsids. ( A ) Cryo-electron micrographs showing the presence of full capsids (dark app...
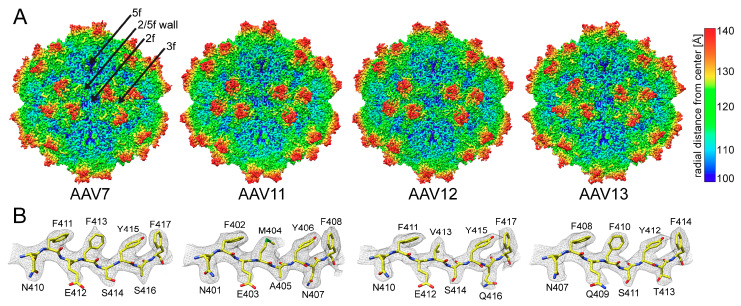
Figure 2
The AAV7 and AAV11u201313 capsid structures. ( A ) The capsid surface density maps contoured at a sigma (u03c3) threshold level of 2.0. The maps are radially colored (blue to red) according to distanc...
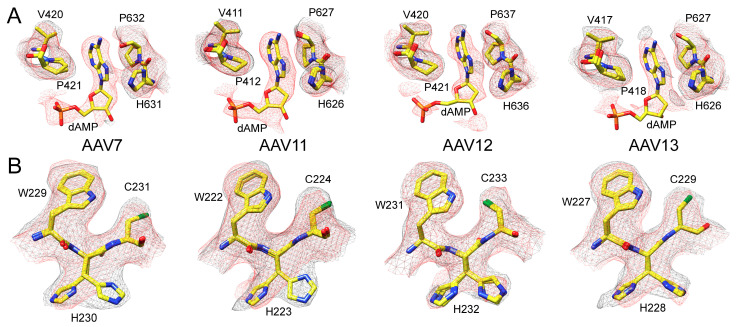
Figure 3
Empty and full Adeno-associated virus (AAV) density map differences. ( A ) The modeled AAV7 and AAV11u201313 residues at the nucleotide binding pocket with their respective mesh density maps (black = ...
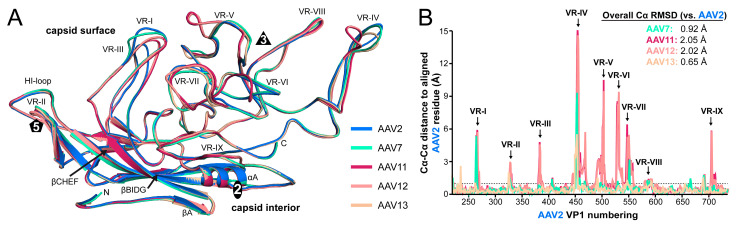
Figure 4
Structural comparison of AAV2, AAV7, and AAV11u201313. ( A ) Structural superposition of AAV2 (blue), AAV7 (cyan), AAV11 (burgundy), AAV12 (salmon), and AAV13 (wheat) shown as ribbon diagrams. The pos...
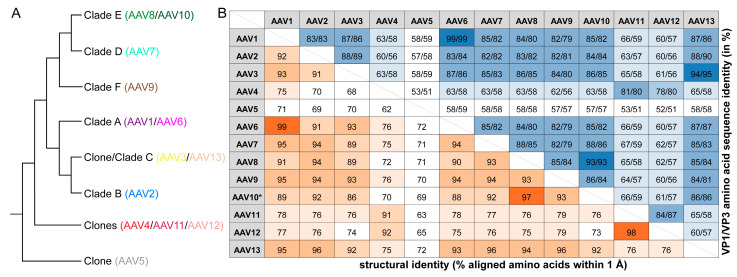
Figure 5
Relationship of the AAV serotypes. ( A ) Cladogram showing the assignment of the AAV serotypes to their clades as proposed by Gao et al. [ 3 ]. ( B ) Amino acid sequence identity of the AAV serotypes ...
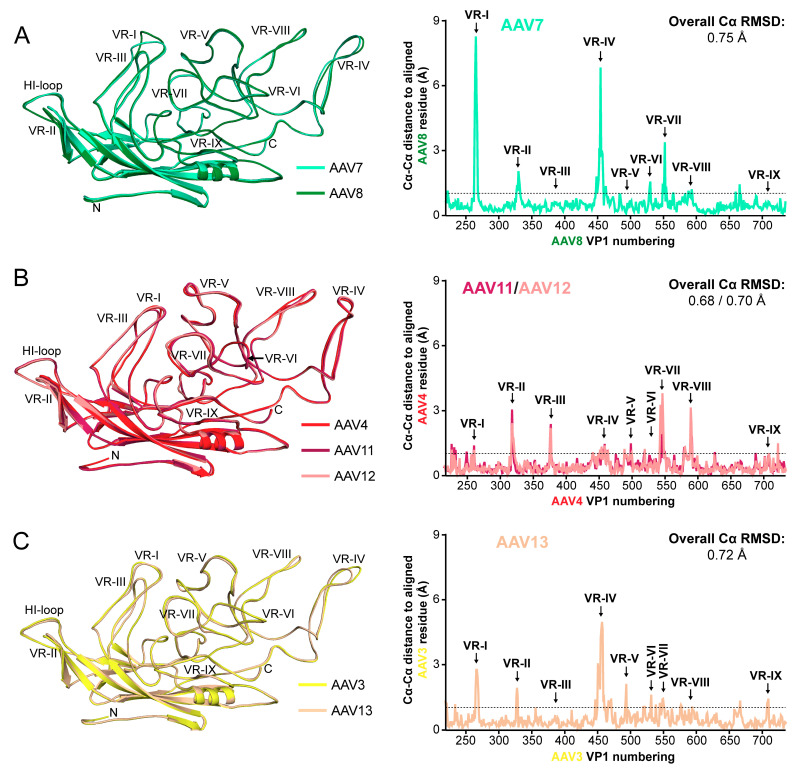
Figure 6
Structural comparison of AAV7 and AAV11u201313 to their closest clade member. ( A ) Leftu2014Structural superposition of AAV7 (cyan) and AAV8 (green) shown as ribbon diagrams. The positions of the N- ...
Figure images are served from the NIH/NLM PubMed Central Open Access Subset or Europe PMC; copyright remains with the publishers and authors.
💬 Discussion
0 commentsNo comments yet. Be the first to start a discussion!
Leave a Comment