Abstract
Abstract Crossing the blood–brain barrier in primates is a major obstacle for gene delivery to the brain. Adeno-associated viruses (AAVs) promise robust, non-invasive gene delivery from the bloodstream to the brain. However, unlike in rodents, few neurotropic AAVs efficiently cross the blood–brain barrier in non-human primates. Here we report on AAV.CAP-Mac, an engineered variant identified by screening in adult marmosets and newborn macaques, which has improved delivery efficiency in the brains of multiple non-human primate species: marmoset, rhesus macaque and green monkey. CAP-Mac is neuron biased in infant Old World primates, exhibits broad tropism in adult rhesus macaques and is vasculature biased in adult marmosets. We demonstrate applications of a single, intravenous dose of CAP-Mac to deliver functional GCaMP for ex vivo calcium imaging across multiple brain areas, or a cocktail of fluorescent reporters for Brainbow-like labelling throughout the macaque brain, circumventing the need for germline manipulations in Old World primates. As such, CAP-Mac is shown to have potential for non-invasive systemic gene transfer in the brains of non-human primates.
🔬 Techniques
🔭 Microscopes
🧬 Organisms
💻 Software
✨ Fluorophores
🧪 Sample Preparation
🔬 Cell Lines
🏭 Microscope Brands
🧪 Reagent Suppliers
💻 Software Details
📋 Protocols
💻 Code & Software
💾 Data Repositories
🏷️ Research Resource Identifiers (RRIDs)
Verified research resources used in this paper:
🏛️ Research Organizations (ROR)
Affiliated research institutions:
📋 Methods
Experimental utility of CAP-Mac to study the macaque brain The BRAIN initiative emphasizes the importance of developing novel tools for genetic modulation in NHPs to inform further understanding of the human brain 48 . Accordingly, we leveraged CAP-Mac’s neuronal tropism in newborn macaques to deliver genetically encoded reporters to interrogate the NHP brain. First, we used CAP-Mac as a non-invasive method to define neuronal morphology. Having administered a cocktail of three CAP-Mac vectors packaging different XFPs, we attempted Brainbow-like labelling 13 , 34 , 35 in an OWP (Fig. 4a–d ). We observed widespread expression of all three XFPs throughout the brain, including the cerebellum, cortex and lateral geniculate nucleus of the thalamus. In the cerebellum and thalamus, we observed a high density of transduced cells, and the highest proportion of co-localization of two or three XFPs. Given this robust expression, we were able to reconstruct the morphology of medium spiny neurons and cortical pyramidal cells (Fig. 4e,f ). Fig. 4 Experimental utility of CAP-Mac for interrogation of the newborn rhesus macaque brain. a – f , CAP-Mac packaging three fluorescent reporters ( a ) to generate Brainbow-like labelling in rhesus macaque cerebellum ( b ), cortex ( c ) and thalamus (lateral geniculate nucleus) ( d ), enabling morphological reconstruction of neurons ( e and f ). g – i , Non-invasive delivery of ssCAG-GCaMP8s using CAP-Mac ( g ) for ex vivo two-photon imaging ( h ) and brain-wide GCaMP expression ( i ). In a second set of experiments, we used CAP-Mac to express functional GCaMP throughout the infant rhesus macaque brain (Fig. 4g ). Given the experimental complexity and limited availability of NHPs, we performed initial cargo screening in mice, testing GCaMP configurations in single- and dual-vector formats (Extended Data Fig. 4 ). Based on our results, we found that the neuronal bias of CAP-Mac extended to mice when delivered to the brain via intracerebroventricular (ICV), but not IV, administration and opted to use a one-component vector using the CAG promoter in NHPs. We intravenously delivered ssCAG-GCaMP8s to newborn macaques (3 × 10 13 vg kg − 1 via the saphenous vein) and, after 4–6 weeks of expression, isolated tissue for ex vivo two-photon imaging. In the hippocampus, thalamus and cortex, we successfully recorded the field-potential-evoked calcium gradients of GCaMP-expressing cells (Fig. 4h ). Cells were responsive to restimulation throughout the experiment and, importantly, the mean peak Δ F / F of the GCaMP signal increased with an increasing number of field potential pulses, with differing cellular calcium dynamics across the four sampled brain regions (Extended Data Fig. 5 ). Consistent with our previous profiling, we saw GCaMP expression primarily in cell types with neuronal morphology throughout the brain (Fig. 4i ).
Show full methods section
Experimental utility of CAP-Mac to study the macaque brain The BRAIN initiative emphasizes the importance of developing novel tools for genetic modulation in NHPs to inform further understanding of the human brain 48 . Accordingly, we leveraged CAP-Mac’s neuronal tropism in newborn macaques to deliver genetically encoded reporters to interrogate the NHP brain. First, we used CAP-Mac as a non-invasive method to define neuronal morphology. Having administered a cocktail of three CAP-Mac vectors packaging different XFPs, we attempted Brainbow-like labelling 13 , 34 , 35 in an OWP (Fig. 4a–d ). We observed widespread expression of all three XFPs throughout the brain, including the cerebellum, cortex and lateral geniculate nucleus of the thalamus. In the cerebellum and thalamus, we observed a high density of transduced cells, and the highest proportion of co-localization of two or three XFPs. Given this robust expression, we were able to reconstruct the morphology of medium spiny neurons and cortical pyramidal cells (Fig. 4e,f ). Fig. 4 Experimental utility of CAP-Mac for interrogation of the newborn rhesus macaque brain. a – f , CAP-Mac packaging three fluorescent reporters ( a ) to generate Brainbow-like labelling in rhesus macaque cerebellum ( b ), cortex ( c ) and thalamus (lateral geniculate nucleus) ( d ), enabling morphological reconstruction of neurons ( e and f ). g – i , Non-invasive delivery of ssCAG-GCaMP8s using CAP-Mac ( g ) for ex vivo two-photon imaging ( h ) and brain-wide GCaMP expression ( i ). In a second set of experiments, we used CAP-Mac to express functional GCaMP throughout the infant rhesus macaque brain (Fig. 4g ). Given the experimental complexity and limited availability of NHPs, we performed initial cargo screening in mice, testing GCaMP configurations in single- and dual-vector formats (Extended Data Fig. 4 ). Based on our results, we found that the neuronal bias of CAP-Mac extended to mice when delivered to the brain via intracerebroventricular (ICV), but not IV, administration and opted to use a one-component vector using the CAG promoter in NHPs. We intravenously delivered ssCAG-GCaMP8s to newborn macaques (3 × 10 13 vg kg − 1 via the saphenous vein) and, after 4–6 weeks of expression, isolated tissue for ex vivo two-photon imaging. In the hippocampus, thalamus and cortex, we successfully recorded the field-potential-evoked calcium gradients of GCaMP-expressing cells (Fig. 4h ). Cells were responsive to restimulation throughout the experiment and, importantly, the mean peak Δ F / F of the GCaMP signal increased with an increasing number of field potential pulses, with differing cellular calcium dynamics across the four sampled brain regions (Extended Data Fig. 5 ). Consistent with our previous profiling, we saw GCaMP expression primarily in cell types with neuronal morphology throughout the brain (Fig. 4i ).
Methods
All the experiments and procedures were approved by local regulatory boards and committees and were required to comply with study protocols. All the mouse procedures were performed at Caltech, approved by the Caltech Institutional Animal Care and Use Committee (IACUC; protocol 1738). Marmoset (protocol TGC-03) and adult macaque (protocol LN-14) procedures took place at the NIH and were approved by the NIH IACUC. Marmoset procedures were also completed at University of California San Diego (UCSD) (protocol S09147) and were in compliance with and approved by the UCSD IACUC. Infant macaque procedures took place at the California National Primate Research Center at University of California Davis, and were approved by their local IACUC (protocol 22525). Green monkey procedures took place at Virscio and were approved by their local IACUC.
AAV DNA library generation
The details of this procedure can be found on protocols.io (10.17504/protocols.io.5jyl8jy89g2w/v1). We initially generated diversity at the DNA level, which we then used to produce transfection material to produce the AAV capsid library, as described previously in detail 16 . For the first-round library, we introduced this genetic diversity using primers containing degenerate nucleotides inserted between amino acids 588 and 589 (refs. 12 , 13 , 16 ) (VP1 numbering; Supplementary Fig. 1a ). We used a reverse primer containing 7 degenerate nucleotides ([NNK] × 7) to randomly generate polymerase chain reaction (PCR) fragments containing unique 7mer sequences inserted into the cap gene. For the second-round DNA library, we used a synthetic oligo pool (Twist Bioscience) as a reverse primer, encoding only variants selected for further screening (total, 66,628 DNA oligos; 33,314 variants recovered after first-round selections plus a codon-modified replicate of each). All the reverse primers contained a 20 bp 5′ overhang complementary to the cap sequence near the AgeI restriction enzyme sequence and were paired with a forward primer containing a 20 bp 5′ overhang near the XbaI restriction enzyme sequence. We then inserted the PCR fragments containing the diversified region into the rAAV-ΔCAP-in-cis-Lox plasmid via Gibson assembly to generate the resulting AAV DNA library, namely, rAAV-CAP-in-cis-Lox, using NEBuilder HiFi DNA Assembly Master Mix (New England Biolabs, E2621).
AAV capsid library production
The details of this procedure can be found on protocols.io (10.17504/protocols.io.5jyl8jyz9g2w/v1). We generated AAV capsid libraries according to previously published protocols 16 , 70 . Briefly, we transfected HEK293T cells (ATCC, cat # CRL-3216; RRID: CVCL_0063) in 150 mm tissue culture plates using transfection-grade linear polyethylenimine (PEI; Polysciences). In each plate, we transfected four plasmids: (1) the assembled rAAV-Cap-in-cis-Lox AAV DNA library, which is flanked by inverted terminal repeats required for AAV encapsidation; (2) AAV2/9 REP-AAP-ΔCAP, which encodes the REP and AAP supplemental proteins required for AAV production with the C terminus of the cap gene excised to prevent recombination with the AAV DNA library and subsequent production of replication-competent AAV; (3) pHelper, which encodes the necessary adenoviral proteins required for AAV production; and (4) pUC18 (Addgene ID: 50004; RRID: Addgene_50004), which contains no mammalian expression vector but is used as filler DNA to achieve the appropriate nitrogen-to-phosphate ratio for optimal PEI transfection. During preparation of the PEI–DNA mixture, we added 10 ng of our AAV DNA library (rAAV-Cap-in-cis-Lox) for every 150 mm dish and combined AAV2/9 REP-AAP-ΔCAP, pUC18 and pHelper in a 1:1:2 ratio (40 µg of total DNA per 150 mm dish). At 60 h post-transfection, we purified the AAV capsid library from both cell pellet and media using polyethylene glycol precipitation and iodixanol gradient ultracentrifugation. Using quantitative PCR, we then determined the titre of the AAV capsid libraries by amplifying DNaseI-resistant viral genomes relative to a linearized genome standard according to established protocols 70 . Marmoset experiments Capsid library selections The details of this procedure can be found on protocols.io (10.17504/protocols.io.bp2l695zklqe/v2). All the marmoset ( C. jacchus ) procedures were performed at the National Institute of Mental Health (NIMH) and approved by the local IACUC. Marmosets were born and raised in NIMH colonies and housed in family groups under standard conditions of 27 °C and 50% humidity. They were fed ad libitum and received enrichment as part of the primate enrichment program for NHPs at the NIH. For all the marmosets used in this study, there were no detectible neutralizing antibodies at a 1:5 serum dilution before IV infusions (assayed by the Penn Vector Core, University of Pennsylvania). They were then individually housed for several days and acclimated to a new room before injections. Four adult males were used for the library screening, two each for the first- and second-round libraries. The day before infusion, the animals’ food was removed. Animals were anaesthetized with isoflurane in oxygen, the skin over the femoral vein was shaved and sanitized with an isopropanol scrub and 2 × 10 12 vg of the AAV capsid library was infused over several minutes. Anaesthesia was withdrawn and the animals were monitored until they became active, on which they were returned to their cages. Activity and behaviour were closely monitored over the next 3 days, with daily observations thereafter. At 4 weeks post-injection, marmosets were euthanized (Euthanasia, VetOne) and perfused with 1× phosphate-buffered saline (PBS). After the first-round library, the brain was cut into four coronal blocks, flash frozen in 2-methylbutane (Sigma-Aldrich, M32631 ), chilled with dry ice and stored at −80 °C for long-term storage. After the second-round library, the brain was cut into six coronal blocks and, along with sections of the spinal cord and liver, was flash frozen and stored at −80 °C for long-term storage. Individual characterization of AAVs in marmosets The details of the procedures in this section can be found on protocols.io (10.17504/protocols.io.5qpvormddv4o/v1 and 10.17504/protocols.io.j8nlkwxxwl5r/v1). Two adult common marmosets ( C. jacchus ) were used for this experiment: Conan (male, 2.8 years old, 0.386 kg) and Sandy (female, 5.8 years old, 0.468 kg) (Supplementary Table 3 provides more details). They were housed under standard conditions of 27 °C and 50% humidity, with ad libitum access to food and water. All the animals were group housed, and the experiments were performed in the Cortical Systems and Behavior Laboratory at UCSD. All the experiments were approved by the UCSD IACUC. The day before infusion, the animals’ food was removed. Animals were anaesthetized with ketamine (Ketaset, Zoetis 043-304, 20 mg kg − 1 ), the skin over the saphenous vein was shaved and sanitized with an isopropanol scrub and 2 × 10 13 vg kg − 1 of AAV was infused over 5 min. The animals were monitored until they became active, on which they were returned to their cages. Activity and behaviour were closely monitored over the next 3 days, with daily observations thereafter. Blood samples were taken on days 1, 7, 14, 21 and 31 to measure the viral concentration in plasma. At 31 days post-injection, the marmosets were anaesthetized with ketamine as described earlier and then euthanized (Euthasol, Virbac 200-071, 1 ml kg − 1 ) and perfused with 1× PBS. Brains and organs were cut in half, and one half was flash frozen in 2-methylbutane (Sigma-Aldrich, M32631 ), chilled with dry ice and stored at −80 °C. The other half was fixed in 4% paraformaldehyde (PFA) (Thermo Scientific, J19943-K2) overnight and then stored at 4 °C in PBS azide (Sigma-Aldrich, S2002-100G, 0.025%). The samples were then shipped to the California Institute of Technology (Caltech) for analysis. For GLUT1 staining, we incubated slices with rabbit anti-GLUT1 (1:200; Millipore-Sigma, cat # 07-1401; RRID: AB_1587074), performed three to five washes with PBS, incubated with donkey anti-rabbit IgG (1:200; Jackson ImmunoResearch Labs, cat # 711-605-152; RRID: AB_2492288) and washed three to five times before mounting. We diluted all antibodies and performed all incubations using PBS supplemented with 0.1% Triton X-100 (Sigma-Aldrich, T8787) and 10% normal donkey serum (Jackson ImmunoResearch Labs, cat # 017-000-121; RRID: AB_2337258) overnight at room temperature with shaking.
Viral library DNA extraction and NGS sample preparation
The details of this procedure can be found on protocols.io (10.17504/protocols.io.bp2l695zklqe/v2). We previously reported that viral library DNA and endogenous host RNA can be isolated using TRIzol by precipitating nucleic acid from the aqueous phase 12 , 16 . Therefore, to extract viral library DNA from marmoset tissue, we homogenized 100 mg of spinal cord, liver and each coronal block of the brain in TRIzol (Life Technologies, 15596) using a BeadBug (Benchmark Scientific, D1036) and isolated nucleic acids from the aqueous phase according to the manufacturer’s recommended protocol. We treated the reconstituted precipitate with RNase (Invitrogen, AM2288) and digested with SmaI to improve downstream viral DNA recovery via PCR. After digestion, we purified with a Zymo DNA Clean and Concentrator kit (D4033) according to the manufacturer’s recommended protocol and stored the purified viral DNA at −20 °C. To append Illumina adaptors flanking the diversified region, we first PCR amplified the region containing our 7mer insertion using 50% of the total extracted viral DNA as a template (25 cycles). After Zymo DNA purification, we diluted the samples at 1:100 and further amplified around the variable region with ten cycles of PCR, appending binding regions for the next PCR reaction. Finally, we appended Illumina flow cell adaptors and unique indices using NEBNext Dual Index Primers (New England Biolabs, E7600) via ten more cycles of PCR. We then gel purified the final PCR products using a 2% low-melting-point agarose gel (Thermo Fisher Scientific, 16520050) and recovered the 210 bp band. For the second-round library only, we also isolated the encapsidated AAV library ssDNA for NGS to calculate the library enrichment scores, a quantitative metric that we used to normalize for differences in titre of the various variants in our library (see ref. 16 and the ‘NGS read alignment, analysis and generation of network graphs’ section). To isolate the encapsidated viral genomes, we treated the AAV capsid library with DNaseI and digested capsids using proteinase K. We then purified the ssDNA using phenol–chloroform, amplified viral transgenes by two PCR amplification steps to add adaptors and indices for Illumina NGS and purified using gel electrophoresis. This viral library DNA, along with the viral DNA extracted from the tissue, was sent for deep sequencing using an Illumina HiSeq 2500 system (Millard and Muriel Jacobs Genetics and Genomics Laboratory, Caltech). NGS read alignment, analysis and generation of network graphs Raw FASTQ files from NGS runs were processed with custom-built scripts ( https://github.com/GradinaruLab/protfarm and https://github.com/GradinaruLab/mCREATE ) 16 . For the first-round library, the pipeline to process these datasets involved filtering to remove low-quality reads, utilizing a quality score for each sequence, and eliminating bias from PCR-induced mutations or high GC-content. The filtered dataset was then aligned by a perfect string match algorithm and trimmed to improve the alignment quality. We then displayed the absolute read counts for each variant during the sequencing run within each tissue, and all the 33,314 variants that were found in the brain were chosen for the second-round selections. After the second-round selections, we performed the same analysis to display the variant absolute read count of the injected virus library and of each variant within each tissue. Additionally, we calculated the library enrichment 16 for each variant within each tissue: 1 documentclass[12pt]{minimal} usepackage{amsmath} usepackage{wasysym} usepackage{amsfonts} usepackage{amssymb} usepackage{amsbsy} usepackage{mathrsfs} usepackage{upgreek} setlength{oddsidemargin}{-69pt} begin{document}$${overline{{rm{RC}}}}_{x,{rm{injected}},{rm{library}}}=,frac{{{rm{RC}}}_{x,{rm{injected}},{rm{library}}}}{mathop{sum }nolimits_{i=1}^{{N}_{{rm{injected}},{rm{library}}}}{{rm{RC}}}_{i,{rm{injected},{library}}}},$$end{document} RC ¯ x , injected library = RC x , injected library ∑ i = 1 N injected library RC i , injected l i b r a r y , 2 documentclass[12pt]{minimal} usepackage{amsmath} usepackage{wasysym} usepackage{amsfonts} usepackage{amssymb} usepackage{amsbsy} usepackage{mathrsfs} usepackage{upgreek} setlength{oddsidemargin}{-69pt} begin{document}$${overline{{rm{RC}}}}_{x,{rm{tissue}}}=,frac{{{rm{RC}}}_{x,{rm{virus}}}}{mathop{sum }nolimits_{i=1}^{{N}_{{rm{tissue}}}}{{rm{RC}}}_{i,{rm{tissue}}}},$$end{document} RC ¯ x , tissue = RC x , virus ∑ i = 1 N tissue RC i , tissue , 3 documentclass[12pt]{minimal} usepackage{amsmath} usepackage{wasysym} usepackage{amsfonts} usepackage{amssymb} usepackage{amsbsy} usepackage{mathrsfs} usepackage{upgreek} setlength{oddsidemargin}{-69pt} begin{document}$${rm{Library},{enrichment}}=,{log }_{10}left(frac{{overline{{rm{RC}}}}_{x,rm{{injected},{library}}}}{{overline{{rm{RC}}}}_{x,{rm{tissue}}}}right),$$end{document} Library e n r i c h m e n t = log 10 RC ¯ x , injected l i b r a r y RC ¯ x , tissue , such that for a given sample y (for example, the injected virus library or a tissue sample), RC x , y is the absolute read count of variant x , N y is the total number of variants recovered and documentclass[12pt]{minimal} usepackage{amsmath} usepackage{wasysym} usepackage{amsfonts} usepackage{amssymb} usepackage{amsbsy} usepackage{mathrsfs} usepackage{upgreek} setlength{oddsidemargin}{-69pt} begin{document}$${overline{{rm{RC}}}}_{x,{y}}$$end{document} RC ¯ x , y is the normalized read count. To construct the CAP-Mac sequence clustering graph, we filtered the second-round NGS data based on the following criteria: (1) ≥100 read count in the injected library sample (24,186/33,314 variants), (2) ≥0.7 library enrichment score in more than two brain samples (415 variants) and (3) at least two more brain samples with ≥0.7 library enrichment than brain samples with less than −0.7 library enrichment (323 variants). To construct the CAP-C2 sequence graph, we filtered the second-round NGS data based on the following criteria: (1) ≥100 read count in the injected library sample and (2) both codon replicates present in at least two brain samples with ≥0.7 library enrichment (95 variants). These variants were then independently processed to determine pair-wise reverse Hamming distances ( https://github.com/GradinaruLab/mCREATE ) and clustered using Cytoscape (v. 3.9.0; RRID: SCR_003032) as described previously in detail 16 . Networks presented show capsid variants (nodes) connected by edges if the pair-wise reverse Hamming distance is ≥3. Cloning individual AAV capsid variants The details of this procedure can be found on protocols.io (10.17504/protocols.io.n2bvj87ebgk5/v1). For single-variant characterization, we cloned new variant plasmids by digesting a modified version of the pUCmini-iCAP-PHP.eB (Addgene ID: 103005; RRID: Addgene_103005) backbone using MscI and AgeI. We designed a 100 bp primer that contained the desired 21 bp insertion for each capsid variant and the regions complementary to the AAV9 template with ~20 bp overlapping the digested backbone. We then assembled the variant plasmid using NEBuilder HiFi DNA Assembly Master Mix, combining 5 μl of 200 nM primer with 30 ng of digested backbone in the reaction mixture. The capsid plasmid used to produce AAV.CAP-Mac is available on Addgene (Addgene ID: 200658; RRID: Addgene_200658).
Individual AAV production and purification
The details of this procedure can be found on protocols.io (10.17504/protocols.io.14egn2dqzg5d/v1). To produce variants for pool testing, we followed our previously published protocol 70 using 150 mm tissue culture dishes. For individual AAV.CAP-Mac and AAV9 characterization in vivo and in vitro, we adopted our published protocol to utilize ten-layer CellSTACKs (Corning, 3320) to efficiently produce viruses at a high titre to dose rhesus macaques and green monkeys. Specifically, we passaged twenty 150 mm dishes at approximately 70% confluency into a ten-layer CellSTACK 24 h before transfection. On the day of the transfection, we prepared the PEI–DNA transfection mixture for forty 150 mm dishes and combined the transfection mixture with media and performed a complete media change for the CellSTACK. We collected and changed the media at 72 h post-transfection similar to production in 150 mm dishes. At 120 h post-transfection, we added ethylenediaminetetraacetic acid (Invitrogen, 15575020) to a final concentration of 10 mM and incubated at 37 °C for 20 min, occasionally swirling and tapping the sides of the CellSTACK to detach the cells. We then removed the media and cell mixture and proceeded with the AAV purification protocol 70 . Of note, during the buffer exchange step after ultracentifugation, we used centrifugal protein concentrators with polyethersulfone membranes (Thermo Scientific, 88533) instead of Amicon filtration devices and used Dulbecco’s PBS supplemented with 0.001% Pluronic F-68 (Gibco, 24040032). Rodent experiments All the rodent procedures were performed at Caltech and were approved by the local IACUC. We purchased C57BL/6J (strain #: 000664; RRID: IMSR_JAX:000664), BALB/cJ (strain #: 000651; RRID: IMSR_JAX:000651) and DBA/2J (strain #: 000671; RRID: IMSR_JAX:000671) mice (all males, 6–8 weeks old) from The Jackson Laboratory. For IV administration in mice, we delivered 5 × 10 11 vg of virus through the retro-orbital sinus 70 , 71 using a 31 gauge insulin syringe (BD, 328438). See protocols.io for more details on retro-orbital injections of AAV in mice (10.17504/protocols.io.3byl4joy8lo5/v1). For intracerebroventricular (ICV) administration in mice, we injected 5.0 × 10 10 or 1.5 × 10 11 vg into the lateral ventricle. Briefly, we anaesthetized mice using isoflurane (5% for induction, 1–3% for maintenance) with 95% O 2 /5% CO 2 (1 l min − 1 ) and the mice were head fixed in a stereotaxic frame. After shaving the head and sterilizing the area with chlorohexidine, we subcutaneously administered 0.05 ml of 2.5 mg ml − 1 bupivacaine, and a midline incision was made and the skull was cleaned of blood and connective tissue. After levelling the head, burr holes were bilaterally drilled above the lateral ventricles (0.60 mm posterior to bregma and 1.15 mm from the midline). Viral vectors were aspirated into 10 µl NanoFil syringes (World Precision Instruments) using a 33 gauge microinjection needle, and the needle was slowly lowered into the lateral ventricle (1.6 mm from the pial surface). The needle was allowed to sit in place for approximately 5 min and 3–5 µl of viral vector was injected using a microsyringe pump (World Precision Instruments, UMP3) and pump controller (World Precision Instruments, Mircro3) at a rate of 300 nl min − 1 . All the mice intraoperatively received 1 mg kg − 1 of buprenorphine SR and 5 mg kg − 1 of ketoprofen subcutaneously and 30 mg kg − 1 of ibuprofen and 60 mg kg − 1 of trimethoprim/sulfamethoxazole for 5 days post-surgery. See protocols.io for more details on ICV injections of AAV in mice (10.17504/protocols.io.5qpvorm4dv4o/v1). After 3 weeks of expression, all the mice were perfused with PBS and fixed in 4% PFA. All the organs were extracted, incubated in 4.00% PFA overnight, transferred into PBS supplemented with 0.01% sodium azide and stored at 4 °C for long-term storage. We sliced the brain into 100 μm sections with a vibratome (Leica Biosystems, VT1200S), mounted in Prolong Diamond Antifade (Invitrogen, P36970 ) and imaged using a confocal microscope (Zeiss, LSM 880) using ZEN (Black edition). See protocols.io for more details on tissue handling (10.17504/protocols.io.5qpvormddv4o/v1 and 10.17504/protocols.io.j8nlkwxxwl5r/v1). Rhesus macaque experiments The details of the procedures in this section can be found on protocols.io (10.17504/protocols.io.5qpvormddv4o/v1). Neonate macaques (0.45–1.40 kg) were weaned at birth. Within the first month, macaques were infused with AAV vectors either intravenously or intrathecally. All adult macaques (8–17 years old; 4.65–11 kg) included in this study were infused with AAV via IV administration only. For IV injections, the animals were anaesthetized with ketamine (0.10 ml) and the skin over the saphenous vein was shaved and sanitized. AAV (between 2 × 10 13 and 1 × 10 14 vg kg − 1 ) was slowly infused into the saphenous vein over ~1 min in 30% sucrose for 24 h each at 4 °C and then embedded in O.C.T. compound and stored at −80 °C until cryosectioning. The tissue blocks were brought up to −20 °C in a cryostat before sectioning into 30 μm slices and dry mounted onto slides after cryosectioning. After sectioning, the slides were left at room temperature overnight to dry. To assist in neuron quantification, we stained sections with the following antibodies and concentrations: rabbit anti-GFP (1:100; Millipore-Sigma, cat # AB3080; RRID: AB_91337) and mouse anti-NeuN (A60) (1:500; Millipore-Sigma, cat # MAB377; RRID: AB_2298772). For secondary antibody staining, the following secondary antibodies and concentrations were used: donkey anti-rabbit Alexa Fluor 488 (1:500; Thermo Fisher Scientific, cat # A-21206; RRID: AB_2535792) and donkey anti-mouse Alexa Fluor 647 (1:500; Thermo Fisher Scientific, cat # A-31571; RRID: AB_162542). All the antibodies were diluted with 1× PBS supplemented with 0.25% Triton X-100 (PBST) and 5.00% normal donkey serum. Primary antibody incubations were left overnight at room temperature. Sections were then washed with PBST. Secondary antibody incubations were performed for 2 h at room temperature. The sections were washed thrice in PBST. The sections were incubated in DAPI solution (1:10,000; Invitrogen, D1306) at room temperature for 5 min and then washed. Sections were coverslipped using Prolong Diamond Antifade. Three sections per animal were stained and imaged. Each section was imaged in triplicate, with each region of interest having a total of nine images. Tissue regions of interest were imaged with a Keyence BZ-X800 with the following acquisition parameters: GFP (1/500 s), Cy5 (1 s), DAPI (1/12 s), high-resolution Z stack at 1.2 µm pitch. The following brain subregions were imaged: frontal, parietal, temporal, occipital cortices, cerebellum, caudate, putamen and thalamus (medial, ventral lateral and ventral posterior nuclei). A semi-automated cell-counting method was performed using ImageJ (RRID: SCR_003070) for quantification. Using thresholds and particle analysis, we quantified NeuN-positive and DAPI-positive cells. Using ImageJ’s cell counter, we manually counted GFP-positive cells as well as GFP and NeuN double-positive cells. iPSC experiments Neuronal cultures were produced by differentiating and maturing iPSC-derived neural progenitor cells with Stemdiff Forebrain Differentiation and Maturation kits (StemCell # 08600 and # 08605, respectively), according to their manufacturer’s protocols. Neural progenitor cells were produced by differentiation of the foreskin fibroblast-derived iPSC line: ACS-1019 (ATCC# DYS-0100; RRID: CVCL_X499), with Stemdiff SMADi Neural Induction kits (StemCell l#08581), selection with Stemdiff Neural Rosette Selection Reagent (StemCell l#05832) and expansion in Stemdiff Neural Progenitor Media (StemCell l#05833), according to their manufacturer’s protocols. Neurons were matured a minimum of 8 days before replating for transduction. Mature neuronal cultures, seeded 15,000 cells per well in polyornithine- and laminin-coated black-walled 96-well optical plates, were cultured for an additional 4 days before transduction. Replicate wells were transduced with virus serially diluted across six orders of magnitude in 90% maturation media and 10% OptiPRO SFM. Four days post-transduction, the cultures were fixed with 4% PFA and counterstained with 1 µg ml − 1 Hoechst 33322. The identification of transduced cells was determined by imaging 60 fields per well, using two-channel fluorescence detection (Hoechst, ex386/em440; eGFP, ex485/em521) on a CellInsight CX5 HCS Platform. Individual cells were identified by Hoechst detection of their nuclei and applying size- and contact-constrained ring masks to each cell. Cell transduction was determined by measuring the eGFP fluorescence above a threshold level within an individual ring mask. For each population, the percentage of transduced cells was plotted versus the applied dose. Curve fits and EC 50 values were determined with Prism GraphPad (RRID: SCR_002798) agonist versus response (three-parameter) regression method. To report per-cell eGFP expression efficiencies, the eGFP spot fluorescence intensities were averaged from each ring mask across a minimum of 5,000 cells per well. The curve fits were obtained using the Prism GraphPad Biphasic X as the concentration regression method.
Statistics and reproducibility
For the representative images, at least three separate slices from each sample were mounted for imaging. Within each brain region of a single animal, at least three different fields of view were taken (minimum field of view after tiling, 2.38 mm × 2.38 mm; slice thickness, 50 µm), equating to nine separate fields of view across three brain slices, to ensure consistency across imaging samples. Reporting summary Further information on research design is available in the Nature Portfolio Reporting Summary linked to this article.
Online content Any methods, additional references, Nature Portfolio reporting summaries, source data, extended data, supplementary information, acknowledgements, peer review information; details of author contributions and competing interests; and statements of data and code availability are available at 10.1038/s41565-023-01419-x.
Supplementary information Supplementary Information Supplementary Fig. 1 and Tables 1–6. Reporting Summary Source data Source Data Fig. 2 Statistical source data. Source Data Fig. 3 Statistical source data. Source Data Fig. 5 Statistical source data. Source Data Fig. 6 Statistical source data. Source Data Extended Data Fig. 2 Statistical source data. Source Data Extended Data Fig. 3 Statistical source data. Source Data Extended Data Fig. 6 Statistical source data. Source Data Extended Data Fig. 7 Statistical source data.
Supplementary information The online version contains supplementary material available at 10.1038/s41565-023-01419-x.
📊 Figures
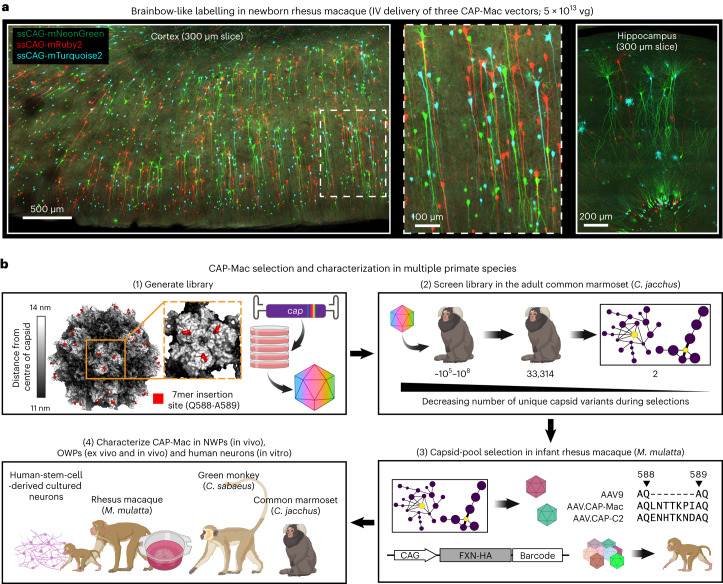
Fig. 1
CAP-Mac selection and characterization strategy.
a , AAV.CAP-Mac is a novel vector that enables brain-wide, systemic gene transfer in NHPs. Representative images are shown from a newborn rhesus macaque brain expressing three fluorescent reporters de...
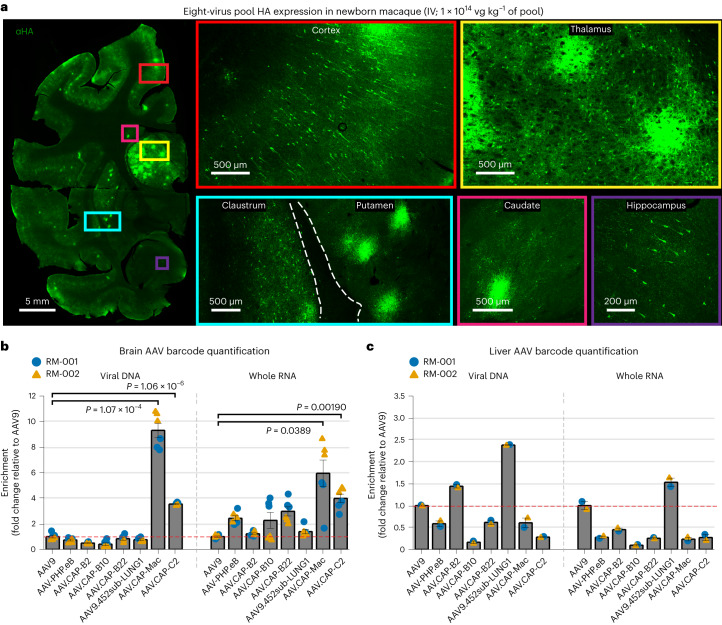
Fig. 2
CAP-Mac outperforms other engineered variants in newborn rhesus macaque in pool testing.
a , Representative images of the expression in cortex, thalamus, caudate nucleus, putamen, hippocampus and claustrum after IV administration of 1u2009u00d7u200910 14 vgu2009kg u2212 1 of an eight-caps...
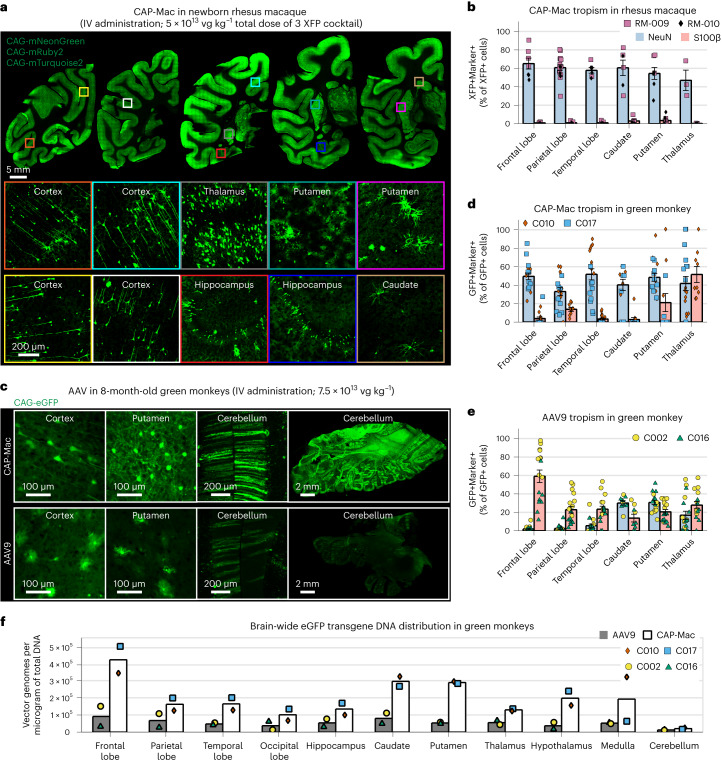
Fig. 3
CAP-Mac is biased towards neurons throughout infant green monkey and newborn rhesus macaque brains.
a , Distribution of IV CAP-Mac expression in 2-day-old rhesus macaques (5u2009u00d7u200910 13 vgu2009kg u2212 1 via the saphenous vein) across coronal slices showing fluorescent reporter expression (s...
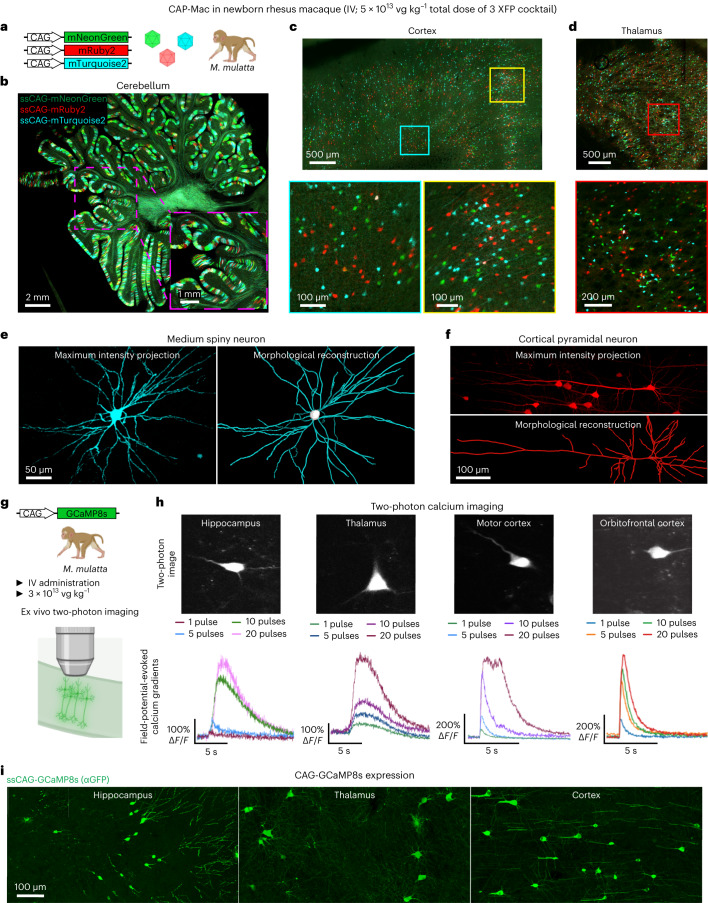
Fig. 4
Experimental utility of CAP-Mac for interrogation of the newborn rhesus macaque brain.
a u2013 f , CAP-Mac packaging three fluorescent reporters ( a ) to generate Brainbow-like labelling in rhesus macaque cerebellum ( b ), cortex ( c ) and thalamus (lateral geniculate nucleus) ( d ), en...
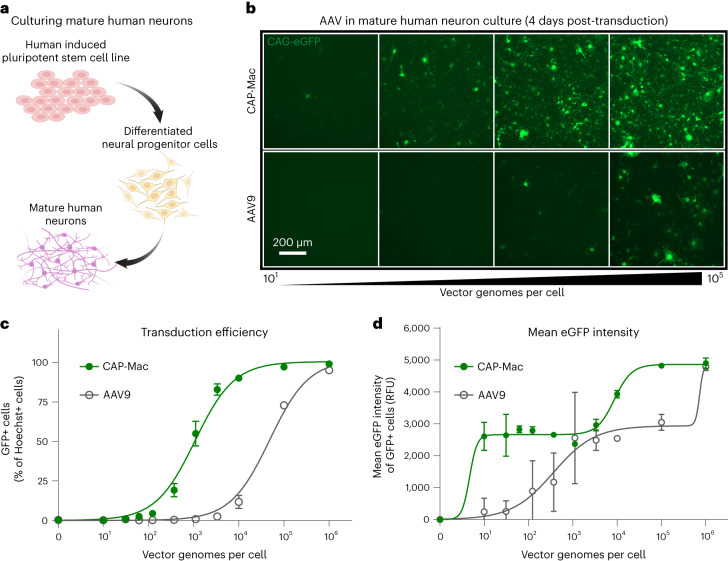
Fig. 5
CAP-Mac is more potent in human cultured neurons compared with AAV9.
a , Differentiation process starting with an iPSC line that was differentiated into neural progenitor cells, which were further differentiated into mature neurons. b , Representative images of culture...
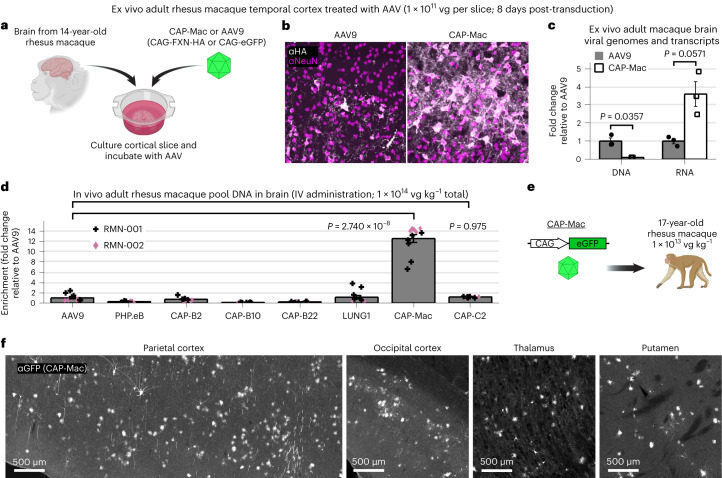
Fig. 6
Characterization in adult rhesus macaque.
a , AAV in ex vivo cortical slice taken from a 14-year-old rhesus macaque. b , CAP-Mac is more efficient at transducing neurons in the grey matter of the cortex. c , Quantification demonstrates that C...
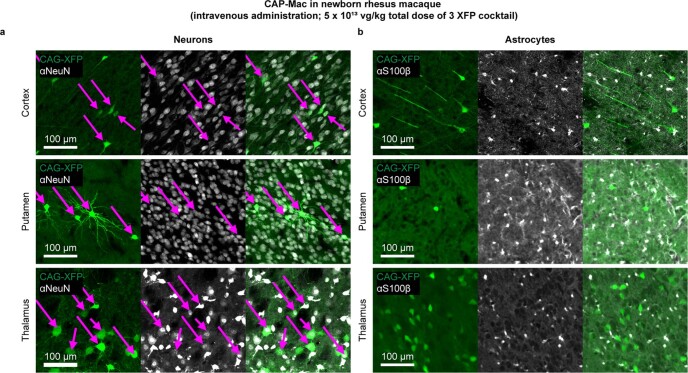
Extended Data Fig. 1
CAG-XFP co-localization with cell-type-specific histological markers.
a , b , Representative images of a cocktail of 3 fluorescent proteins under control of CAG in newborn rhesus macaque tissue with histological markers for neurons (NeuN, a ) and astrocytes (S100u03b2, ...
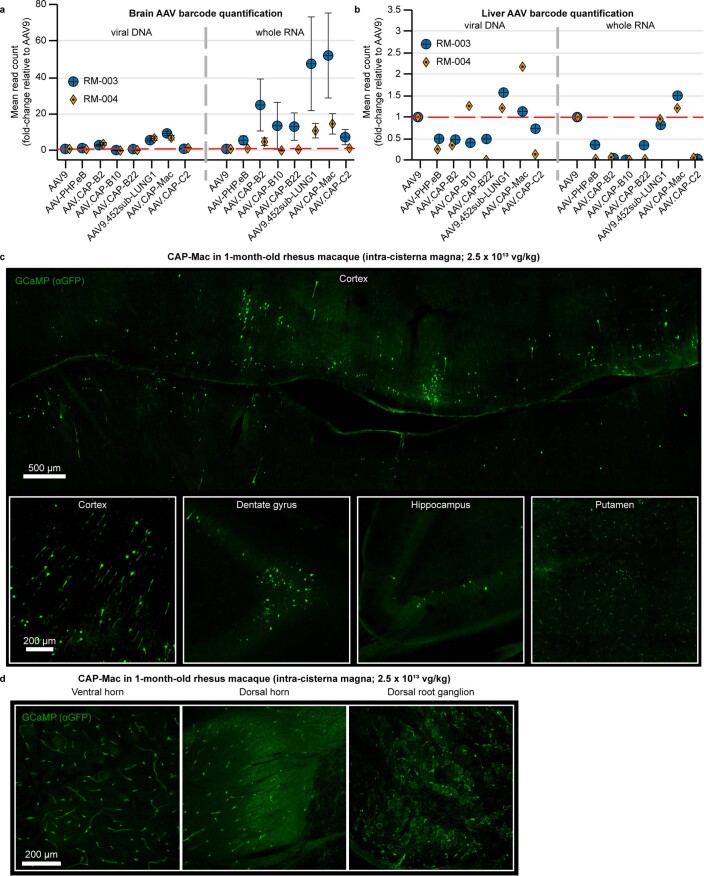
Extended Data Fig. 2
Administering AAV via intra-cisterna magna administration.
a , b , Barcode quantification in viral DNA and whole RNA from brain ( a ) and liver ( b ) of neonate rhesus macaques (nu2009=u20092 macaques) treated with a capsid pool via intra-cisterna magna admin...
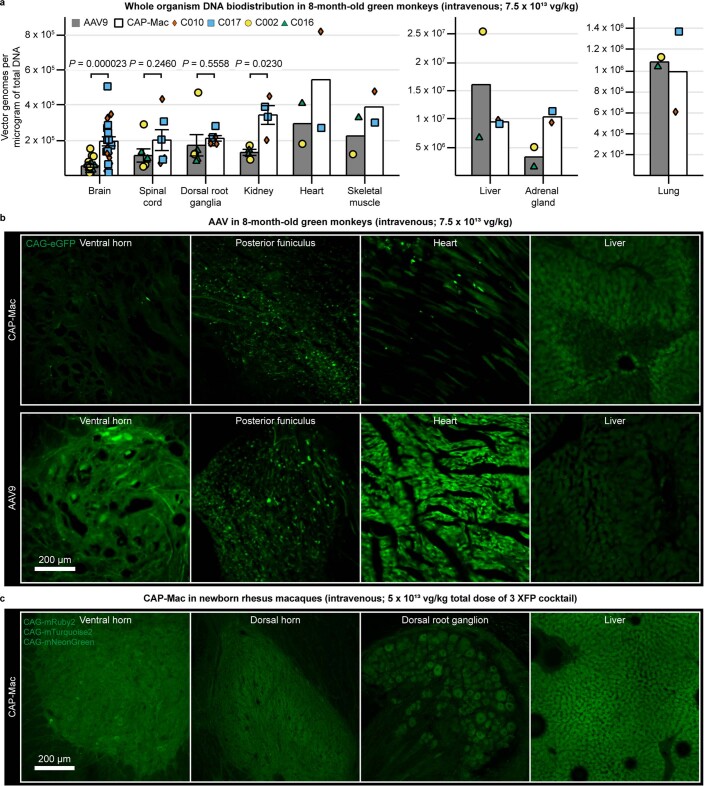
Extended Data Fig. 3
CAG-XFP expression in non-brain tissue of Old World primates treated with AAV.
a , Vector genomes per microgram of total DNA in green monkeys treated with AAV9 (nu2009=u20092 green monkeys) or CAP-Mac (nu2009=u20092 green monkeys), expressed as fold-change relative to mean AAV9....
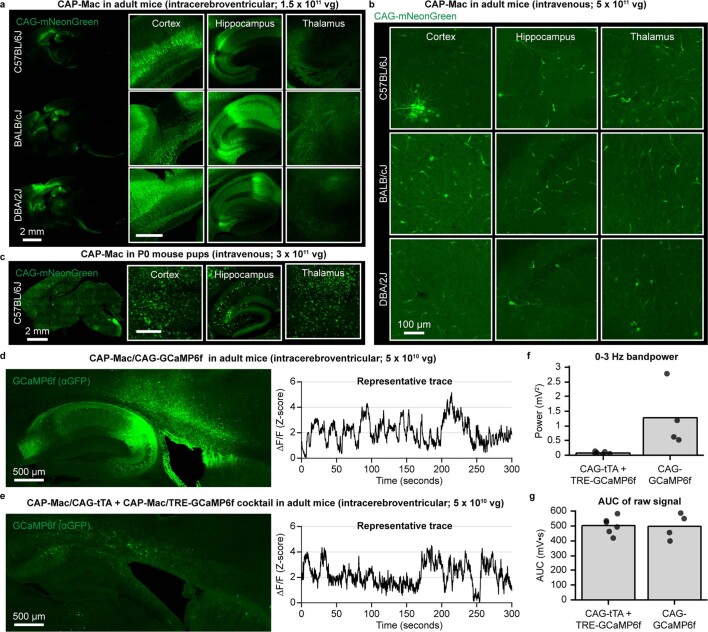
Extended Data Fig. 4
Tropism in mice and utilizing mice as a model organism for cargo validation.
a , CAP-Mac after intracerebroventricular (ICV) administration in adult mice primarily transduces neurons, mimicking the CAP-Mac tropism in infant Old World primates after intravenous (IV) administrat...
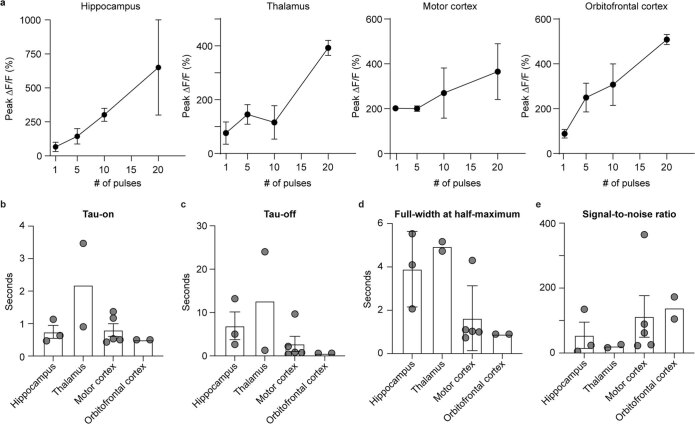
Extended Data Fig. 5
Group-level analyses of two-photon calcium imaging in rhesus macaque slice.
a , Mean peak u0394F/F 0 evoked by cells from hippocampus, thalamus, motor cortex, and orbitofrontal cortex after applying different numbers of pulses. b , Mean rise time of GCaMP8s responses in the f...
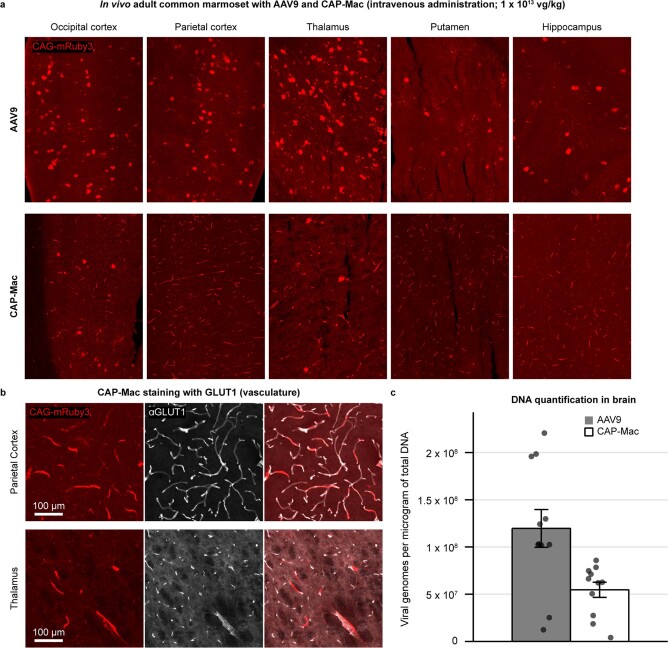
Extended Data Fig. 6
CAP-Mac tropism in adult common marmoset compared to AAV9.
a , AAV9 and CAP-Mac tropism in two adult marmosets in vivo (3.8- and 5.8-years-old). b , CAP-Mac is biased primarily towards GLUT1+ cells (vasculature), consistent with our results in adult mice. c ,...
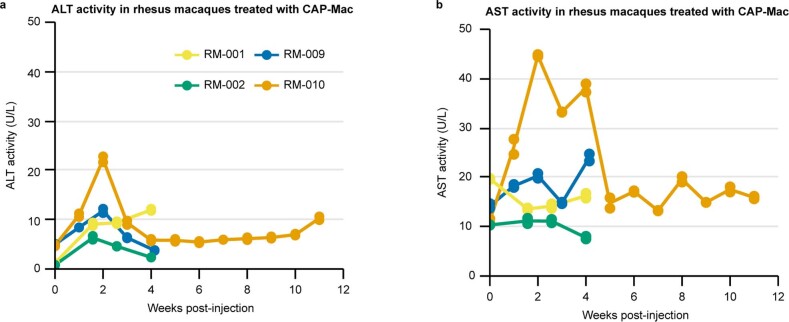
Extended Data Fig. 7
Liver function tests in newborn rhesus macaques treated with AAV.
a , b , Liver function tests show no abnormal signs of adverse liver functionality, as measured by alanine transaminase (ALT; a ) and aspartate transaminase (AST; b ) activity. Source data
Figure images are served from the NIH/NLM PubMed Central Open Access Subset or Europe PMC; copyright remains with the publishers and authors.
💬 Discussion
0 commentsNo comments yet. Be the first to start a discussion!
Leave a Comment