Abstract
Older concepts of a hard-wired adult brain have been overturned in recent years by in vivo imaging studies revealing synaptic remodeling, now thought to mediate rearrangements in microcircuit connectivity. Using three-color labeling and spectrally resolved two-photon microscopy, we monitor in parallel the daily structural dynamics (assembly or removal) of excitatory and inhibitory postsynaptic sites on the same neurons in mouse visual cortex in vivo. We find that dynamic inhibitory synapses often disappear and reappear again in the same location. The starkest contrast between excitatory and inhibitory synapse dynamics is on dually innervated spines, where inhibitory synapses frequently recur while excitatory synapses are stable. Monocular deprivation, a model of sensory input-dependent plasticity, shortens inhibitory synapse lifetimes and lengthens intervals to recurrence, resulting in a new dynamic state with reduced inhibitory synaptic presence. Reversible structural dynamics indicate a fundamentally new role for inhibitory synaptic remodeling--flexible, input-specific modulation of stable excitatory connections.
🔬 Techniques
💻 Software
✨ Fluorophores
🧪 Sample Preparation
🔬 Cell Lines
🏭 Microscope Brands
🧪 Reagent Suppliers
🔴 Lasers
🔎 Objectives
💻 Software Details
💾 Data Repositories
🏷️ Research Resource Identifiers (RRIDs)
Verified research resources used in this paper:
🏛️ Research Organizations (ROR)
Affiliated research institutions:
📋 Methods
Generation of Expression Plasmids The Cre-dependent eYFP and Teal-gephyrin plasmids (pFUdioeYFPW, pFUdioTealGephyrinW) have been described previously in ( Chen et al., 2012 ), and the Cre plasmid in ( Subramanian et al., 2013 ). To generate a Cre-dependent PSD-95-mCherry within a dio cassette, PSD-95 lacking a stop codon was first amplified with an added 5’Nhe1 site from pFuPSD-95-TealW (gift from Jerry Chen), then cloned into pcDNA3 (Invitrogen) between the KpnI and EcoRI sites, to create pcDNA3-PSD-95 . mCherry was amplified from pcDNA3.3-mCherry (Addgene) with an added 3’AgeI site, then cloned into pcDNA3-PSD-95 between the EcoRI and XhoI sites to make pcDNA3-PSD-95-mCherry . PSD-95-mCherry was then removed by NheI and AgeI digestion and subcloned into the Cre dependent plasmid pFudio-AscI-AgeI-NheIW , generated by replacing eYFP in pFudio-eYFPW with a linker sequence containing the AgeI restriction site. The vector backbone used for all our expression constructs is the lentivirus transfer vector pFUGW. This is not a strong expression vector and therefore likely expresses at lower levels than more conventional expression constructs. This is an advantage when expressing synaptic markers, and explains the lack of synaptic artifacts frequently seen in other systems, in particular with PSD-95 expression, such as increases in synapse number or stability. In Utero Electroporation All animal experiments were approved by the Massachusetts Institute of Technology Committee on Animal Care and meet the National Institute of Health guidelines for the use and care of vertebrate animals. In utero electroporation on E15.5 timed pregnant C57BL/6J mice was performed to label L2/3 cortical pyramidal neurons, as previously described ( Tabata and Nakajima, 2001 ). Animals were co-electroporated with Cre-dependent constructs expressing eYFP, PSD-95-mCherry, or Teal-gephyrin along with a plasmid expressing Cre recombinase at a ratio of 10:10:5:1, respectively (total DNA concentration 2 µg/µL), with 0.1% Fast Green for visualization. A total of 0.75 µl of the plasmid solution was injected into the right lateral ventricle with a 32 gauge Hamilton syringe (Hamilton Company, Reno, NV, USA). Five pulses of 36V (duration 50 ms, frequency 1 Hz) targeting the visual cortex were delivered from a square wave electroporator (ECM830; Harvard Apparatus, Holliston, MA, USA) using 5 mm diameter platinum electrodes (Protech International, Boerne, TX, USA).
Show full methods section
Generation of Expression Plasmids The Cre-dependent eYFP and Teal-gephyrin plasmids (pFUdioeYFPW, pFUdioTealGephyrinW) have been described previously in ( Chen et al., 2012 ), and the Cre plasmid in ( Subramanian et al., 2013 ). To generate a Cre-dependent PSD-95-mCherry within a dio cassette, PSD-95 lacking a stop codon was first amplified with an added 5’Nhe1 site from pFuPSD-95-TealW (gift from Jerry Chen), then cloned into pcDNA3 (Invitrogen) between the KpnI and EcoRI sites, to create pcDNA3-PSD-95 . mCherry was amplified from pcDNA3.3-mCherry (Addgene) with an added 3’AgeI site, then cloned into pcDNA3-PSD-95 between the EcoRI and XhoI sites to make pcDNA3-PSD-95-mCherry . PSD-95-mCherry was then removed by NheI and AgeI digestion and subcloned into the Cre dependent plasmid pFudio-AscI-AgeI-NheIW , generated by replacing eYFP in pFudio-eYFPW with a linker sequence containing the AgeI restriction site. The vector backbone used for all our expression constructs is the lentivirus transfer vector pFUGW. This is not a strong expression vector and therefore likely expresses at lower levels than more conventional expression constructs. This is an advantage when expressing synaptic markers, and explains the lack of synaptic artifacts frequently seen in other systems, in particular with PSD-95 expression, such as increases in synapse number or stability. In Utero Electroporation All animal experiments were approved by the Massachusetts Institute of Technology Committee on Animal Care and meet the National Institute of Health guidelines for the use and care of vertebrate animals. In utero electroporation on E15.5 timed pregnant C57BL/6J mice was performed to label L2/3 cortical pyramidal neurons, as previously described ( Tabata and Nakajima, 2001 ). Animals were co-electroporated with Cre-dependent constructs expressing eYFP, PSD-95-mCherry, or Teal-gephyrin along with a plasmid expressing Cre recombinase at a ratio of 10:10:5:1, respectively (total DNA concentration 2 µg/µL), with 0.1% Fast Green for visualization. A total of 0.75 µl of the plasmid solution was injected into the right lateral ventricle with a 32 gauge Hamilton syringe (Hamilton Company, Reno, NV, USA). Five pulses of 36V (duration 50 ms, frequency 1 Hz) targeting the visual cortex were delivered from a square wave electroporator (ECM830; Harvard Apparatus, Holliston, MA, USA) using 5 mm diameter platinum electrodes (Protech International, Boerne, TX, USA).
Cranial Window Implantation
After in utero electroporation, pups were reared to adulthood (P42-57) and implanted with a 5 mm cranial window over the right hemisphere, as described ( Lee et al., 2008 ). Sulfamethoxazole (1 mg/ml) and trimethoprim (0.2 mg/ml) were chronically administered in the drinking water to maintain optical clarity of implanted windows.
Optical Intrinsic Signal Imaging
To identify binocular visual cortex, optical imaging of intrinsic signal and data analysis were performed as described previously ( Kalatsky and Stryker, 2003 ). Mice were anesthetized and maintained on 0.25%−0.75% isofluorane and secured in a stereotaxic frame. A horizontal bar (5° in height and 73° in width) drifting upward with a periodicity of 12 s was presented for 60 cycles on a high refresh rate monitor 25 cm in front of the animal. Optical images of visual cortex were acquired continuously under 610 nm illumination with an intrinsic imaging system (LongDaq Imager 3001/C; Optical Imaging Inc., New York, NY, USA) through a 2.5x/0.075 NA objective (Zeiss, Jena, Germany). Images were spatially binned by 4×4 pixels for analysis and cortical intrinsic signal was computed by extracting the Fourier component of light reflectance changes matched to stimulus frequency. Response magnitude was the fractional change in reflectance, and the magnitude maps were thresholded at 30% of peak response amplitude. Binocular visual cortex was delineated upon stimulation of the ipsilateral eye only.
Two-photon imaging
Animals were allowed 2 weeks for recovery after cranial window surgery. When windows cleared, labeled cells in binocular visual cortex were screened for the presence of all 3 fluorescent labels. Cells that exhibited high background labeling with synaptic labels or any ectopic clumps of synaptic proteins were not used for experiments. This selection process ensured that all imaged cells had similar levels of fluorescent labeling. Only one cell was imaged per animal. For eight mice with normal visual experience in vivo two-photon imaging was performed daily for 9 consecutive sessions using a custom-built microscope with custom acquisition software to enable triple color imaging. For each imaging session, mice were anesthesized with isofluorane (0.75%-1.25%) and secured in a stereotaxic frame. Fluorophores were simultaneously excited with a commercial Mai Tai HP Ti: Sapphire laser (Spectra-Physics, Santa Clara, CA, USA) at 915 nm to excite eYFP and Teal, and a Chameleon Compact OPO (Coherent, Santa Clara, CA, USA) at 1085 nm to excite mCherry. The outputs of the two excitation lasers were combined at a polarized beam splitter with orthogonal polarization directions, and delivered to the two-photon microscope through the same beam path. After scanning with a galvonometric XY-scanning mirrors (6215H, Cambridge Technology) and a piezo actuator Z-positioning system (Piezosystem Jena, Jena, Germany), the two laser beams were focused by a 20x/1.0 NA water immersion objective lens (W Plan-Apochromat; Zeiss, Jena, Germany) to the same focal volume location in the specimen, within one pixel size accuracy. These lasers produce ~100 fs unsynchronized pulses at a rate of 80 MHz. The power delivered by each laser to the specimen ranged from approximately 35–50 mW depending on imaging depth. The emission signals from the three fluorophores were collected by the same objective lens, passed through an IR blocking filter (E700SP; Chroma Technology, Bellows Falls, VT, USA), and were separated according to their emission spectra by dichroic mirrors at 520 nm and 560 nm. After passing through three independent bandpass filters (485/70m, 550/100m, and 605/75m) the three emission signals were collected simultaneously onto 3 separate PMTs. Imaging for synapse monitoring was performed at high resolution (250 nm/pixel XY-resolution, 0.9 µm/frame Z-resolution). Two-photon raw scanner data was processed for spectral linear unmixing and converted into a RGB image z-stack using Matlab and ImageJ (National Institutes of Health, Bethesda, MD, USA). Monocular Deprivation Monocular deprivation was performed by eyelid suture immediately after the first imaging session. Mice were anesthetized with 2% isoflurane, lid margins were trimmed and triple antibiotic ophthalmic ointment (Bausch & Lomb, Rochester, NY, USA) was applied to the eye. Four to five individual stitches were placed using 6-0 vicryl along the extent of the trimmed lids. Daily imaging sessions were performed for six additional sessions after MD. Suture integrity was inspected directly prior to each imaging session. Animals whose eyelids did not seal fully or had reopened were excluded from further experiments. A total of seven mice with successful MD and no photobleaching were used for analysis.
Spectral Linear Unmixing and Image Processing
Spectral linear unmixing for three colors was performed using a similar approach as previously described for two color unmixing ( Chen et al., 2012 ). Briefly, spectral linear unmixing is based on the fact that the total photon count at each pixel in a given channel is the linear sum of the spectral contribution of each fluorophore weighted by its abundance. For a triple channel detection system, the contribution of three fluorophores can be represented by the following equations. J 1 (x,y)=s 1.1 x I 1 (x,y) + s 1.2 x I 2 (x,y) + s 1.3 x I 3 (x,y) J 2 (x,y)=s 2.1 x I 1 (x,y) + s 2.2 x I 2 (x,y) + s 2.3 x I 3 (x,y) J 3 (x,y)=s 3.1 x I 1 (x,y) + s 3.2 x I 2 (x,y) + s 3.3 x I 3 (x,y) Where J is the total signal per channel, I is the fluorophore abundance, and S is the contribution of that fluorophore. These equations can be expressed as a matrix: [J]=[S][I], whereby the unmixed image [I] can be calculated using the inverse matrix of S: [I]=[S] −1 [J]. Assuming the detected signal in both channels represents the total spectral contribution for all three fluorophores: s 1.1 + s 2.1 + s 3.1 = 1 s 1.2 + s 2.2 + s 3.2 = 1 s 1.3 + s 2.3 + s 3.3 = 1 [S] was determined experimentally from two-photon images of HEK cell cultures expressing single fluorophores and excited by both lasers at the same wavelengths used in vivo . Average laser power was adjusted to achieve photon count levels approximating in vivo signal intensity. We have previously shown that S derived from cell culture and in vivo data is interchangeable ( Chen et al., 2012 ). The mean contribution for each fluorophore into each channel (s 1.1 – 3.3 ) was calculated using Matlab (Mathworks, Natick, MA, USA). These values were subsequently used for spectral linear unmixing of triple channel two-photon raw scanner data into a RBG image z-stack using Matlab and ImageJ (National Institutes of Health). For all figures, images are filtered and interpolated for optimal visualization. 3D image stacks are converted into maximum intensity z-projections where noted in figure legends.
Data Analysis
Dendritic spines, PSD-95 containing excitatory synapses, and inhibitory synapses were scored manually with a custom-written 4D point tracking system implemented in Fiji ( Schindelin et al., 2012 ) using a modified version of the ObjectJ plugin ( https://sils.fnwi.uva.nl/bcb/objectj/index.html ). To avoid individual scoring bias, each cell was independently scored by two investigators. Dendritic spine analysis criteria was defined as previously described ( Chen et al., 2012 ; Holtmaat and Svoboda, 2009 ). Because of the bright labeling on the soma and axon initial segment, individual contacts in these regions could not be resolved and analysis was restricted to dendrites starting approximately 40 microns from the soma to the most distal tips. Because z-projecting spines lacking PSD-95 could not be visualized, for consistency, all z-projecting spines were excluded from analysis, even those which contained PSD-95. Gephyrin puncta were scored as synapses if they were at least 3×3 pixels, or 8 – 9 clustered pixels (0.56 µm 2 ) in size, with a minimal average signal intensity of at least four times above shot noise background levels, and were present in 2 consecutive z planes. PSD-95 puncta were scored as synapses if they were least 2×2 pixels, or 4–5 clustered pixels (0.27 µm 2 ) in size with a minimal average signal intensity of at least four times above shot noise background levels and were present in 2 consecutive z planes. Previous EM validation confirmed that these criteria represent inhibitory and excitatory synapses, respectively ( Cane et al., 2014 ; Chen et al., 2012 ). In general, the PSD-95-mCherry fluorophore was more prone to bleaching than YFP or Teal-gephyrin. Cells that lost PSD-95-mCherry were not analyzed further. One-time dynamic changes were defined as any structure that changed one time and never changed again. Changes were scored as transient if a structure was added and later removed in a subsequent imaging session. Changes were scored as recurrent if structures appeared, then disappeared, and then appeared again at the same site; or conversely, ever disappeared and then reappeared more than once in the same location. At least 25 spines and synapses were counted per branch and at least 200 structures were counted per animal. Dendritic arbors were manually traced in Neurolucida (MicroBrightField, Inc., Williston, VT, USA) to quantify the length of scored branches. In the normal experience dataset, we tracked a total of 1555 spines and 955 inhibitory synapses on 62 dendritic segments from 8 animals. These included 30 basal, and 32 apical dendrites, with a combined branch length of 3.01 mm, 1.63mm basal and 1.42mm apical. Analysis for 1 animal was restricted to sessions 1–7 and another to sessions 1–6 due to photo-bleaching of PSD-95-mCherry in later sessions. The animal with 6 sessions was not included in the comparisons with the MD cells. In the MD dataset, 1500 spines and 1273 inhibitory synapses were tracked over 7 consecutive imaging sessions. In all, 43 dendritic segments from 7 animals, 22 basal and 21 apical dendrites, with a combined branch length of 2.83mm, 1.54mm basal and 1.29mm apical. All comparisons between MD and Normal Experience datasets were done using only the first 7 imaging sessions of all cells. For statistical analyses of all the imaging data related to dynamics ( Fig. 2A–B ; 3A–B, F ; 6D–E ,) each “n” represents a cell (each from an individual animal). Spine size calculations were performed by placing a 5×5 pixel box in the most prominent z frame around the spine head, subtracting background fluorescent levels and normalizing to the average dendritic shaft intensity, as performed in ( Holtmaat et al., 2005 ). Cumulative probability distributions were calculated in Matlab and significance was determined by a two-sample Kolmogorov-Smirnov test.
Serial Section Electron Microscopy
To demonstrate that Teal-gephyrin and PSD-95-mCherry puncta visualized in vivo correspond to synapses, we performed serial section immuno-EM on in vivo imaged L2/3 pyramidal neuron dendrites labeled with eYFP, Teal-gephyrin, and PSD-95-mCherry. Immediately after two-photon imaging, the brain was fixed with 4% paraformaldehyde, 1% glutaraldehyde and 0.2 % picric acid in 0.1 M PB, cut to 50 µm sections, and stained with an antiserum to GFP (1:2000 dilution, rabbit antiserum, gift from Dr. Tamamaki, Kyoto University, RRID: AB 2314554) followed by a biotin-conjugated secondary (Vector Laboratories Cat# BA-1000, RRID: AB_2313606) and then detected with nickel diaminobenzidine (Ni-DAB). Tissue was then flat-embedded in Epon. Four dendritic segments with identifiable DAB staining were relocated and then further investigated using a combined FIB/SEM (Focused Ion Beam / Scanning Electron Microscope)( Kubota et al., 2011 ). For EM observation, the Epon block containing the dendritic segments was glued to a stainless-steel sample holder using silver paste to avoid charging the epoxy. The top surface was coated by several 10 nm thick layers of iridium using a sputter coater. The mounted block was transferred in a FIB/SEM, (Hitachi MI4000L, Tokyo, Japan) which contains two beams that intersect at a right angle.The dendritic segments were identified by SEM imaging on the top surface of the block using guidance lines intersecting at right angles that were etched shallowly using the FIB, and by comparing this to light microscopy images obtained earlier. The top region was protected by ion beam induced deposition of platinum (52um*20um area, 1nA ion beam current, 900 sec deposition time). After the coarse milling process by the FIB, the freshly exposed surface of the block was imaged at 1 kV acceleration potential and 1nA beam current using the in-lens detector with 10 µsec dwell time/pixel. High resolution imaging was achieved by low kV imaging and detection of the secondary electrons of the stained tissue surface. Using contrast inversion, TEM-like contrast and comparable imaging information was obtained. Using the ‘Multi-Cut & See’ function, seven adjacent images of 2000 × 2000 store resolution were acquired serially after milling the block surface at 12 nm z-steps. Between 1183 and 1641 serial section images were acquired for each image stack. The milling time was 26 seconds/slice and, the imaging time was about 40 sec/image. In total, the image acquisition took 7 days. The serial image alignment was done using a homemade script for Matlab (kindly provided by Dr. Shawn Mikula, Max Planck Institute, Heidelberg, Germany). The dendritic and synaptic structures were rendered using the 3D reconstruction software, Reconstruct( Fiala, 2005 ) (available at http://synapses.clm.utexas.edu/tools/index.stm ). Synapses were scored according to 3 criteria, the presence of a postsynaptic density, the aggregation of small synaptic vesicles within the presynaptic terminal, and a clear synaptic cleft structure between the pre and postsynaptic membranes at a distance of approximately 20 nm between two parallel membranes. Contacts with DAB staining obscuring the postsynaptic compartment were only categorized as synapses if at least two of these criteria were present, in three consecutive serial ultrathin sections.
Preparation of organotypic slice cultures and DNA transfection
Organotypic slice cultures from mouse visual cortex were prepared from P3-P4 C57BL/6 mice ( Stoppini et al., 1991 ), and transfected 3–4 days before imaging/uncaging experiments using biolistic gene transfer (180 psi)( Woods and Zito, 2008 ). The same Cre-dependent Teal-gephyrin, and Cre plasmids used for the in vivo studies were coated onto 6–7 mg of gold particles together with a tdTomato plasmid ( Kwon et al., 2012 ) for cell fill (12 µg of tdTomato, 18 µg of Teal-gephyrin, and 16 µg of Cre).
Two-photon slice imaging and GABA uncaging
Imaging and uncaging were performed at 19–22 days in vitro (DIV) on transfected layer 2/3 pyramidal neurons within 40 µm of the slice surface at room temperature in recirculating artificial cerebrospinal fluid (ACSF; in mM: 127 NaCl, 25 NaHCO3, 1.25 NaH2PO4, 2.5 KCl, 25 D-glucose, aerated with 95% O2 /5 % CO2) in the presence of 2 mM CaCl2, 1 mM MgCl2, 1 mM CDNI-GABA, and 0.001 mM TTX. For each neuron, image stacks (512 × 512 pixels; 0.035 µm / pixel) with 1 µm z-steps were collected from one segment of secondary or tertiary apical dendrites 30–50 µm from the soma using a two-photon microscope (Prairie Technologies, Inc) with a pulsed Ti::sapphire laser (Mai Tai DeepSee, Spectra Physics) tuned to 930 nm (2–2.5 mW at the sample). To record uncaging-evoked inhibitory postsynaptic currents (uIPSCs), layer 2/3 pyramidal neurons were patched in voltage-clamp configuration (electrode resistances 5–8 MΩ, Vhold = +10 mV) using cesium-based internal solution (in mM: 135 Cs-methanesulfonate, 10 HEPES, 10 Na2 phosphocreatine, 4 MgCl2, 4 Na2-ATP, 0.4 Na-GTP, 3 Na L-ascorbate, 0.02 Alexa 594, ~300 mOsm, ~pH 7.25) in ACSF. For GABA uncaging, 720 nm light was delivered 0.5 µm away from the target spine with a power of 18~20 mW for 3 ms. uIPSC amplitudes from individual spines were quantified as the average of 8–10 pulses at 0.15 Hz. Teal-gephyrin expression level in individual spines was measured from background-subtracted and bleed-through-corrected green fluorescence intensities using the integrated pixel intensity of a boxed region of interest (ROI) surrounding the spine head, as described ( Woods et al., 2011 ). In brief, relative Teal-gephyrin enrichment in spines was calculated by normalizing the green fluorescence intensities (as described above) for each individual spine to the mean green fluorescence intensities measured from four ROIs on the dendritic shaft: “spine with gephyrin” (expression level > mean ) vs. “spine lacking gephyrin” (expression level < mean). Statistical analysis was done with ‘n’ representing number of cells
📊 Figures
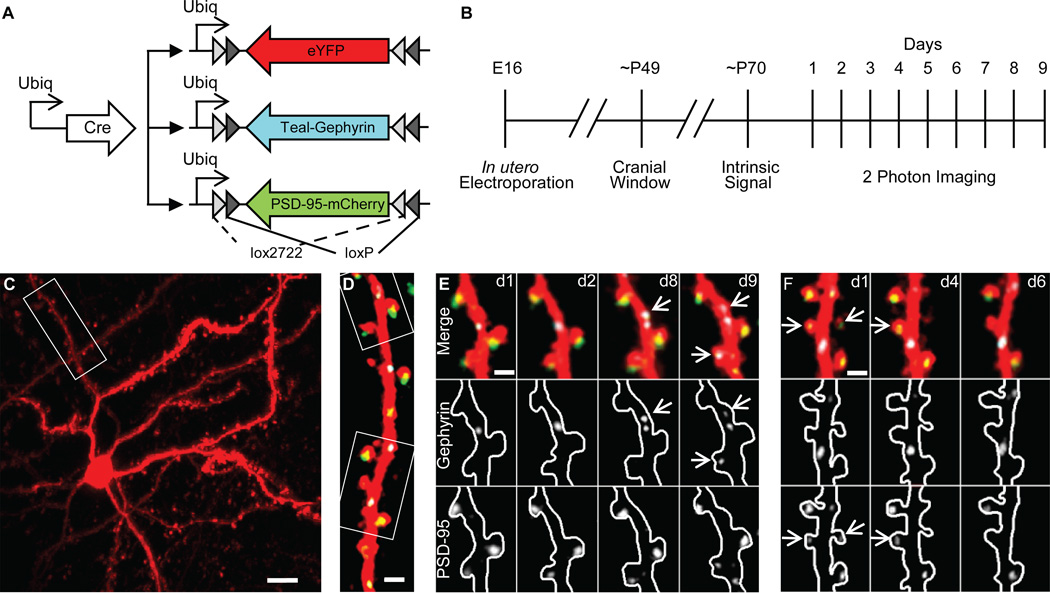
Figure 1
Triple color labeling of L2/3 pyramidal cells in vivo
(A) Plasmid combination for labeling cell fill (eYFP), inhibitory synapses (Teal-gephyrin), and excitatory synapses (PSD-95-mCherry). (B) Experimental time course. (C) Low-magnification maximum z-proj...
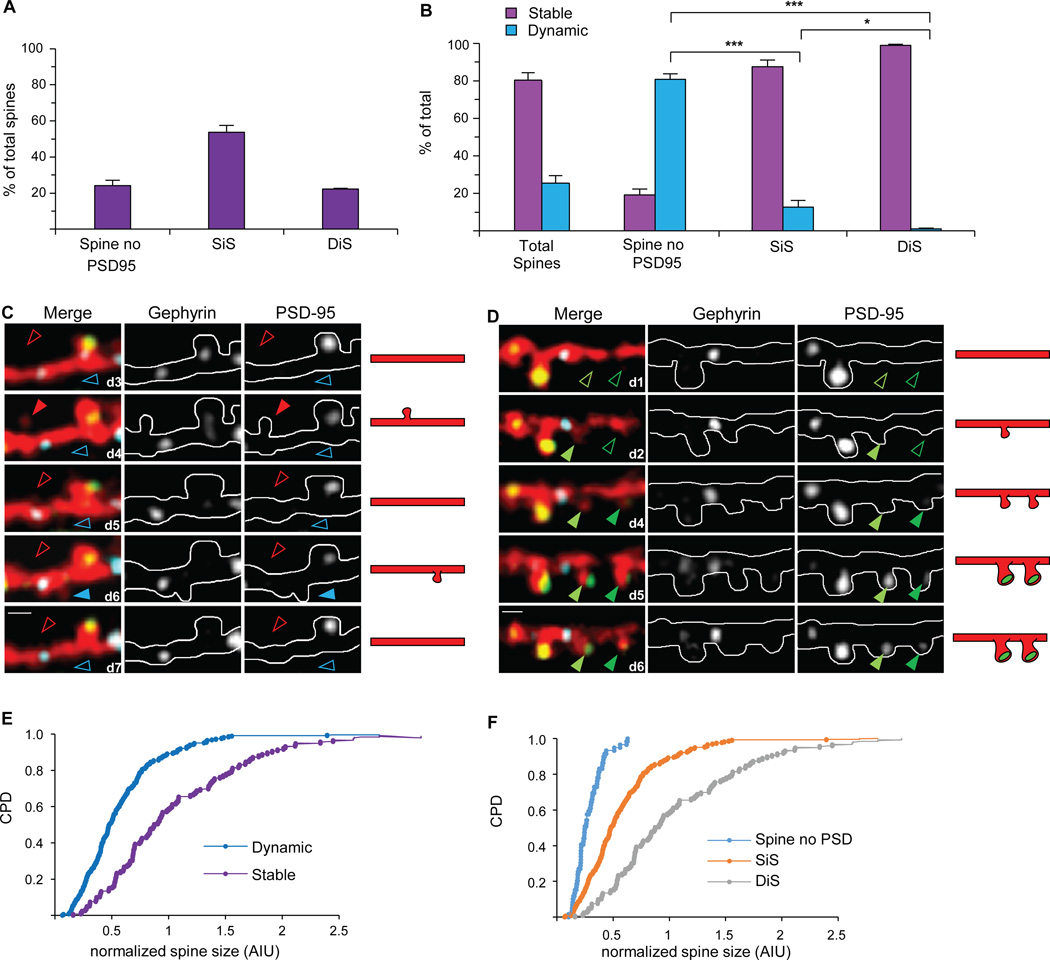
Figure 2
Triple color imaging resolves three spine types with distinct properties
(A) Proportion of spines without PSD-95, singly innervated spines (SiS) containing only PSD-95, and dually innervated spines (DiS) containing both PSD-95 and gephyrin. (B) Fraction of each subclass wh...
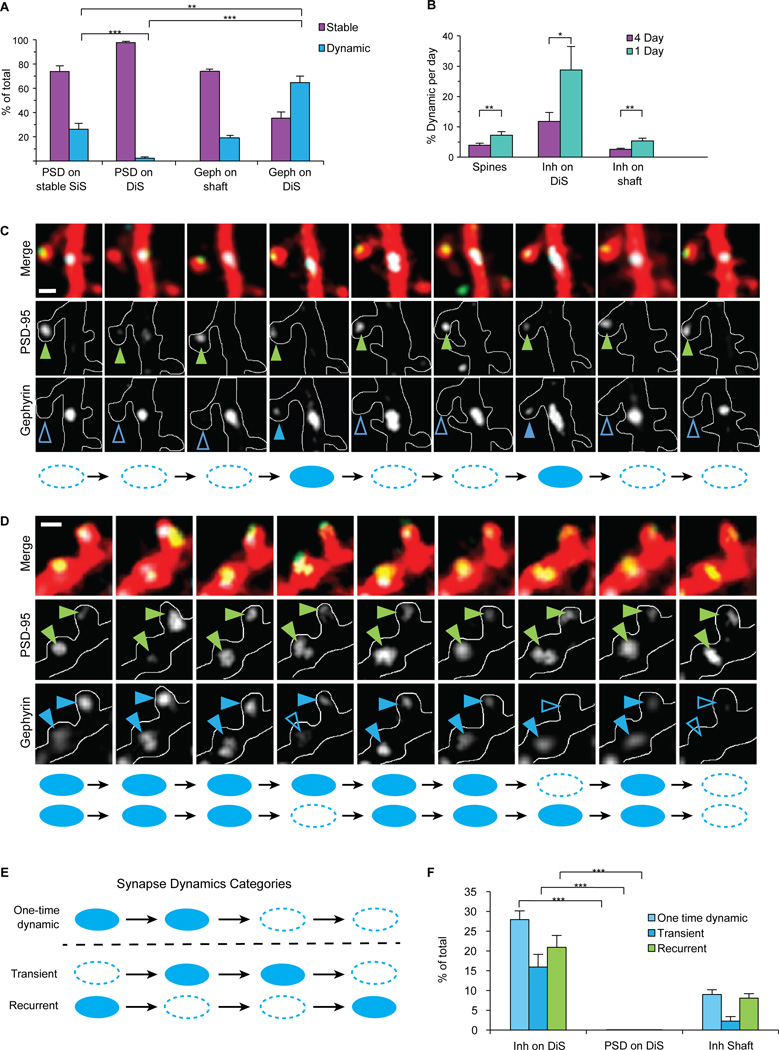
Figure 3
Inhibitory synapses disappear and appear again in the same location
(A) Fraction of dynamic PSD-95 puncta on SiS and DiS, compared to dynamic gephyrin puncta on shaft or DiS (*p<0.05, **p<0.001 ***p<0.0001 by ANOVA). (B) Comparison of % dynamic structures per...
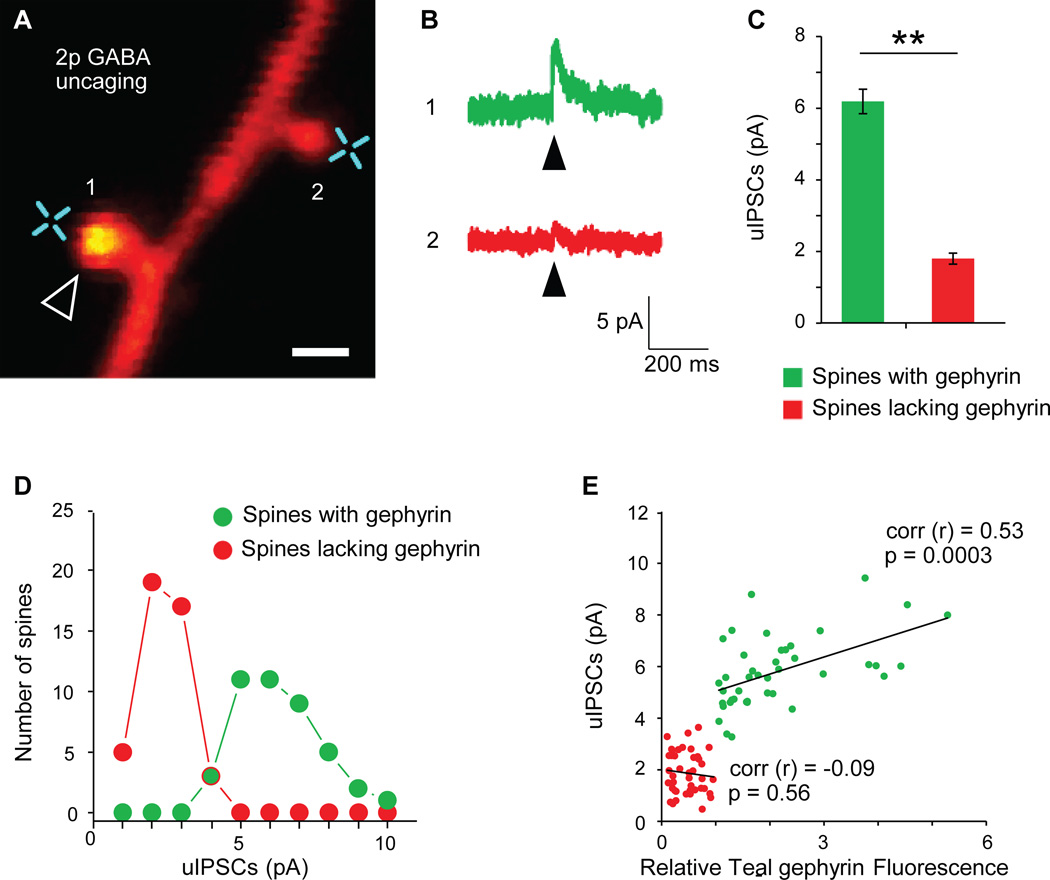
Figure 4
Presence or absence of Teal-gephyrin puncta on dually innervated spines reflects presence or absence of functional GABAergic synapses
(A) Representative image of a dendritic segment from an L2/3 pyramidal neuron in organotypic slice culture expressing tdTomato (red) and Teal-gephyrin (green). Arrowhead marks a gephyrin positive spin...
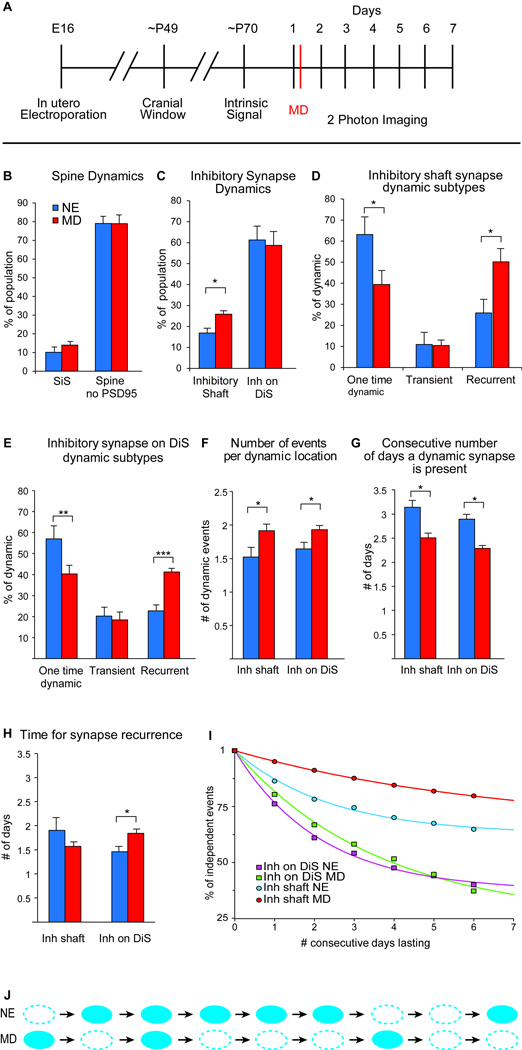
Figure 5
Kinetics of inhibitory synapse dynamics are altered during experience dependent plasticity
(A) Experimental protocol, MD was performed immediately following the first imaging session. (B) Spine dynamics are unaffected by MD as compared to NE (p>.05). (C) MD increases the % of dynamic inhibi...
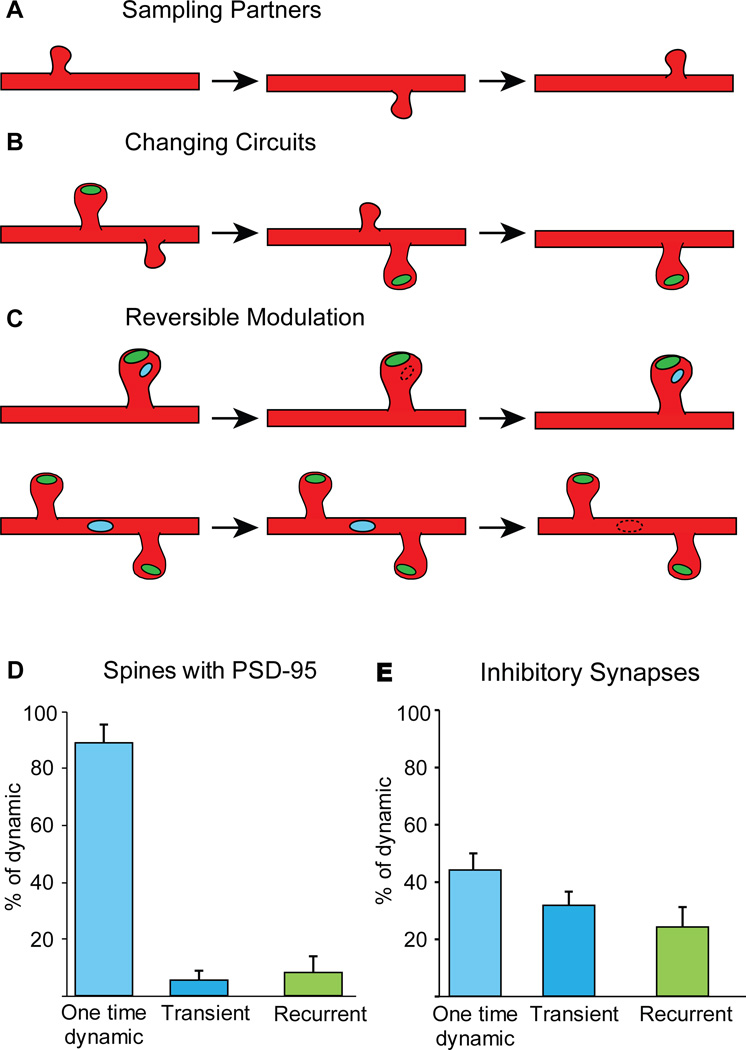
Figure 6
Different logic for excitatory vs. inhibitory synaptic changes
(Au2013C) Schematics illustrating the most prevalent categories of dynamic events for spines without PSD-95, spines with PSD-95, and inhibitory synapses on DiS and on the shaft. (A) Dynamics of spines...
Figure images are served from the NIH/NLM PubMed Central Open Access Subset or Europe PMC; copyright remains with the publishers and authors.
💬 Discussion
0 commentsNo comments yet. Be the first to start a discussion!
Leave a Comment