Abstract
Lipid accumulation within the lumen of endolysosomal vesicles is observed in various pathologies including atherosclerosis, liver disease, neurological disorders, lysosomal storage disorders, and cancer. Current methods cannot measure lipid flux specifically within the lysosomal lumen of live cells. We developed an optical reporter, composed of a photoluminescent carbon nanotube of a single chirality, that responds to lipid accumulation via modulation of the nanotube's optical band gap. The engineered nanomaterial, composed of short, single-stranded DNA and a single nanotube chirality, localizes exclusively to the lumen of endolysosomal organelles without adversely affecting cell viability or proliferation or organelle morphology, integrity, or function. The emission wavelength of the reporter can be spatially resolved from within the endolysosomal lumen to generate quantitative maps of lipid content in live cells. Endolysosomal lipid accumulation in cell lines, an example of drug-induced phospholipidosis, was observed for multiple drugs in macrophages, and measurements of patient-derived Niemann-Pick type C fibroblasts identified lipid accumulation and phenotypic reversal of this lysosomal storage disease. Single-cell measurements using the reporter discerned subcellular differences in equilibrium lipid content, illuminating significant intracellular heterogeneity among endolysosomal organelles of differentiating bone-marrow-derived monocytes. Single-cell kinetics of lipoprotein-derived cholesterol accumulation within macrophages revealed rates that differed among cells by an order of magnitude. This carbon nanotube optical reporter of endolysosomal lipid content in live cells confers additional capabilities for drug development processes and the investigation of lipid-linked diseases.
🔬 Techniques
🔭 Microscopes
💻 Software
✨ Fluorophores
🧪 Sample Preparation
🔬 Cell Lines
🏭 Microscope Brands
🧪 Reagent Suppliers
🔴 Lasers
📷 Detectors
🔎 Objectives
💻 Software Details
💾 Data Repositories
🏛️ Research Organizations (ROR)
Affiliated research institutions:
📋 Methods
DNA Encapsulation of Single-Walled Carbon Nanotubes
The chemical reagents were purchased from Sigma-Aldrich (St. Louis, MO, USA) and Fisher Scientific (Pittsburgh, PA, USA). Single-walled carbon nanotubes produced by the HiPco process were used throughout the study (Unidym, Sunnyvale, CA, USA). The carbon nanotubes were dispersed with DNA oligonucleotides via probe-tip ultrasonication (Sonics & Materials, Inc.) of 2 mg of the specified oligonucleotide (IDT DNA, Coralville, IA, USA) with 1 mg of raw SWCNT in 1 mL of 0.1 M NaCl for 30 min at 40% of the maximum amplitude of the ultrasonicator (SONICS Vibra Cell). Following ultrasonication, the dispersions were ultracentrifuged (Sorvall Discovery 90SE) for 30 min at 280 000 g . The top three-fourths of the resultant supernatant was collected, and its concentration was determined with a UV/vis/NIR spectrophotometer (Jasco, Tokyo, Japan) using the extinction coefficient Abs 910 = 0.02554 L mg –1 cm –1 . 19 To remove free DNA, 100 kDa Amicon centrifuge filters (Millipore) were used to concentrate and resuspend the DNA–nanotube complexes.
Purification of Single-Chirality Nanotube Complexes
Carbon nanotubes were separated by an ion-exchange chromatography method according to the procedure described by Tu et al . 32 Briefly, unsorted HiPco nanotubes were dispersed using a DNA oligonucleotide with the sequence ss(GT) 6 , as described above. The sample was injected into a high-performance liquid chromatograph (HPLC) (Agilent, 1260 Infinity) fitted with an anion-exchange column (Biochrom Laboratories, Inc., CNT-NS1500) with a running buffer of 2× SSC at a flow rate of 2 mL/min. A linearly increasing salt concentration gradient of 1 M NaSCN (5%/min) was used to elute the nanotubes from the stationary phase, and fractions were collected. The first fraction exciting the HPLC contained the highest purity of the (8,6) species, estimated at 86%, which was used for subsequent studies. Near-Infrared Fluorescence Microscopy of Single-Walled Carbon Nanotubes As described in a previous study, 19 near-infrared fluorescence microscopy was used to acquire the photoluminescence emission from SWCNTs. The system comprised a continuous wave 730 nm diode laser with an output power of 2 W injected into a multimode fiber to produce the excitation source for fluorescence experiments. To ensure a homogeneous illumination over the entire microscope field of view, the excitation beam passed through a custom beam-shaping module to produce a top-hat intensity profile with under 20% power variation on the imaged region of the sample. The final power at the sample was 230 mW. A long pass dichroic mirror with a cut-on wavelength of 875 nm (Semrock) was aligned to reflect the laser to the sample stage of an Olympus IX-71 inverted microscope (with internal optics modified to improve near-infrared transmission from 900 to 1400 nm) equipped with a 20× LCPlan N, 20×/0.45 IR objective and a UAPON100XOTIRF, 1.49 oil objective (Olympus, USA). Emission was collected with a 2D InGaAs array detector (Photon Etc.). Custom codes, written using Matlab software, were used to subtract background, correct for nonuniformities in excitation profile, and compensate for dead pixels on the detector. Hyperspectral microscopy was conducted by passing the emission through a volume Bragg grating (VBG) placed immediately before the InGaAs array in the optical path. The filtered image produced on the InGaAs camera was composed of a series of vertical lines, each with a specific wavelength. The reconstruction of a spatially rectified image stack was performed using cubic interpolation on every pixel for each monochromatic image, according to the wavelength calibration parameters. The rectification produced a hyperspectral “cube” of images of the same spatial region exhibiting distinct spectral regions with 3.7 nm fwhm bandwidths. Approximately 50% of the emission intensity from the nanotubes is reduced after passage through the VBG.
Show full methods section
DNA Encapsulation of Single-Walled Carbon Nanotubes
The chemical reagents were purchased from Sigma-Aldrich (St. Louis, MO, USA) and Fisher Scientific (Pittsburgh, PA, USA). Single-walled carbon nanotubes produced by the HiPco process were used throughout the study (Unidym, Sunnyvale, CA, USA). The carbon nanotubes were dispersed with DNA oligonucleotides via probe-tip ultrasonication (Sonics & Materials, Inc.) of 2 mg of the specified oligonucleotide (IDT DNA, Coralville, IA, USA) with 1 mg of raw SWCNT in 1 mL of 0.1 M NaCl for 30 min at 40% of the maximum amplitude of the ultrasonicator (SONICS Vibra Cell). Following ultrasonication, the dispersions were ultracentrifuged (Sorvall Discovery 90SE) for 30 min at 280 000 g . The top three-fourths of the resultant supernatant was collected, and its concentration was determined with a UV/vis/NIR spectrophotometer (Jasco, Tokyo, Japan) using the extinction coefficient Abs 910 = 0.02554 L mg –1 cm –1 . 19 To remove free DNA, 100 kDa Amicon centrifuge filters (Millipore) were used to concentrate and resuspend the DNA–nanotube complexes.
Purification of Single-Chirality Nanotube Complexes
Carbon nanotubes were separated by an ion-exchange chromatography method according to the procedure described by Tu et al . 32 Briefly, unsorted HiPco nanotubes were dispersed using a DNA oligonucleotide with the sequence ss(GT) 6 , as described above. The sample was injected into a high-performance liquid chromatograph (HPLC) (Agilent, 1260 Infinity) fitted with an anion-exchange column (Biochrom Laboratories, Inc., CNT-NS1500) with a running buffer of 2× SSC at a flow rate of 2 mL/min. A linearly increasing salt concentration gradient of 1 M NaSCN (5%/min) was used to elute the nanotubes from the stationary phase, and fractions were collected. The first fraction exciting the HPLC contained the highest purity of the (8,6) species, estimated at 86%, which was used for subsequent studies. Near-Infrared Fluorescence Microscopy of Single-Walled Carbon Nanotubes As described in a previous study, 19 near-infrared fluorescence microscopy was used to acquire the photoluminescence emission from SWCNTs. The system comprised a continuous wave 730 nm diode laser with an output power of 2 W injected into a multimode fiber to produce the excitation source for fluorescence experiments. To ensure a homogeneous illumination over the entire microscope field of view, the excitation beam passed through a custom beam-shaping module to produce a top-hat intensity profile with under 20% power variation on the imaged region of the sample. The final power at the sample was 230 mW. A long pass dichroic mirror with a cut-on wavelength of 875 nm (Semrock) was aligned to reflect the laser to the sample stage of an Olympus IX-71 inverted microscope (with internal optics modified to improve near-infrared transmission from 900 to 1400 nm) equipped with a 20× LCPlan N, 20×/0.45 IR objective and a UAPON100XOTIRF, 1.49 oil objective (Olympus, USA). Emission was collected with a 2D InGaAs array detector (Photon Etc.). Custom codes, written using Matlab software, were used to subtract background, correct for nonuniformities in excitation profile, and compensate for dead pixels on the detector. Hyperspectral microscopy was conducted by passing the emission through a volume Bragg grating (VBG) placed immediately before the InGaAs array in the optical path. The filtered image produced on the InGaAs camera was composed of a series of vertical lines, each with a specific wavelength. The reconstruction of a spatially rectified image stack was performed using cubic interpolation on every pixel for each monochromatic image, according to the wavelength calibration parameters. The rectification produced a hyperspectral “cube” of images of the same spatial region exhibiting distinct spectral regions with 3.7 nm fwhm bandwidths. Approximately 50% of the emission intensity from the nanotubes is reduced after passage through the VBG.
Analysis and Processing of Hyperspectral Data
Hyperspectral data acquired were saved as a (320 × 256 × 26) 16-bit array, where the first two coordinates signify the spatial location of a pixel and the last coordinate is its position in wavelength space. For the (8,6) nanotube, the 26-frame wavelength space ranges from 1150 to 1250 nm. An initial filter removed any pixels with a maximum intensity value outside (1170 to 1220 nm), as these were background pixels that emit outside the range for (8,6). For the remaining pixels, a peak-finding algorithm was used to calculate the intensity range for a given pixel, i . e ., range = (intensity_maximum–intensity_minimum). A data point was designated as a peak if its intensity was range/4 greater than the intensity of adjacent pixels. Pixels that failed the peak-finding threshold, primarily due to low intensity above the background, were removed from the data sets. The remaining pixels were fit with a Lorentzian function.
Preparation of Nanotubes Labeled with Visible Fluorophores
To increase the fluorescence intensity of the Cy3 or Cy5 fluorophores attached to DNA strands encapsulating SWCNTs, a 6-nucleotide-long polyT tail was added to the end of the (GT) 6 sequence, as fluorophores near the surface of SWCNTs are known to quench 63 (Integrated DNA Technologies, sequence = GTGTGTGTGTGTTTTTTT). For confocal imaging with Alexa-647 SWCNT, a small polyethylene glycol spacer was also added to further increase the fluorescence intensity of the fluorophore (Integrated DNA Technologies, sequence = GTGTGTGTGTGTTTTTTT/iSP18//3Alexaf647N//3′). These modified DNA strands were noncovalently complexed with HiPco SWCNTs via the previously described sonication and centrifugation protocol.
Preparation of Gold-Nanoparticle-Conjugated Nanotubes
Gold-nanoparticle-conjugated nanotubes were prepared according to a previously published study. 44 Briefly, 10 nm citrate-capped gold nanoparticles were synthesized by using 50 mL of 0.01 wt % HAuCl 4 and adding 2 mL of 1 wt % sodium(III) citrate. After 2 min, the solution turned bright red, indicating nanoparticle formation. The gold nanoparticles were stabilized via a ligand exchange reaction by shaking overnight with bis( p -sulfonatophenyl)phenyl phosphine dihydrate dipotassium salt. The nanoparticles were then centrifuged and resuspended in deionized water. In parallel, ss(GT) 27 -T 6 -thiol-dispersed HiPco nanotube complexes were created by means of the previously described sonication and centrifugation protocol. The nanotube complexes were filtered with ultracentrifuge filters three times to remove unbound DNA. The nanotube complexes and excess gold nanoparticles were then shaken overnight. The unbound gold nanoparticles were removed via centrifugation, which would pellet the unbound nanoparticles, and careful supernatant extraction. Transmission Electron Microscopy (TEM) Imaging Gold nanoparticle–nanotube conjugates were first imaged on carbon-coated TEM grids by letting a 20 μL drop evaporate in the center of the grid. For imaging in RAW 264.7 cells, gold nanoparticle–nanotubes were introduced to the media for 30 min at 1 mg/L and then washed thoroughly and replaced with fresh media. After 6 h, cells were washed with serum-free media, then fixed with a modified Karmovsky’s fix of 2.5% glutaraldehyde, 4% paraformaldehyde, and 0.02% picric acid in 0.1 M sodium cacodylate buffer at pH 7.2. Following a secondary fixation in 1% osmium tetroxide and 1.5% potassium ferricyanide, samples were dehydrated through a graded ethanol series and embedded in an Epon analogue resin. Ultrathin sections were cut using a Diatome diamond knife (Diatome, Hatfield, PA, USA) on a Leica Ultracut S ultramicrotome (Leica, Vienna, Austria). Sections were collected on copper grids, further contrasted with lead citrate, and viewed on a JEM 1400 electron microscope (JEOL, USA, Inc., Peabody, MA, USA) operated at 120 kV. Images were recorded with a Veleta 2K × 2K digital camera (Olympus-SIS, Germany).
Fluorescence Microscopy of Live Cells
Standard fluorescence imaging in the UV–visible emission range was performed on the hyperspectral microscope by using an XCite Series 120Q lamp as the light source and a QiClick CCD camera (QImaging) directly attached to a c-mount on a separate port of the microscope.
Fluorescence filter sets from Chroma
Technology and Semrock were used. Confocal imaging was performed on a Zeiss LSM 880, AxioObserver microscope equipped with a Plan-Apochromat 63× oil 1.4 NA differential interference contrast M27 objective in a humidified chamber at 37 °C. Z -stacks were obtained using a step size of 198–220 nm.
Fluorescence Spectroscopy of Carbon Nanotubes in Solution
Fluorescence emission spectra from aqueous solutions of SWCNTs were acquired using a home-built apparatus consisting of a tunable white light laser source, inverted microscope, and InGaAs NIR detector. 54 The SuperK EXTREME supercontinuum white light laser source (NKT Photonics) was used with a VARIA variable bandpass filter accessory capable of tuning the output 500–825 nm with a bandwidth of 20 nm. During the course of the measurements, the excitation wavelength remained at 730 nm, close to the resonant excitation maximum of the DNA-encapsulated (8,6) nanotube species. The light path was shaped and fed into the back of an inverted IX-71 microscope (Olympus), where it passed through a 20× NIR objective (Olympus) and illuminated a 100 μL nanotube sample at a concentration of 0.2 mg/L in a 96-well plate (Corning). With an exposure time of 1 s, the emission from the nanotube sample was collected through the 20× objective and passed through a dichroic mirror (875 nm cutoff, Semrock). The light was f /# matched to the spectrometer using several lenses and injected into an Isoplane spectrograph (Princeton Instruments) with a slit width of 410 μm, which dispersed the emission using a 86 g/mm grating with 950 nm blaze wavelength. The spectral range was 930–1369 nm with a resolution of ∼0.7 nm. The light was collected by a PIoNIR InGaAs 640 × 512 pixel array (Princeton Instruments). An HL-3-CAL-EXT halogen calibration light source (Ocean Optics) was used to correct for wavelength-dependent features in the emission intensity arising from the spectrometer, detector, and other optics. A Hg/Ne pencil-style calibration lamp (Newport) was used to calibrate the spectrometer wavelength. Background subtraction was conducted using a well in a 96-well plate filled with DI H 2 O. Following acquisition, the data was processed with custom code written in Matlab that applied the aforementioned spectral corrections and background subtraction and was used to fit the data with Lorentzian functions. Nanotube Chirality and DNA Sequence-Dependent Response to LDL Unsorted DNA–SWCNT samples were diluted to 2 mg/L in phosphate-buffered saline (PBS) and incubated with 0.5 mg/mL LDL (Alfa Aesar) for 18 h at 37 °C. Chirality-separated samples were diluted to 0.2 mg/L in PBS and incubated with 0.5 mg/mL LDL for 18 h at 37 °C. Controls were incubated with no LDL present. Photoluminescence spectra were acquired with 2 s exposure times. Titrations of DNA–Nanotube Complexes with PEG-Conjugated Lipids Unsorted ss(GT) 6 -DNA–SWCNT samples were diluted to mg/L in PBS and incubated with various concentrations (0–5 μM) of two PEG-conjugated lipids (cholesterol-PEG 600, “cholesterol-PEG”, Sigma-Aldrich; C16 PEG750 Ceramide, Avanti Lipids). Samples were incubated for 2 h at 37 °C. Photoluminescence spectra were acquired with 2 s exposure times under 730 nm laser excitation. PEGs, with molecular weights of 600 or 750 kDa, diluted in PBS, were used as controls to test for nonspecific interactions. To test the effect of lowered pH on sensor performance, samples were diluted in a 100 mM pH 5.5 acetate buffer instead of PBS. Calculation of Normalized Simpson’s Index The Simpson’s index is a diversity index used to measure the richness and evenness of a basic data type. 62 The diversity index is maximized when all types of data are equally abundant. When applied to microbiology, the Simpson’s index is referred to as the Hunter–Gaston index. 62 In our application, where D is the diversity index, N is the total number of pixels within each cell with detectable nanotube emission, S is the total number of histogram bins, and n j is the total number of pixels within the j th bin. We obtained the Simpson’s index for each cell, SI j . For the set of SI j calculated for all the cells in an experiment, we normalized the value to obtain the normalized Simpson’s index, nSI.
Cell Culture Reagents and Conditions RAW 264.7
TIB-71 cells (ATCC, Manassas, VA, USA) were grown under standard incubation conditions at 37 °C and 5% CO 2 in sterile, filtered DMEM with 10% heat-inactivated FBS, 2.5% HEPES, 1% glutamine, and 1% penicillin/streptomycin (all from Gibco). For studies performed with homozygous mutant NPC, compound mutant heterozygote NPC, or wild-type fibroblasts, the respective cell lines GM18453, GM03123, or GM05659 (Coriell, Camden, NJ, USA) were cultured in MEM with 10% FBS, 2.5% HEPES, and 1% glutamine. Cells were plated on glass-bottom Petri dishes or lysine-covered glass dishes (MatTek) for fibroblasts. Chirality-separated SWCNTs were added at 0.2 mg/L in cell culture media (70 μL total volume) and incubated with cells for 30 min at 37 °C. This corresponds to approximately 0.5 picogram of SWCNT per cell, for a 50% cell confluency in a 9 mm diameter glass-bottom dish. The same procedure was used for unsorted SWCNTs with a concentration of 1 mg/L. These concentrations were chosen because they were experimentally observed to be the minimum concentration needed to obtain strong reporter signal from all of the cell lines used here. An incubation time of 30 min was chosen because it was the minimal duration that resulted in a strong reporter signal from all the cell lines used here. Cells were imaged immediately, or trypsinized (Gibco), and replated on fresh Petri dishes before hyperspectral imaging. All cells were used at 50–70% confluence. Filipin Staining of NPC1 Patient-Derived Fibroblasts Cells were fixed with 4% paraformaldehyde for 15 min, washed 3× with PBS, and stained with filipin III (Sigma) at a concentration of 50 μg/mL for 20 min. The cells were then washed 3× with PBS and imaged using a DAPI filter cube. Cell Viability and Proliferation Assays RAW 264.7 macrophages were seeded in untreated 96-well plates at 7000 cells per well. The reporter was introduced to the cells at 0.2 mg/L. Reporter, vehicle (0.027 MSSC + 0.1 M NaSCN), or hydrogen peroxide-treated cells were incubated (times indicated), washed, detached from the plate with Versene (1× PBS without Mg 2+ /Ca 2+ , 5 mM EDTA, 2% FBS), pelleted, and incubated with annexin V Alexa Fluor and propidium iodide (Life Technologies). Cells were analyzed by imaging cytometry (Tali) to quantify cell number and fluorophore content. For proliferation assays, RAW 264.7 macrophages treated with 0.2 mg/L ss(GT) 6 -(8,6)-SWCNT or vehicle were seeded at 150 000 cells on a 100 mm diameter untreated culture dish on day zero. After settling for 10 h, cells were harvested with Versene (1× PBS without Mg 2+ /Ca 2+ , 5 mM EDTA, 2% FBS) and by mechanical tapping to remove cells from the surface, stained with Calcein AM, and counted for the initial seeding density. Media was replaced every 2 days. At each 24 h period, cells were harvested as before and counted.
Cell counts represent Calcein
AM positive (live) cells. Lipidomics Analyses Six T-175 flasks were seeded at 500 mg). After homogenization, reagent was added, and the tube inverted and then centrifuged at 4 °C, 500× rcf for 10 min. The pellet was stored as the debris/nuclear fraction in all experiments. The supernatant was taken for subsequent ultracentrifugation. Briefly, 1 day before ultracentrifugation, a sucrose/iodixanol gradient (bottom to top: 30, 27, 23, 20, 17%) was layered into 12 mL polyallomer tubes (Thermo, 03699) and allowed to equilibrate in a cold room inside the metal buckets of an appropriate hanging-bucket rotor. The supernatant from above was mixed with the sucrose/iodixanol gradient to make a final sample density of 15% (total volume, 1 mL), which was then gently layered onto the top of the preformed gradient. The buckets were then sealed and moved into the ultracentrifuge using the following settings: ∼135 000 rcf (32 000 rpm), 2.5 h running time, acceleration/deceleration 9/5, 4 °C. The fractionated cell supernatant was removed from the top and pipetted into six fractions based on volume removed from the ultracentrifuge tube. The volume removed from top to bottom was kept constant across the three conditions. Fractions were frozen until analysis. Each of the six fractions, plus the nuclear/debris fraction (7 total/condition), was analyzed for the three conditions (21 fractions total). To quantify total protein, a standard curve was produced using BSA mixed into the sucrose/iodixanol gradient (Bradford assay background versus varying gradient was not different). 1× Bradford reagent at room temperature was mixed 1:1 with standard and allowed to incubate in the dark for 30 min, and the absorption was measured at 595 nm. Each of the fractions was analyzed in this manner after addition of 0.2% IPEGAL CA-630 (nonionic detergent) to solubilize bound proteins. Cholesterol quantification was performed (Sigma, MAK043) using a coupled enzyme reaction between cholesterol oxidase and peroxidase with a proprietary colorimetric probe. Cholesterol esterase was used before the reactions to ensure total cholesterol was measured. Briefly, a three-phase extraction was performed on each sample fraction (7:11:0.1 chloroform/2-propanol/IPEGAL CA-630). The top aqueous phase and interphase were removed, and the bottom organic phase was vacuum-dried. The dried fractions were resuspended in provided buffer and reacted for 1 h at 37 °C with the supplied reagents, and the absorption was read at 570 nm. This was compared to a standard curve. Cholesterol levels were normalized by total protein content as measured by the Bradford assay. Total lipid (total unsaturated hydrocarbon, including cholesterol) was measured after extracting the samples with chloroform as above. Briefly, a phospho-vanillin color-producing reagent was made by dissolving 5 mg/mL vanillin (Sigma, V1104) in 200 μL of neat ethanol and adding this to the appropriate volume of 17% phosphoric acid. This reagent was stored cool in the dark until needed. Dried sample fractions in glass vials were processed as follows: to each vial was added 200 μL of ∼98% sulfuric acid. The dried contents were coated with the acid by tipping the vial and vortexing. The vial was placed into a 100 °C mineral oil bath for 20 min. The resulting brown/black material was rapidly cooled in a wet ice slurry for at least 5 min, and 100 μL was placed side-by-side into a 96-well glass plate. To one well was added 50 μL of the phospho-vanillin reagent, this was mixed, and the plate was incubated in the dark for 12 min. Absorption of each well (reagent reacted and sulfuric acid background) was taken at 535 nm. The difference was the measurement, which was compared to a standard curve that used oleic acid (Sigma, O1008), prepared using the above protocol, as a model unsaturated hydrocarbon material. Total lipid levels were normalized by total protein content. Extraction and Differentiation of Bone-Marrow-Derived Macrophages BMDMs were prepared from 6-week-old C57/Bl6 mice and cultured in the presence of 10 ng/mL of recombinant colony stimulating factor-1. 64 Cells were collected 3, 5, and 7 days post-isolation and submitted to flow cytometry analysis for expression of the differentiation markers Gr-1 (monocytes/granulocytes-1/200), Cd11b (macrophages-1/200), and F4/80 (mature macrophages-1/50). Cells were incubated with 1 μL of Fc Block (BD Biosciences) for every million cells for at least 15 min at 4 °C. Cells were then stained with the appropriate antibodies (BD Biosciences) for 20 min at 4 °C, washed with FACS buffer, and resuspended in FACS buffer containing DAPI (5 mg/mL diluted 1:5000) for live/dead cell exclusion. 65 LysoTracker–Nanotube Colocalization RAW 264.7 or BMDM macrophages were incubated with Cy5-ss(GT) 6 -HiPco nanotubes for 30 min at a concentration of 1 mg/L. The cells were then washed 3× with PBS and placed in fresh cell media. Six hours later, the cells were incubated with 5 nM LysoTracker Green DND-26 (Life Technologies) for 15 min in cell media, washed 3× with PBS, and imaged immediately in fresh PBS. The FITC or Cy5 channels were used for LysoTracker Green or Cy5-ss(GT) 6 -HiPco nanotubes, respectively. Plates of cells containing only Cy5-ss(GT) 6 -HiPco nanotubes or LysoTracker Green were used as controls to test for bleed-through across channels. Atomic Force Microscopy (AFM) A stock solution of ss(GT) 6 -(8,6)-SWCNTs at 7 mg/L in 100 mM NaCl was diluted 20× in dH 2 O and plated on a freshly cleaved mica substrate (SPI) for 4 min before washing with 10 mL of dH 2 O and blowing dry with argon gas. An Olympus AC240TS AFM probe (Asylum Research) in an Asylum Research MFP-3D-Bio instrument was used to image in AC mode. Data was captured at 2.93 nm/pixel XY resolution and 15.63 pm Z resolution.
Statistics
Statistical analysis was performed with GraphPad Prism version 6.02. All data met the assumptions of the statistical tests performed ( i . e ., normality, equal variances, etc .). Experimental variance was found to be similar between groups using the F-test and Brown–Forsythe test for unpaired t tests and one-way ANOVAs, respectively. To account for the testing of multiple hypotheses, one-way ANOVAs were performed with Dunnet’s, Tukey’s, or Sidak’s post-tests when appropriate. Sample size decisions were based on the instrumental signal-to-noise ratios. Cell Line Source and Authentication RAW 264.7 cells were acquired from ATCC and were tested for mycoplasma contamination by the source. Primary bone-marrow-derived monocytes were tested for mycoplasma contamination using DAPI staining. Patient-derived fibroblasts were obtained from Coriell and tested for mycoplasma contamination by the source. U2OS-SRA cells were generated in the lab of F.R.M.
Code Availability
Matlab code for the data analysis in this article is available upon request, by contacting the corresponding author ( hellerd@mskcc.org ).
Supplementary Material nn7b04743_si_001.avi nn7b04743_si_002.avi nn7b04743_si_003.avi nn7b04743_si_004.pdf
📊 Figures
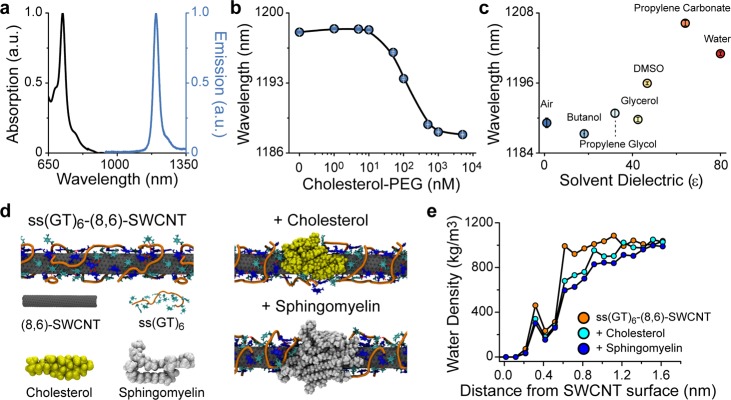
Figure 1
Optical response of carbon nanotube complexes to lipidnenvironments.n(a) Normalized absorption and emission spectra of ss(GT) 6 u2013carbon nanotube complexes purified to isolate the (8,6) species.n(b...
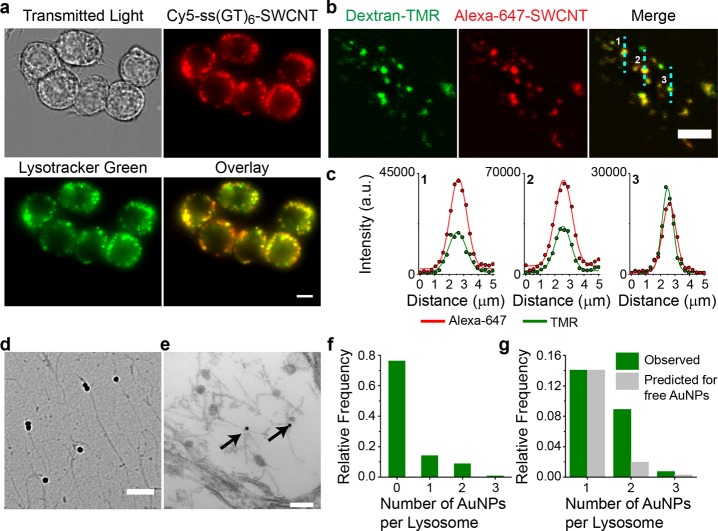
Figure 2
Localization of DNAu2013SWCNTnto endolysosomal organelles. (a)nRepresentative fluorescence microscopy images of 1 mg/L Cy5-labelednDNAu2013SWCNT complexes (red) and LysoTracker (green) in live cells.n...
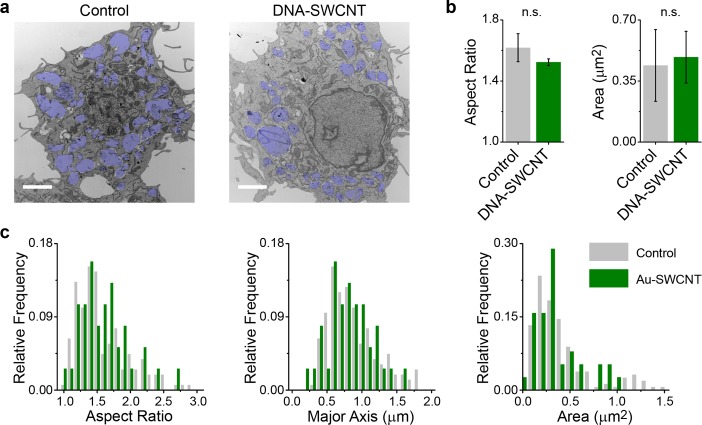
Figure 3
Ultrastructural analysis of endolysosomal organelles.n(a) RepresentativenTEM images of cells that were untreated or incubated with 1 mg/L ofnAuNPu2013SWCNT complexes. Endolysosomal organelles are shad...
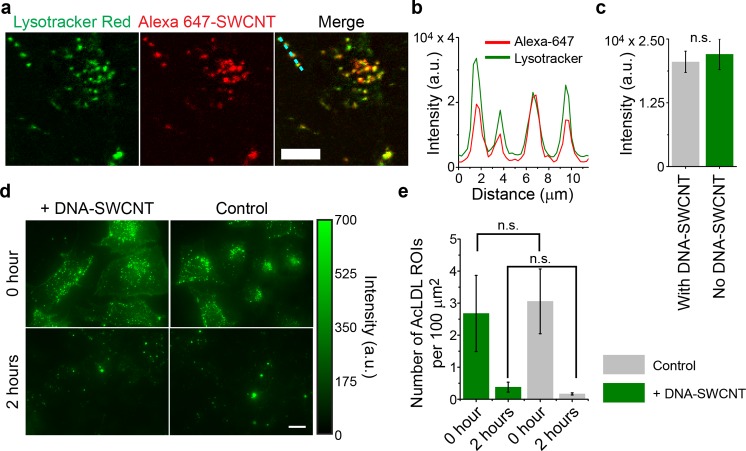
Figure 4
Assessing the effects of DNAu2013SWCNT on endolysosomal function.n(a) Representative confocal images of LysoTracker-Red (green) andnAlexa 647-SWCNT (red) and a merged image of the two in U2OS-SRA cell...
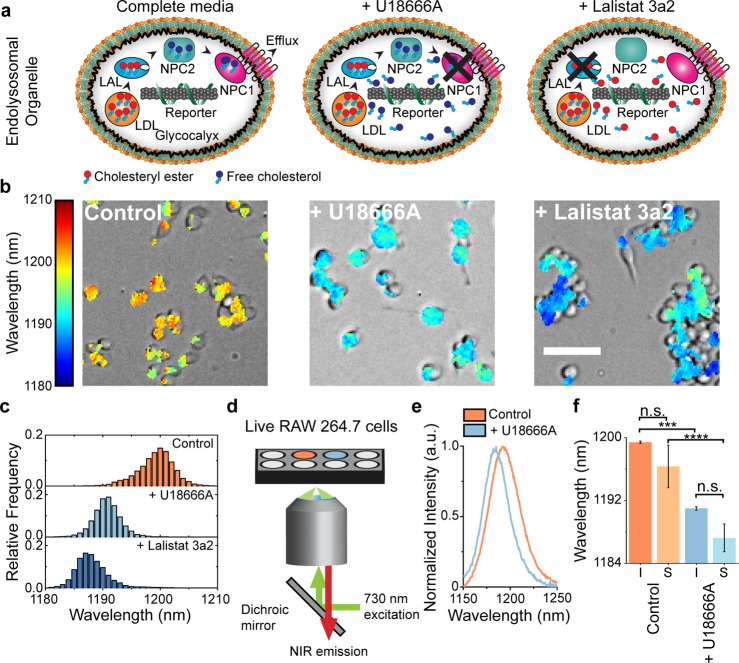
Figure 5
Detection of endolysosomalnlipid accumulation in live cells. (a)nSchematics of the ss(GT) 6 -(8,6) nanotube complexes in macrophagesntreated with U18666A or Lalistat 3a2. (b) Overlay of transmitted li...
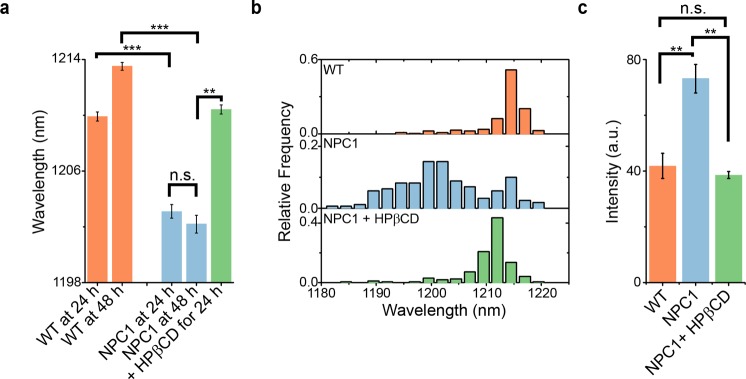
Figure 6
Measurement of endolysosomalnlipid accumulation and reversal innNPC1 patient-derived fibroblasts. (a) Mean reporter emission fromnwild-type fibroblasts, patient-derived NPC1 fibroblasts, and NPC1nfibr...
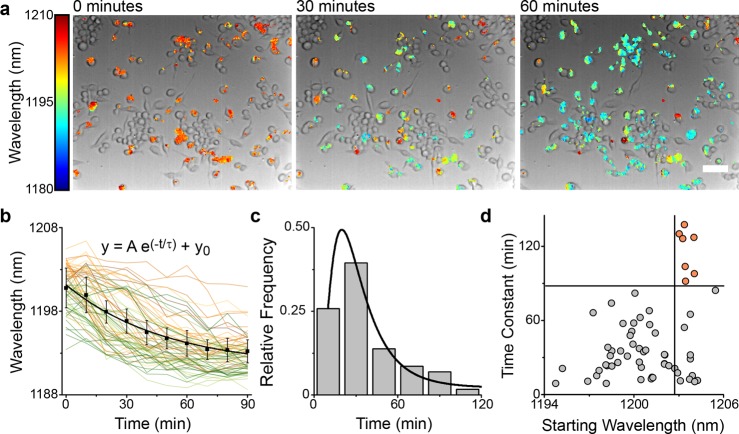
Figure 7
Single-cell kinetics of lipid accumulation. (a) Overlaid bright-fieldnand hyperspectral images of the reporter emission in RAW 264.7 macrophagesnupon addition of AcLDL (100 u03bcg/mL) and U18666A (3 u...
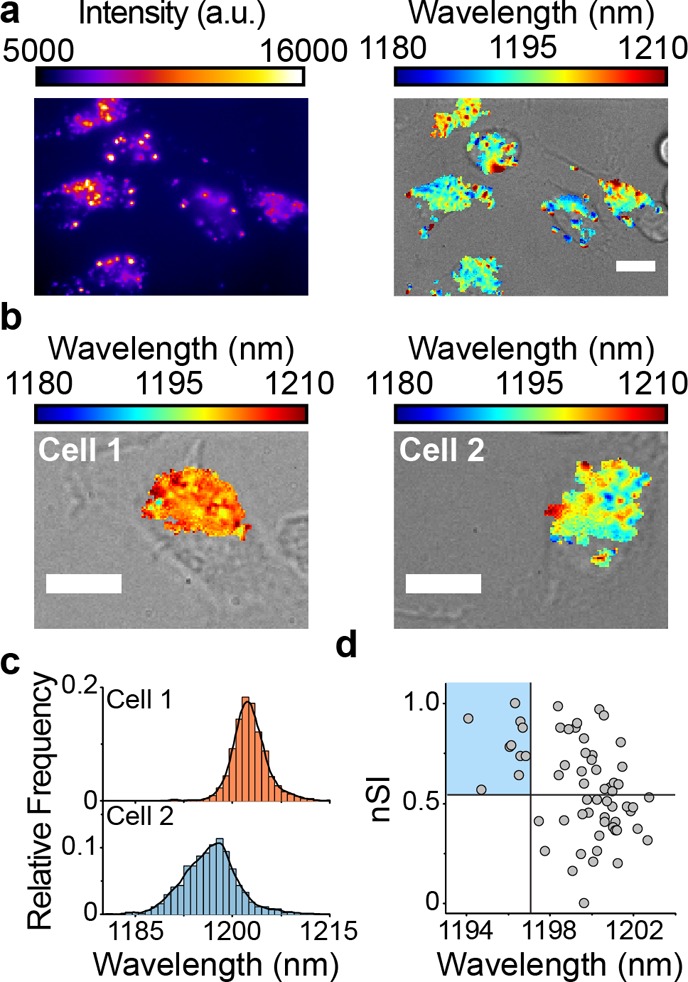
Figure 8
Quantifying intracellularnheterogeneity in monocyte endolysosomalnorganelles. (a) Near-infrared broadband and overlaid bright-field/hyperspectralnimages of the reporter in bone-marrow-derived cells af...
Figure images are served from the NIH/NLM PubMed Central Open Access Subset or Europe PMC; copyright remains with the publishers and authors.
💬 Discussion
0 commentsNo comments yet. Be the first to start a discussion!
Leave a Comment