Abstract
The use of the visual system played a major role in the elucidation of molecular mechanisms controlling axonal regeneration in the injured CNS after trauma. In this model, CNTF was shown to be the most potent known neurotrophic factor for axonal regeneration in the injured optic nerve. To clarify the role of the downstream growth regulator Stat3, we analyzed axonal regeneration and neuronal survival after an optic nerve crush in adult mice. The infection of retinal ganglion cells with adeno-associated virus serotype 2 (AAV2) containing wild-type (Stat3-wt) or constitutively active (Stat3-ca) Stat3 cDNA promoted axonal regeneration in the injured optic nerve. Axonal growth was analyzed in whole-mounted optic nerves in three dimensions (3D) after tissue clearing. Surprisingly, with AAV2.Stat3-ca stimulation, axons elongating beyond the lesion site displayed very irregular courses, including frequent U-turns, suggesting massive directionality and guidance problems. The pharmacological blockade of ROCK, a key signaling component for myelin-associated growth inhibitors, reduced axonal U-turns and potentiated AAV2.Stat3-ca-induced regeneration. Similar results were obtained after the sustained delivery of CNTF in the axotomized retina. These results show the important role of Stat3 in the activation of the neuronal growth program for regeneration, and they reveal that axonal misguidance is a key limiting factor that can affect long-distance regeneration and target interaction after trauma in the CNS. The correction of axonal misguidance was associated with improved long-distance axon regeneration in the injured adult CNS.
🔬 Techniques
🔭 Microscopes
✨ Fluorophores
🧪 Sample Preparation
🏭 Microscope Brands
🧪 Reagent Suppliers
📷 Detectors
💻 Software Details
🏛️ Research Organizations (ROR)
Affiliated research institutions:
📋 Methods
Animals Two- to four-month-old male
C57BL/6 mice were used for optic nerve crush injuries and for tissue analysis. Animal experiments were conducted in agreement with the guidelines of the Veterinary Office of the Canton of Zürich.
Generation of recombinant AAV vectors
AAV vectors were produced by the plasmid co-transfection method. 37 Recombinant AAV was purified via iodixanol gradient ultracentrifugation, as described previously. 38 The 40% iodixanol fraction was then buffer-exchanged against phosphate-buffered saline (PBS) supplemented with 0.001% Tween and concentrated using 100K Amicon Ultra-15 centrifugal filter units to a final volume of 200 μ l. DNase-resistant viral genomes in the concentrated stock were then titered by quantitative PCR relative to standards. 39 Vector concentrations were calculated in viral genomes/ml with AAV2.GFP, AAV2.Stat3-wt, AAV2.Stat3-ca, and ShH10.DH-CNTF at 2–4 × 10 13 vg/ml.
Intraocular injections
AAV vectors or the anterograde tracer cholera toxin β subunit conjugated to alexa-594 (CTb-594, 0.5% in PBS, 1.5–2 μ l, Molecular Probes, Zug, Switzerland) were injected as previously described. 13 AAV (1 μ l) were intravitreously injected 4 weeks before optic nerve crush or tissue analysis, a duration of time that allowed optimal transgene expression in vivo . 22 , 40 To block the activation of ROCK, 2 μ l of the pharmacological inhibitor Y27632 (3 mM, in PBS) was administered intraocularly at the time of the optic nerve lesion and 1 week later (Sigma-Aldrich, Buchs, Switzerland, #Y0503). Neuronal survival and retinal flat-mount immunostaining The survival of RGCs was studied 2 weeks after intraorbital optic nerve crush, at ∼0.25 mm from the eyeball. The mice were intracardially perfused with 4% paraformaldehyde (PFA) and the retinae were rapidly dissected and flat-mounted. After overnight postfixation with 4% PFA, RGCs were labeled by immunofluorescence by applying an anti- β 3-Tubulin antibody (1 : 500, Abcam, Cambridge, UK, #ab18207) diluted in PBS containing 0.3% of Triton-X-100, 5% of normal serum and 0.05% sodium azide. To follow Stat3 expression in RGCs, some retinal flat-mounts were incubated with a rabbit anti-Stat3 antibody (1 : 200, Cell Signaling, Allschwil, Switzerland, #9132) and a mouse anti- β 3-Tubulin (1 : 500, Promega, Madison, WI, USA, #G712A). After extensive washing, the retinae were incubated with corresponding secondary antibodies at 4 °C. To examine neuronal survival, RGCs stained for β 3Tubulin were imaged in the four quadrants of the retina using a Leica SPE-II confocal microscope at 40X (NA 1.25), with a step size of 0.5 μ m and a resolution of 1 024 × 1 024 pixels (0.27 μ m/pixel). The number of RGC cell bodies was quantified in areas of 62 500 μ m 2 at 1 mm and 1.5 mm from the optic disk. The density of RGCs per mm 2 was calculated in each quadrant or in the whole retina.
Show full methods section
Animals Two- to four-month-old male
C57BL/6 mice were used for optic nerve crush injuries and for tissue analysis. Animal experiments were conducted in agreement with the guidelines of the Veterinary Office of the Canton of Zürich.
Generation of recombinant AAV vectors
AAV vectors were produced by the plasmid co-transfection method. 37 Recombinant AAV was purified via iodixanol gradient ultracentrifugation, as described previously. 38 The 40% iodixanol fraction was then buffer-exchanged against phosphate-buffered saline (PBS) supplemented with 0.001% Tween and concentrated using 100K Amicon Ultra-15 centrifugal filter units to a final volume of 200 μ l. DNase-resistant viral genomes in the concentrated stock were then titered by quantitative PCR relative to standards. 39 Vector concentrations were calculated in viral genomes/ml with AAV2.GFP, AAV2.Stat3-wt, AAV2.Stat3-ca, and ShH10.DH-CNTF at 2–4 × 10 13 vg/ml.
Intraocular injections
AAV vectors or the anterograde tracer cholera toxin β subunit conjugated to alexa-594 (CTb-594, 0.5% in PBS, 1.5–2 μ l, Molecular Probes, Zug, Switzerland) were injected as previously described. 13 AAV (1 μ l) were intravitreously injected 4 weeks before optic nerve crush or tissue analysis, a duration of time that allowed optimal transgene expression in vivo . 22 , 40 To block the activation of ROCK, 2 μ l of the pharmacological inhibitor Y27632 (3 mM, in PBS) was administered intraocularly at the time of the optic nerve lesion and 1 week later (Sigma-Aldrich, Buchs, Switzerland, #Y0503). Neuronal survival and retinal flat-mount immunostaining The survival of RGCs was studied 2 weeks after intraorbital optic nerve crush, at ∼0.25 mm from the eyeball. The mice were intracardially perfused with 4% paraformaldehyde (PFA) and the retinae were rapidly dissected and flat-mounted. After overnight postfixation with 4% PFA, RGCs were labeled by immunofluorescence by applying an anti- β 3-Tubulin antibody (1 : 500, Abcam, Cambridge, UK, #ab18207) diluted in PBS containing 0.3% of Triton-X-100, 5% of normal serum and 0.05% sodium azide. To follow Stat3 expression in RGCs, some retinal flat-mounts were incubated with a rabbit anti-Stat3 antibody (1 : 200, Cell Signaling, Allschwil, Switzerland, #9132) and a mouse anti- β 3-Tubulin (1 : 500, Promega, Madison, WI, USA, #G712A). After extensive washing, the retinae were incubated with corresponding secondary antibodies at 4 °C. To examine neuronal survival, RGCs stained for β 3Tubulin were imaged in the four quadrants of the retina using a Leica SPE-II confocal microscope at 40X (NA 1.25), with a step size of 0.5 μ m and a resolution of 1 024 × 1 024 pixels (0.27 μ m/pixel). The number of RGC cell bodies was quantified in areas of 62 500 μ m 2 at 1 mm and 1.5 mm from the optic disk. The density of RGCs per mm 2 was calculated in each quadrant or in the whole retina.
Axonal regeneration analysis
The optic nerve was crushed with a 9-0 suture to minimize the size of the injury as previously reported. 14 Care was taken not to damage the ophthalmic artery, and the retinal blood supply was controlled after each surgery by a fundus examination. One day before fixation with paraformaldehyde (4%), the optic axons were anterogradely traced by injecting 1.5 μ l of 0.5% CTb into the vitreous body. Two types of histological analyses were undertaken for axonal regeneration, that is, on tissue sections or in the whole-mounted optic nerve after clearing (see below). For first type of analysis, axons labeled with CTb-594 were visualized on longitudinal sections of optic nerve (14 μ m) using a Zeiss Axioskop 2 Plus microscope (Carl Zeiss), and images were captured using a CCD video camera at 20x. The number of growing axons per optic nerve was evaluated at 100–1000 μm past the lesion site at 100- μ m intervals. 13 The total number of axons per optic nerve ( Σ ) was estimated with the following formula: Σ d = Π × R 2 x (the average number of axons/mm)/ T . The sum ( Σ ) of axons at a given distance ( d ) was obtained using the average optic nerve radius ( R ) of all the optic nerves, and a thickness ( T ) of the tissue slices of 14 μ m. 41 For statistical analysis, an ANOVA followed by a Tukey post hoc test was applied. Animals presenting ischemia or retinal hemorrhages were excluded from the analysis.
Optic nerve clearing and 3D reconstruction
To scan CTb-594-labeled axons in the whole optic nerve, the tissue was cleared following the adapted protocol of Dodt et al. 7 After a 2-h post-fixation in 4% PFA, the optic nerves were washed twice in PBS and then dehydrated in baths of increasing concentrations of ethanol (50, 80, and 96%) for 1 h at room temperature under agitation and kept overnight in 100% ethanol. To remove the traces of water, optic nerves were then placed in 100% hexane for 2 h at room temperature. The clearing solution composed of the mixture of benzyl alcohol and benzylbenzoate (1 : 2) (Sigma-Aldrich) was then rapidly added after hexane removal. The white optic nerve turned transparent within 30 s to 1 min. The whole optic nerves were mounted in a clearing medium before imaging. Image stacks were captured using a confocal Leica SP5 inverted microscope (Leica Microsystems, Mannheim, Germany) equipped with a 63X glycerin immersion objective (NA: 1.3). This setup was used to scan axons throughout the whole thickness of the optic nerve. To obtain 3D reconstruction of CTb-594-labeled axons in the optic nerve, image stacks were stitched using the XuvTools 42 software and the resulting macro-stacks were exported to the Imaris Software (Bitplane, Zürich, Switzerland) to create 3D projections (Videos 1, 2). The number of growing axons was estimated throughout the whole thickness of the optic nerve using the ortho-slicer function allowing single plane observation. Individual axons were analyzed semi-automatically with the Filament Tracers's advanced manual tracing mode (‘AutoDepth'). The percentage of U-turns and branching were calculated for the 20 longest axons. Axons presenting one or more collateral processes in the last 200 μ m of their course were considered as branched, irrespectively of the length of the collaterals. Snapshots of the top- and side-view projections were captured in the orthogonal mode. Semi-quantitative real-time RT-PCR (qRT-PCR) After cervical dislocation, retinae were rapidly dissected in RNA Later solution (Ambion, Zug, Switzerland), placed in eppendorf tubes, flash frozen in liquid nitrogen, and stored at −80 °C until RNA was extracted. Total retinal RNA was prepared using the RNeasy RNA isolation kit (Qiagen, Hilden, Germany), including a DNase treatment to digest the residual genomic DNA. For reverse transcription, equal amounts of total RNA were transformed by oligo(dT) and M-MLV reverse transcriptase (Promega). Ten nanograms of cDNA were amplified in the Light Cycler 480 thermocycler (Roche Diagnostics AG, Rotkreuz, Switzerland) with the polymerase ready mix (SYBR Green I Master; Roche Diagnostics AG). The appropriate primer pairs were designed to span intronic sequences or to cover exon–intron boundaries ( Table 1 ). The analysis of the melting curve for each amplified PCR product and the visualization of the PCR amplicons on 2% agarose gels allowed controlling the specificity of the amplification. Relative quantification was calculated using the comparative threshold cycle (ΔΔ CT ) method. cDNA levels were normalized to Gapdh or to Rpl19 (reference genes), and a control sample (calibrator set to 1) was used to calculate the relative values. For each gene, the PCR-amplification efficiency was established from the slope of the calibration curve according to the equation: E =10 (−1/slope) . 43 Each reaction was done in triplicate, and at least three mice per condition were analyzed.
Western blot analysis
To prepare retinal lysates, three mice were killed for each condition by cervical dislocation and retinae were quickly placed in an eppendorf tube and snap frozen in liquid nitrogen. Tissues were then homogenized in a lysis buffer (20 mM Tris-HCl, 0.5% CHAPS, pH 8 ) containing protease inhibitors (Complete mini, Roche Diagnostics AG) for 60 min on ice. Soluble proteins in the supernatant were collected in clean eppendorf tubes, and stored at −80 °C after centrifugation for 15 min at 15 000 × g , 4 °C. Retinal proteins (20 μ g/well) were resolved by electrophoresis on a 4–12% gradient polyacrylamide gel and transferred to nitrocellulose membranes. The membranes were pre-incubated in a blocking solution of 2% Top Block (Lubio Science, Lucerne, Switzerland) dissolved in TBST (Tris-base 0.1 M, 0.2% Tween-20, pH 7.4) for 1 h at room temperature, incubated with primary antibodies overnight at 4 °C and after washing, with a horseradish peroxidase-conjugated anti-mouse or anti-rabbit antibody (1 : 10 000-1 : 25 000; Pierce Biotechnology). Primary antibodies were rabbit anti-phospho-Stat3 (1 : 500, Cell Signaling, #9131), rabbit anti-phospho-Akt (1 : 1 000, Cell Signaling, #9275), rabbit anti-Akt (1 : 1 000, Cell Signaling, #9272), rabbit anti-phospho-Erk1/2 (1 : 1 000, Cell Signaling, #4370), rabbit anti-Erk1/2 (1 : 1 000, Cell Signaling, #4695) and mouse anti-glyceraldehyde-3-phosphate dehydrogenase (GAPDH, 1 : 20 000; abcam, #ab8245). Protein bands were detected by adding SuperSignal West Pico Chemiluminescent Substrate (Pierce) and after exposure of the blot in a Stella detector.
Supplementary Material Supplementary Figure S1 Click here for additional data file. Supplementary Figure S2 Click here for additional data file. Supplementary Movie 1 Click here for additional data file. Supplementary Movie 2 Click here for additional data file. Supplementary Figure and Movie Legends Click here for additional data file.
📊 Figures
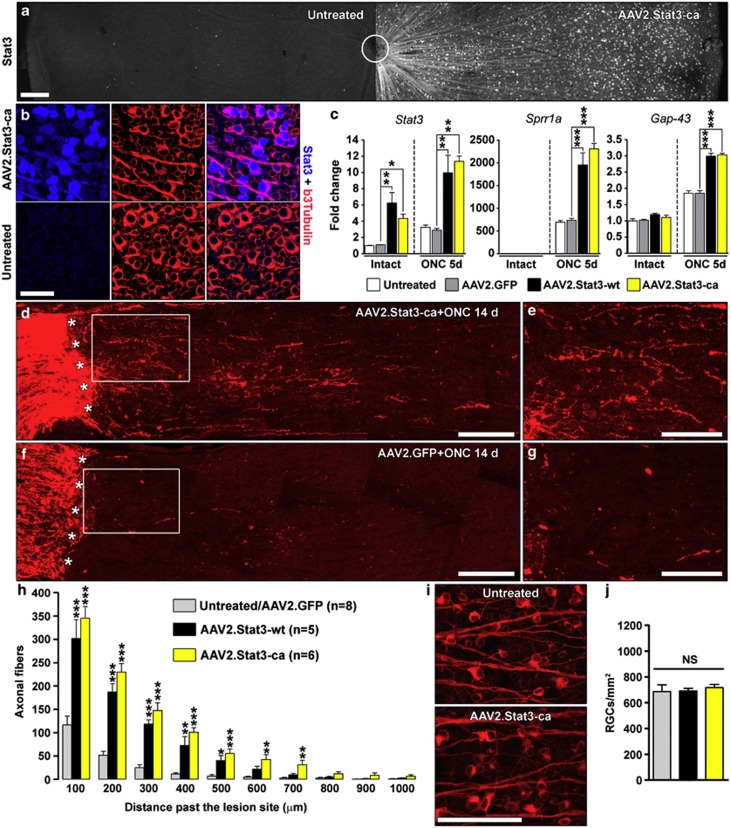
Figure 1
Retinal ganglion cell transduction with wild-type (WT) or constitutively active (ca) Stat3 is sufficient to promote axonal regeneration in the injured optic nerve. ( a ) Four weeks after AAV2.Stat3-ca...
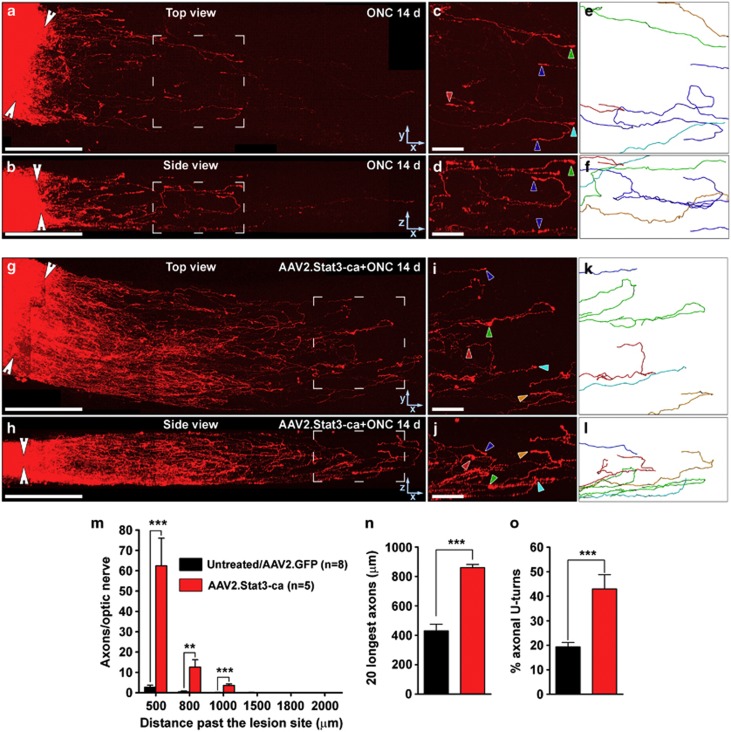
Figure 2
Three-dimensional analysis of axonal regeneration in the cleared optic nerve reveals guidance and directionality errors. Whole, unsectioned optic nerves were submitted to clearing (see methods) after ...
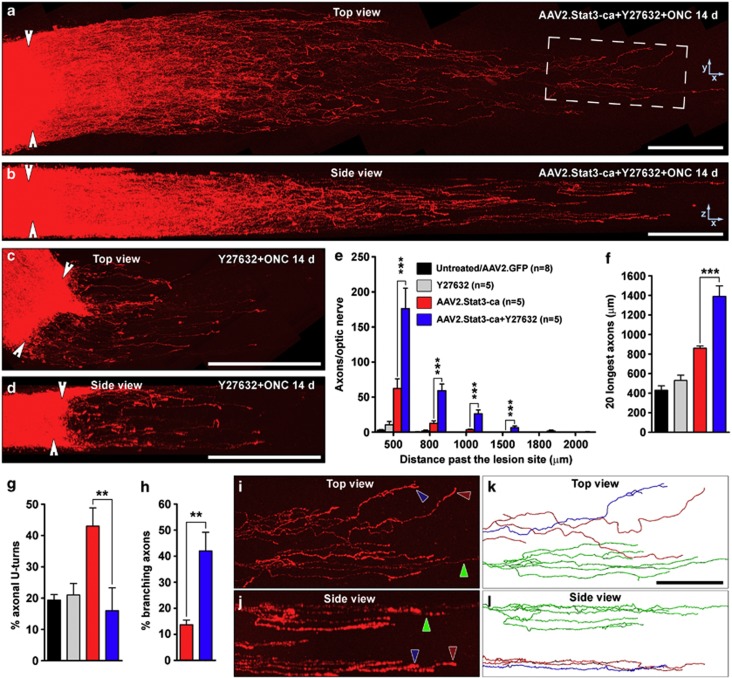
Figure 3
Rho-kinase (ROCK) inhibition potentiates Stat3-ca-induced axonal regeneration in the optic nerve and changes the pattern of fiber growth. The ROCK blocker Y27632 was administered intravitreally in adu...
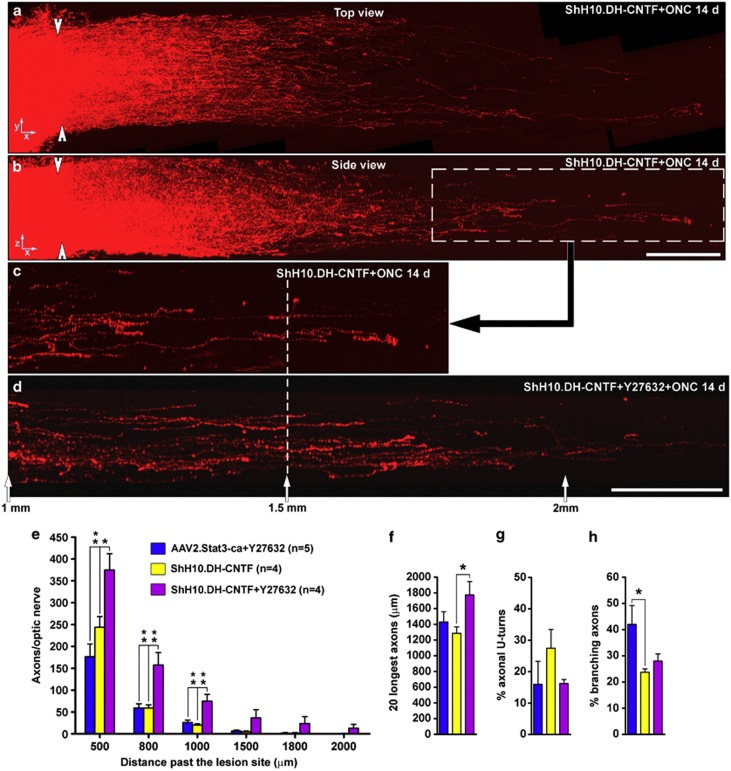
Figure 4
Combining AAV2.Stat3-ca and Y27632 promotes a similar extent of axonal regeneration as the overexpression of CNTF by Mu00fcller glia. ( a and b ) Side-view and top-view projections of CTb-594 stained ...
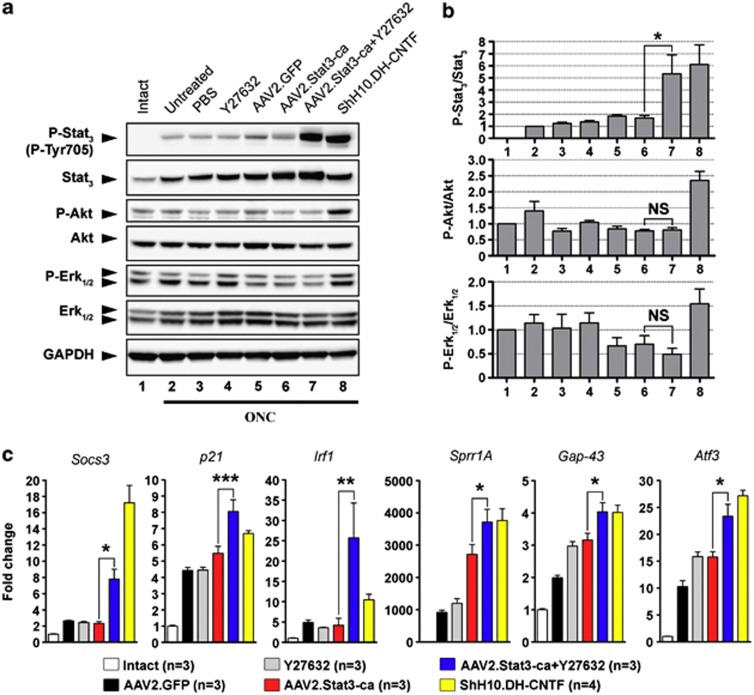
Figure 5
Y27632 boosts growth gene transcription by Stat3. ( a and b ) The activation of the Jak/Stat3, Erk1/2 and PI3K/Akt signaling cascades was monitored by western blot analysis, 5 days after the optic ner...
Figure images are served from the NIH/NLM PubMed Central Open Access Subset or Europe PMC; copyright remains with the publishers and authors.
💬 Discussion
0 commentsNo comments yet. Be the first to start a discussion!
Leave a Comment