Abstract
Macrophages can remove antigen from the surface of antibody-coated cells by a process termed trogocytosis. Using live cell microscopy and flow cytometry, we investigated the dynamics of trogocytosis by RAW264.7 macrophages of Ramos B cells opsonized with the anti-CD20 monoclonal antibody rituximab. Spontaneous and reversible formation of uropods was observed on Ramos cells, and these showed a strong enrichment in rituximab binding. RAW-Ramos conjugate interfaces were highly enriched in rituximab, and transfer of rituximab to the RAW cells in submicron-sized puncta occurred shortly after cell contact. Membrane from the target cells was concomitantly transferred along with rituximab to a variable extent. We established a flow cytometry-based approach to follow the kinetics of transfer and internalization of rituximab. Disruption of actin polymerization nearly eliminated transfer, while blocking phosphatidylinositol 3-kinase activity only resulted in a delay in its acquisition. Inhibition of Src family kinase activity both slowed acquisition and reduced the extent of trogocytosis. The effects of inhibiting these kinases are likely due to their role in efficient formation of cell-cell conjugates. Selective pre-treatment of Ramos cells with phenylarsine oxide blocked uropod formation, reduced enrichment of rituximab at cell-cell interfaces, and reduced the efficiency of trogocytic transfer of rituximab. Our findings highlight that dynamic changes in target cell shape and surface distribution of antigen may significantly influence the progression and extent of trogocytosis. Understanding the mechanistic determinants of macrophage trogocytosis will be important for optimal design of antibody therapies.
🔬 Techniques
🔭 Microscopes
💻 Software
✨ Fluorophores
🧪 Sample Preparation
🔬 Cell Lines
🏭 Microscope Brands
🧪 Reagent Suppliers
🔎 Objectives
💻 Software Details
🏛️ Research Organizations (ROR)
Affiliated research institutions:
📋 Methods
Cell lines and culture conditions RAW264.7
(RAW) cells were obtained from the American Type Culture Collection and maintained in DMEM with 10% heat-inactivated fetal bovine serum (FBS) (Wisent, Quebec, Canada). Cells were detached for subculturing or analysis by scraping. Ramos cells, a human Burkitt's B cell line, were generously provided by Dr. Alberto Martin (University of Toronto) and were maintained in IMDM (Gibco) + 10% FBS. All cell lines were grown in a humidified 37°C, 5% CO 2 incubator. Reagents Rituximab (RTX) was a generous gift from Dr. David Spaner (Sunnybrook Research Institute, Ontario, Canada) and was conjugated using an Alexa Fluor 488 Protein Labelling Kit (Invitrogen). Rat anti-mouse CD11b-PE/APC (clone M1/80) was obtained from the Sunnybrook Research Institute antibody facility, BD Pharmingen, or Biolegend and used as directed. Donkey anti-human DyLight 649 (DL649) antibody was obtained from Jackson ImmunoResearch. PP1 was from Biomol. LY294002 was from Calbiochem. Cytochalasin D, PKH26, dimethylsulfoxide (DMSO) and PAO were from Sigma.
Preparation of cells for trogocytosis
Ramos cells were opsonized with Alexa Fluor-488-conjugated RTX (RTX-Al488) for 20 minutes with agitation at 37°C. RTX-Al488 was used at a saturating concentration of 0.3 µg per 10 6 Ramos cells. In some experiments, Ramos cells were labelled with PKH26 according to manufacturer's instructions. Chemical inhibitors of internalization were used at 10 µM cytochalasin D, 30 µM PP1, or 50 µM LY294002, by incubation of RAW cells at 37°C for 30 minutes in RAW medium with serum immediately prior to the trogocytosis assay. 0.5% DMSO was used as a vehicle control. After adding RTX-Al488 coated Ramos cell suspensions to RAW cells, chemical inhibitors were restored to their appropriate concentrations. For PAO pretreatment of Ramos cells, cells were incubated with 30 µM PAO for 10 minutes, then washed twice to remove PAO before addition to RAW cells. Live microscopy of trogocytosis RAW cells (1×10 6 cells) were seeded on 25 mm diameter cover glass (Fisher Scientific), cultured overnight, then mounted in an Attofluor chamber (Molecular Probes) followed by imaging on a 37°C heated stage. RAW cell media was replaced with phenol red-free HEPES-buffered RPMI (HPMI) with serum (Wisent). Ramos cells (1×10 6 cells) were labelled with PKH26 (in some experiments), coated with RTX-Al488, resuspended in HPMI and laid over RAW cells. Epifluorescent microscope images were acquired with a Hamamatsu ORCA camera attached to a Zeiss Axiovert 200M microscope, with 40×1.3NA oil and 100×1.4NA oil objectives. Alternatively, scanning confocal microscope images were acquired with a Zeiss LSM 510 with a 63×1.2NA water objective. Time lapse data was generated by imaging at 30s intervals. Care was taken to minimize exposure time for each field of view to reduce photobleaching and phototoxicity. Data were analyzed with AxioVision (Zeiss) and Volocity (Improvision) software packages. For observation of Ramos cell motility, cells were viewed either on cover glass on which RAW cells had been cultured, or on cover glass pre-incubated with RAW media (DMEM with 10% FBS), since Ramos cells adhered and spread irreversibly when plated on fresh cover glass in serum-free conditions. Ramos cell polarization was scored by observation of lamellipodial extensions by differential interference contrast microscopy.
Show full methods section
Cell lines and culture conditions RAW264.7
(RAW) cells were obtained from the American Type Culture Collection and maintained in DMEM with 10% heat-inactivated fetal bovine serum (FBS) (Wisent, Quebec, Canada). Cells were detached for subculturing or analysis by scraping. Ramos cells, a human Burkitt's B cell line, were generously provided by Dr. Alberto Martin (University of Toronto) and were maintained in IMDM (Gibco) + 10% FBS. All cell lines were grown in a humidified 37°C, 5% CO 2 incubator. Reagents Rituximab (RTX) was a generous gift from Dr. David Spaner (Sunnybrook Research Institute, Ontario, Canada) and was conjugated using an Alexa Fluor 488 Protein Labelling Kit (Invitrogen). Rat anti-mouse CD11b-PE/APC (clone M1/80) was obtained from the Sunnybrook Research Institute antibody facility, BD Pharmingen, or Biolegend and used as directed. Donkey anti-human DyLight 649 (DL649) antibody was obtained from Jackson ImmunoResearch. PP1 was from Biomol. LY294002 was from Calbiochem. Cytochalasin D, PKH26, dimethylsulfoxide (DMSO) and PAO were from Sigma.
Preparation of cells for trogocytosis
Ramos cells were opsonized with Alexa Fluor-488-conjugated RTX (RTX-Al488) for 20 minutes with agitation at 37°C. RTX-Al488 was used at a saturating concentration of 0.3 µg per 10 6 Ramos cells. In some experiments, Ramos cells were labelled with PKH26 according to manufacturer's instructions. Chemical inhibitors of internalization were used at 10 µM cytochalasin D, 30 µM PP1, or 50 µM LY294002, by incubation of RAW cells at 37°C for 30 minutes in RAW medium with serum immediately prior to the trogocytosis assay. 0.5% DMSO was used as a vehicle control. After adding RTX-Al488 coated Ramos cell suspensions to RAW cells, chemical inhibitors were restored to their appropriate concentrations. For PAO pretreatment of Ramos cells, cells were incubated with 30 µM PAO for 10 minutes, then washed twice to remove PAO before addition to RAW cells. Live microscopy of trogocytosis RAW cells (1×10 6 cells) were seeded on 25 mm diameter cover glass (Fisher Scientific), cultured overnight, then mounted in an Attofluor chamber (Molecular Probes) followed by imaging on a 37°C heated stage. RAW cell media was replaced with phenol red-free HEPES-buffered RPMI (HPMI) with serum (Wisent). Ramos cells (1×10 6 cells) were labelled with PKH26 (in some experiments), coated with RTX-Al488, resuspended in HPMI and laid over RAW cells. Epifluorescent microscope images were acquired with a Hamamatsu ORCA camera attached to a Zeiss Axiovert 200M microscope, with 40×1.3NA oil and 100×1.4NA oil objectives. Alternatively, scanning confocal microscope images were acquired with a Zeiss LSM 510 with a 63×1.2NA water objective. Time lapse data was generated by imaging at 30s intervals. Care was taken to minimize exposure time for each field of view to reduce photobleaching and phototoxicity. Data were analyzed with AxioVision (Zeiss) and Volocity (Improvision) software packages. For observation of Ramos cell motility, cells were viewed either on cover glass on which RAW cells had been cultured, or on cover glass pre-incubated with RAW media (DMEM with 10% FBS), since Ramos cells adhered and spread irreversibly when plated on fresh cover glass in serum-free conditions. Ramos cell polarization was scored by observation of lamellipodial extensions by differential interference contrast microscopy.
Flow cytometry-based trogocytosis assay
Ramos cells were labelled with the fluorescent lipid dye PKH26 (in some experiments), then opsonized with RTX-Al488. RAW cells were seeded in 6 well plates (10 6 cells/well) and cultured overnight. RAW cells were treated with appropriate chemical inhibitors for 30 minutes at 37°C and then cooled to 4°C. RAW medium was then replaced with Ramos cell suspensions, supplementing inhibitors where necessary. Ramos cells (2–4×10 6 cells per well) were provided to obtain a 2∶1 target: trogocyte ratio and were allowed to settle onto RAW cells for 10 minutes at 4°C. Trogocytosis was initiated by moving cells to a 37°C 5% CO 2 incubator, and stopped by moving cell mixtures to 4°C. Remaining surface-bound rituximab on RAW cells was labelled with DL649-conjugated anti-human antibody (0.6 µg per 10 6 cells) at 4°C for 10 minutes. Adherent cells were washed once with PBS. In some experiments, adherent cells were stained with fluorophore-conjugated CD11b at 4°C for 10 minutes and washed again. Adherent cells were then scraped, resuspended in PBS, and fixed with 2% paraformaldehyde prior to flow cytometry. Flow cytometry kinetic analysis The RAW population in the detached adherent cells was analyzed for the acquisition and internalization of RTX. Cells were initially gated for the main population of cells by scatter, which identifies both RAW and residual Ramos cells. RAW cells were identified by CD11b positivity or by excluding Ramos cells as events high in both PKH26 and anti-human DL649 ( Figure S1 ). RAW cell events were analyzed by an external RTX (anti-human) versus total RTX plot. Quadrants were drawn according to the 0 minute condition to define a double negative (DN) population, and infer a double positive (DP) population and total RTX single positive (SP) population (See Figure 6A ). These represent populations of RAW trogocytic intermediates and RAW cells that have trogocytosed and internalized RTX, respectively. Spillover events in the top left quadrant were not considered in the analysis. The exit of DN events into the DP population for conditions without chemical inhibitors was modelled by the exponential decay function (1) where A reflects the final proportion of RAW cells that respond (acquire RTX), and b , a rate constant. For chemical inhibition experiments (in which delay of transition to DP population was seen), the DN population was modelled by the sigmoidal function (2) where α represents the proportion of responding RAW cells, β , the rate constant, and γ the time required for half of the responding RAW cells to respond. Coefficients were determined by least-squares analysis by Excel's Solver function. A two-tailed paired Student's t-test was used to determine significance of differences between chemically-inhibited and control conditions.
Supporting Information Figure S1 Gating strategies for distinguishing RAW and Ramos cells. RAW and Ramos cells were incubated for 10 min to allow conjugates to form, then adherent cells were washed, detached and processed for flow cytometry. (A) Intact RAW-Ramos conjugates did not persist after cell processing. While a population of RAW cells acquired anti-human staining, very few show staining equivalent in total fluorescence to Ramos cells, as would be expected for cell-cell conjugates (dotted box). (B) Cells were stained with anti-CD11b-PE to distinguish RAW cells from Ramos. (C) RTX and anti-human staining analysis with CD11b+ RAW cells shown in blue and CD11b- Ramos in red, showing distinct populations. (D) Alternative gating strategy used in experiments where Ramos cells were PKH-labelled. Ramos cells were identified based on high staining with anti-human and PKH (shaded gate). (E) RTX and anti-human staining analysis with RAW and Ramos gated as in (D) in blue and red, respectively, showing populations similar to those seen with CD11b staining. (9.25 MB TIF) Click here for additional data file. Figure S2 Transfer of membrane is inhibited by cytochalasin D. PKH26 labelled, RTX-Al488 coated Ramos cells were coincubated with RAW cells for the times indicated. Co-transfer of RTX-Al488 and PKH26 occurs in the absence of cytochalasin D (top row). After treatment with cytochalasin D (bottom row), transfer is reduced, limited to RTX only, and observed only late in the reaction. (4.32 MB TIF) Click here for additional data file. Video S1 Ramos morphology and RTX localization. Reversible changes in morphology coincide with the enrichment of RTX-Al488 (green) at the cell-substrate interface. Opposite the uropod, extensive membrane projections are observed. Scale bar 10 µm. Images acquired every 30s, played at 15fps (450× RT). Total time: 30 min. (0.38 MB MP4) Click here for additional data file. Video S2 Ramos mobility. Live time lapse microscopy 90 minutes after the addition of RTX-Al488 (green) coated Ramos cells to RAW cells. A Ramos cell is shown moving along the glass surface while dynamically changing morphology. Asterisks indicate RAW cells performing trogocytosis of captured Ramos. Scale bar 10 µm. Images acquired every 30s, played at 15fps (450× RT). Total time: 30 min. (2.29 MB MP4) Click here for additional data file. Video S3 Uropod capture and trogocytosis at the RAW-uropod interface. Movie of live microscopy experiment shown in Figure 2A . RTX-Al488 (green) labeled Ramos cells were incubated with RAW cells. Scale bar 10 µm. Images acquired every 30s, played at 15fps (450× RT). Total time: 29.5 min. (1.24 MB MP4) Click here for additional data file. Video S4 Capture of Ramos cells and RTX-Al488 enrichment at interface. RTX-Al488 (green) labelled Ramos cells were incubated with RAW cells. Scale bar 10 µm. Images acquired every 30s, played at 15fps (450× RT). Total time: 30 min. (1.51 MB MP4) Click here for additional data file. Video S5 Multiple Ramos captured by a single RAW cell. RAW cells (*) are able to trogocytose from many Ramos cells at once. RTX-depleted mobile end of Ramos cell was not captured by RAW (red arrow). Time lapse taken 30 min after the addition of RTX-Al488 coated Ramos cells to RAW cells. Scale bar 10 µm. Images acquired every 30s, played at 15fps (450× RT). Total time: 30 min. (1.02 MB MP4) Click here for additional data file. Video S6 Streaming of trogocytosed RTX. Movement of trogocytosed RTX within RAW cells 1–1.5 hr after the addition of RTX-Al488 coated Ramos to RAW cells. Fading of fluorescence signal occurs as a result of photobleaching. Scale bar 10 µm. Images acquired every 30s, played at 15fps (450× RT). Total time: 30 min. (2.57 MB MP4) Click here for additional data file. Video S7 RAW cells after trogocytosis. Live microscopy imaging 1 hr after addition of RTX-Al488 coated Ramos cells to RAW cells. RTX has collected in large vacuolar compartments in many cells. Scale bar 10 µm. Images acquired every 30s, played at 15fps (450× RT). Total time: 5 min. (6.12 MB MP4) Click here for additional data file.
📊 Figures
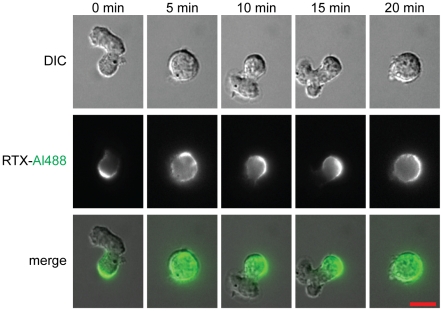
Figure 1
Dynamic morphology of Ramos B cells.
Selected frames from live microscopic imaging of RTX-Al488 coated Ramos cells ( Videos S1 ). Ramos cells were able to adhere to the substratum by the formation of a uropod as seen at the first time of...
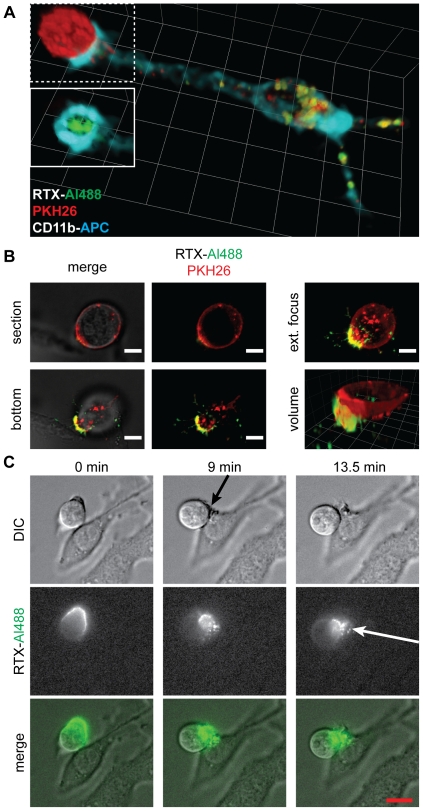
Figure 2
Concentration of RTX at RAW-Ramos interfaces.
(A) Volumetric reconstruction from confocal slices of a Ramos-RAW cell interface. RTX-Al488-coated (green), PKH26-labelled Ramos cells (red) were incubated with RAW cells for 45 minutes at 37u00b0C. R...
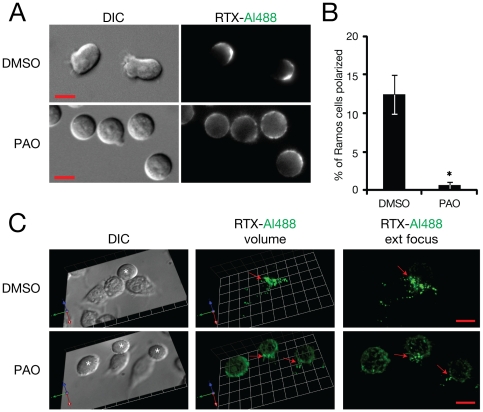
Figure 3
Effect of treatment of Ramos cells with PAO on cell polarization and RTX accumulation at cell-cell interfaces.
Opsonized Ramos cells were treated with 30 u00b5M PAO or DMSO vehicle for 10 min then washed. (A) Cell morphology and RTX distribution on live Ramos cells. (B) Quantitation of effect of PAO on Ramos c...
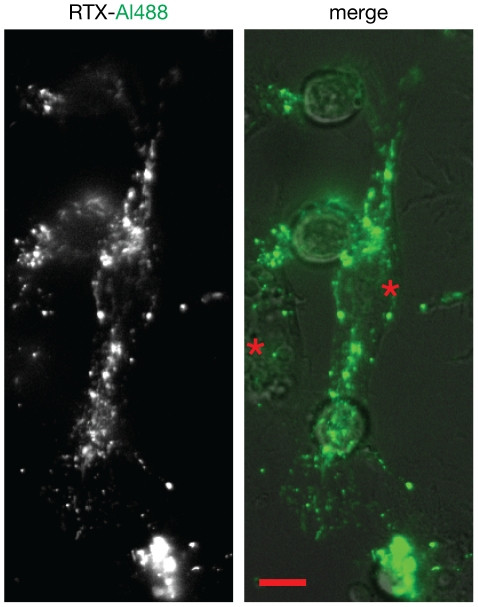
Figure 4
Distribution of trogocytosed RTX within RAW cells.
Acquired RTX-Al488 becomes widely distributed in RAW cells (*). Image taken 70 minutes after the addition of RTX-Al488 coated Ramos. Scale bar 10 u00b5m. See Video S6 .
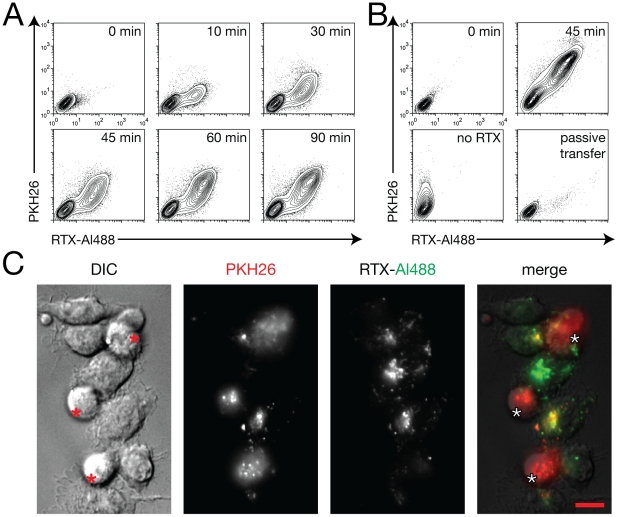
Figure 5
Cotransfer of PKH26 and RTX.
(A) Simultaneous acquisition of PKH26 and RTX-Al488 by RAW cells from Ramos cells was analyzed by flow cytometry. (B) Lack of acquisition of PKH26 and RTX-Al488 by RAW cells after 45 minutes when opso...
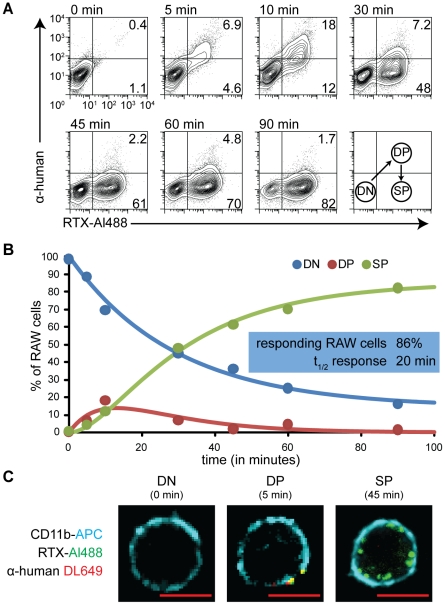
Figure 6
Kinetic analysis of acquisition and internalization of RTX by flow cytometry.
Internalization of acquired RTX was assessed by its inaccessibility to labelling with anti-human antibody. (A) RTX-Al488 coated Ramos cells were coincubated with RAW cells at 37u00b0C for the times in...
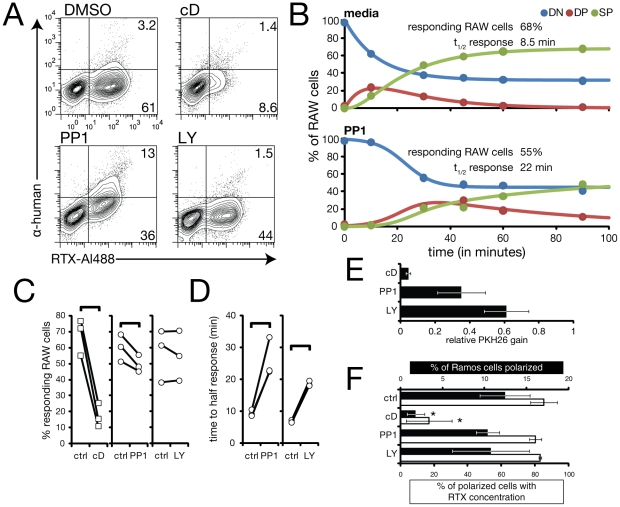
Figure 7
Kinetic analysis of chemical inhibition of trogocytosis.
(A) Analysis of RTX transfer and internalization as in Figure 5 after 45 min of trogocytosis in the presence of indicated inhibitors. cD, cytochalasin D. (B) Example kinetics of control versus PP1-inh...
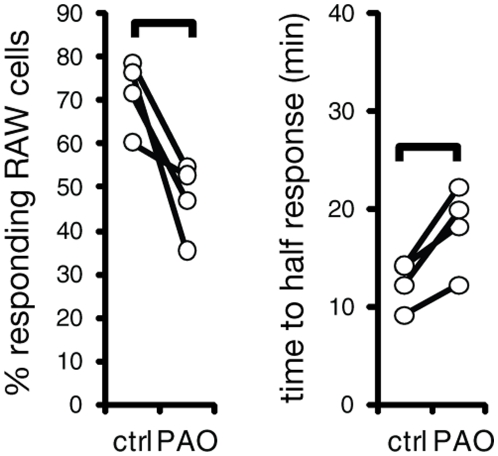
Figure 8
Effect of pre-treatment of Ramos cells with PAO on trogocytosis.
Ramos cells were pretreated with 30 u00b5M PAO for 10 min and washed before addition to RAW cells. Trogocytosis of RTX was analyzed by flow cytometry for percent responding RAW cells and time to half-...
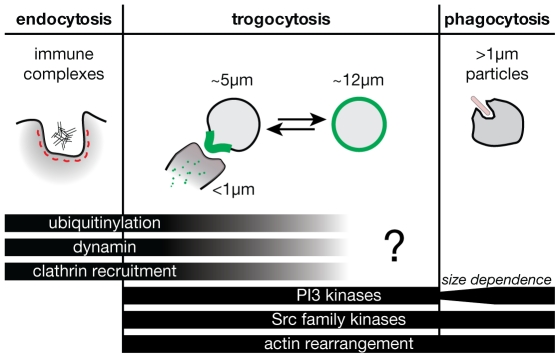
Figure 9
Trogocytosis may involve components of both the phagocytosis and endocytosis machinery.
Figure images are served from the NIH/NLM PubMed Central Open Access Subset or Europe PMC; copyright remains with the publishers and authors.
💬 Discussion
0 commentsNo comments yet. Be the first to start a discussion!
Leave a Comment