Abstract
Cytokinesis physically separates dividing cells by forming a contractile actomyosin ring. The fission yeast contractile ring has been proposed to assemble by Search-Capture-Pull-Release from cytokinesis precursor nodes that include the molecular motor type-II myosin Myo2 and the actin assembly factor formin Cdc12. By successfully reconstituting Search-Capture-Pull in vitro, we discovered that formin Cdc12 is a mechanosensor, whereby myosin pulling on formin-bound actin filaments inhibits Cdc12-mediated actin assembly. We mapped Cdc12 mechanoregulation to its formin homology 1 domain, which facilitates delivery of new actin subunits to the elongating actin filament. Quantitative modeling suggests that the pulling force of the myosin propagates through the actin filament, which behaves as an entropic spring, and thereby may stretch the disordered formin homology 1 domain and impede formin-mediated actin filament elongation. Finally, live cell imaging of mechano-insensitive formin mutant cells established that mechanoregulation of formin Cdc12 is required for efficient contractile ring assembly in vivo.The fission yeast cytokinetic ring assembles by Search-Capture-Pull-Release from precursor nodes that include formin Cdc12 and myosin Myo2. The authors reconstitute Search-Capture-Pull in vitro and find that Myo2 pulling on Cdc12-associated actin filaments mechano-inhibits Cdc12-mediated assembly, which enables proper ring assembly in vivo.
🔬 Techniques
🧬 Organisms
✨ Fluorophores
🧪 Sample Preparation
🏭 Microscope Brands
🧪 Reagent Suppliers
📷 Detectors
💻 Software Details
💾 Data Repositories
🏛️ Research Organizations (ROR)
Affiliated research institutions:
📋 Methods
Buffers Buffer A. 10 mM imidazole, pH 7.0, 50 mM KCl, 1 mM MgCl 2 , 1 mM EGTA, 50 mM DTT, 0.2 mM ATP, 15 mM glucose, 20 µg ml −1 catalase, 100 µg ml −1 glucose-oxidase, and 0.8% (wt/vol) methylcellulose (400 cP). Buffer B. 0.5 mM MgCl 2 and 0.2 mM EGTA. Buffer C. 2 mM Tris-Cl, pH 8.0, 0.2 mM ATP, 0.1 mM CaCl 2 , 1 mM NaN 3 and 0.5 mM DTT. Buffer D. 10 mM Hepes, pH 7.5, 100 mM KCl, 1 mM MgCl 2 , 0.1 mM CaCl2 and 1 mM ATP. Buffer E. 20 mM Hepes, pH 7.4, 200 mM KCl, 0.01% NaN 3 , 1 mM DTT and 10% glycerol. Buffer F. 300 mM NaCl, 10 mM imidazole pH 7.4, 5 mM MgCl 2 , and 1 mM EGTA , 2 mM DTT, 7% w/v sucrose, 0.5 mM 4 -(2-Aminoethyl) benzenesulfonyl fluoride hydrochloride, 5 µg ml −1 leupeptin, 0.5 mM phenylmethylsulfonyl fluoride and 0.4 mg ml −1 benzamidine. Buffer G. 300 mM NaCl, 10 mM imidazole pH 7.4, 1 mM EGTA, 1 mM NaN 3 , 50% glycerol (vol/vol), 2 mM DTT and 1 µg ml −1 leupeptin. Buffer H. 50 mM Tris-Cl, pH 7.5 and 600 mM NaCl. Buffer I. 25 mM imidazole, pH 7.4, 25 mM KCl, 4 mM MgCl 2 , 1 mM EGTA and 10 mM DTT.
Protein expression and purification
Ca-ATP actin was purified from rabbit skeletal-muscle acetone powder (Peel Freez Biologicals, Rogers, AR) 50 and labeled on Cys374 with Oregon Green iodoacetamide (Life Technologies, Carlsbad, CA) 51 , or on surface lysines with Alexa488-succinimidylester (Life Technologies) 52 , 53 . Immediately before each experiment Ca-ATP actin was converted to Mg-ATP actin by adding 0.1 volumes of Buffer B. Coding sequence for the Myo2 heavy chain (HC) was cloned into the Sf9 -baculovirus expression system vector pAcSG2 (BD Biosciences, San Jose, CA). The light chains (LC), Cdc4 and Rlc1, were cloned into pAcUW51 (BD Biosciences), a dual-promoter vector that drives expression of both LCs. DNA encoding the Myo2 heavy chain was followed by a biotin tag enabling the specific attachment to Neutravidin-labeled microspheres, and a FLAG tag to facilitate purification by affinity chromatography. The biotin tag is an 88-amino acid sequence segment from the E.coli biotin carboxyl carrier protein, which is biotinylated at a single Lys residue when expressed in Sf9 cells 54 , 55 . Sf9 cells were co-infected with recombinant baculovirus coding for the HC and LC constructs and grown in suspension and harvested at 72 h. The cells were resuspended in ice-cold Buffer F and lysed by sonication and pelleted after addition of 2 mM MgATP. The resulting supernatant was incubated with anti-FLAG resin (Sigma) for 1 h and washed with lysis buffer. The sample was eluted off the column with 100 μg ml −1 FLAG peptide (Sigma) in lysis buffer. Protein-rich fractions were pooled and concentrated by Amicon-Ultra filtration (EMD Millipore, Billerica, MA), followed by dialysis against Buffer G. Catalytically inactive Myo2 (referred to as NEM-Myo2) was prepared by treating 3 µM Myo2 with 1 mM N-Ethylmaleimide (Sigma) in Buffer H for 5 h on ice. The reaction was diluted 10-fold in Buffer I before dialysis against 500 ml Buffer I containing 50% glycerol and storage at −20 °C. Inactivation was tested in a conventional filament-gliding assay, where NEM-Myo2 was non-specifically adhered to the surface of a clean plain coverslip after which phalloidin-stabilized green (ex:488) F-actin (15% Alexa488-actin) in motility buffer (Buffer I containing 2 mM ATP, 15 mM glucose, 20 µg ml −1 catalase, and 100 µg ml −1 glucose-oxidase) was introduced to the flow chamber and filament-gliding efficiency was assessed by TIRF microscopy. Amino- and carboxy-terminal SNAP-tagged fission yeast formin Cdc12(FH1FH2) and mammalian formin mDia2(FH1FH2-C) containing a carboxy-terminal His(6x)-tag to facilitate purification were expressed from an overnight culture of E.coli (BL21-Codon Plus (DE3)-RP strain) cells induced with 500 µM IPTG at 16 °C and purified using Talon® metal affinity resin (Clontech, Mountain View, CA) 13 . Chimeric Cdc12(FH1)-mDia2(FH2-C) and mDia2(FH1)-Cdc12(FH2) formin constructs were cloned by fusing the SNAP-FH1 portion of wild-type formin SNAP-Cdc12(FH1FH2)-6xHis (Met1-Lys287) and SNAP-mDia2(FH1FH2-C)-6xHis (Met1-Phe286) to the respective FH2-6xHis portion of the other formin. Chimeric formin constructs were expressed and purified, as described above. SNAP-tagged formin constructs were biotinylated and fluorescently labeled overnight at 4 °C using equimolar concentrations of SNAP-Surface™ Biotin and SNAP-Surface™ 549 according to the manufacturer’s instructions (New England Biolabs, Ipswich, MA). Excess dye was removed by dialyzing the labeled protein in Buffer E for 6 h at 4 °C 51 . Fission yeast profilin was overexpressed in E.coli and purified by poly- l -proline affinity chromatography 56 , 57 .
Show full methods section
Buffers Buffer A. 10 mM imidazole, pH 7.0, 50 mM KCl, 1 mM MgCl 2 , 1 mM EGTA, 50 mM DTT, 0.2 mM ATP, 15 mM glucose, 20 µg ml −1 catalase, 100 µg ml −1 glucose-oxidase, and 0.8% (wt/vol) methylcellulose (400 cP). Buffer B. 0.5 mM MgCl 2 and 0.2 mM EGTA. Buffer C. 2 mM Tris-Cl, pH 8.0, 0.2 mM ATP, 0.1 mM CaCl 2 , 1 mM NaN 3 and 0.5 mM DTT. Buffer D. 10 mM Hepes, pH 7.5, 100 mM KCl, 1 mM MgCl 2 , 0.1 mM CaCl2 and 1 mM ATP. Buffer E. 20 mM Hepes, pH 7.4, 200 mM KCl, 0.01% NaN 3 , 1 mM DTT and 10% glycerol. Buffer F. 300 mM NaCl, 10 mM imidazole pH 7.4, 5 mM MgCl 2 , and 1 mM EGTA , 2 mM DTT, 7% w/v sucrose, 0.5 mM 4 -(2-Aminoethyl) benzenesulfonyl fluoride hydrochloride, 5 µg ml −1 leupeptin, 0.5 mM phenylmethylsulfonyl fluoride and 0.4 mg ml −1 benzamidine. Buffer G. 300 mM NaCl, 10 mM imidazole pH 7.4, 1 mM EGTA, 1 mM NaN 3 , 50% glycerol (vol/vol), 2 mM DTT and 1 µg ml −1 leupeptin. Buffer H. 50 mM Tris-Cl, pH 7.5 and 600 mM NaCl. Buffer I. 25 mM imidazole, pH 7.4, 25 mM KCl, 4 mM MgCl 2 , 1 mM EGTA and 10 mM DTT.
Protein expression and purification
Ca-ATP actin was purified from rabbit skeletal-muscle acetone powder (Peel Freez Biologicals, Rogers, AR) 50 and labeled on Cys374 with Oregon Green iodoacetamide (Life Technologies, Carlsbad, CA) 51 , or on surface lysines with Alexa488-succinimidylester (Life Technologies) 52 , 53 . Immediately before each experiment Ca-ATP actin was converted to Mg-ATP actin by adding 0.1 volumes of Buffer B. Coding sequence for the Myo2 heavy chain (HC) was cloned into the Sf9 -baculovirus expression system vector pAcSG2 (BD Biosciences, San Jose, CA). The light chains (LC), Cdc4 and Rlc1, were cloned into pAcUW51 (BD Biosciences), a dual-promoter vector that drives expression of both LCs. DNA encoding the Myo2 heavy chain was followed by a biotin tag enabling the specific attachment to Neutravidin-labeled microspheres, and a FLAG tag to facilitate purification by affinity chromatography. The biotin tag is an 88-amino acid sequence segment from the E.coli biotin carboxyl carrier protein, which is biotinylated at a single Lys residue when expressed in Sf9 cells 54 , 55 . Sf9 cells were co-infected with recombinant baculovirus coding for the HC and LC constructs and grown in suspension and harvested at 72 h. The cells were resuspended in ice-cold Buffer F and lysed by sonication and pelleted after addition of 2 mM MgATP. The resulting supernatant was incubated with anti-FLAG resin (Sigma) for 1 h and washed with lysis buffer. The sample was eluted off the column with 100 μg ml −1 FLAG peptide (Sigma) in lysis buffer. Protein-rich fractions were pooled and concentrated by Amicon-Ultra filtration (EMD Millipore, Billerica, MA), followed by dialysis against Buffer G. Catalytically inactive Myo2 (referred to as NEM-Myo2) was prepared by treating 3 µM Myo2 with 1 mM N-Ethylmaleimide (Sigma) in Buffer H for 5 h on ice. The reaction was diluted 10-fold in Buffer I before dialysis against 500 ml Buffer I containing 50% glycerol and storage at −20 °C. Inactivation was tested in a conventional filament-gliding assay, where NEM-Myo2 was non-specifically adhered to the surface of a clean plain coverslip after which phalloidin-stabilized green (ex:488) F-actin (15% Alexa488-actin) in motility buffer (Buffer I containing 2 mM ATP, 15 mM glucose, 20 µg ml −1 catalase, and 100 µg ml −1 glucose-oxidase) was introduced to the flow chamber and filament-gliding efficiency was assessed by TIRF microscopy. Amino- and carboxy-terminal SNAP-tagged fission yeast formin Cdc12(FH1FH2) and mammalian formin mDia2(FH1FH2-C) containing a carboxy-terminal His(6x)-tag to facilitate purification were expressed from an overnight culture of E.coli (BL21-Codon Plus (DE3)-RP strain) cells induced with 500 µM IPTG at 16 °C and purified using Talon® metal affinity resin (Clontech, Mountain View, CA) 13 . Chimeric Cdc12(FH1)-mDia2(FH2-C) and mDia2(FH1)-Cdc12(FH2) formin constructs were cloned by fusing the SNAP-FH1 portion of wild-type formin SNAP-Cdc12(FH1FH2)-6xHis (Met1-Lys287) and SNAP-mDia2(FH1FH2-C)-6xHis (Met1-Phe286) to the respective FH2-6xHis portion of the other formin. Chimeric formin constructs were expressed and purified, as described above. SNAP-tagged formin constructs were biotinylated and fluorescently labeled overnight at 4 °C using equimolar concentrations of SNAP-Surface™ Biotin and SNAP-Surface™ 549 according to the manufacturer’s instructions (New England Biolabs, Ipswich, MA). Excess dye was removed by dialyzing the labeled protein in Buffer E for 6 h at 4 °C 51 . Fission yeast profilin was overexpressed in E.coli and purified by poly- l -proline affinity chromatography 56 , 57 .
TIRF microscopy
Ultraclean microscope cover glasses (24 × 40 mm, Fisher Scientific, Waltham, MA) were prepared, coated with mPEG-silane (5,000 MW Laysan Bio Inc., Arab, AL), and flow chambers (20 × 4 mm) were built using double-stick tape 51 . Biomimetic nodes containing myosin Myo2 or formin were prepared by coating non-fluorescent Neutravidin-labeled FluoSpheres (diameter 1 µm, Life Technologies) with biotinylated red (SNAP549) formin constructs or Biotin-Myo2. In brief, 10 µl microspheres (~ 1.8×10 8 particles) was washed with ddH 2 O and subsequently incubated with 5 µM formin or 3 µg ml −1 Myo2 in 30 µl Buffer D for 60 min at 4 °C. Microspheres were then washed three times with Buffer D (plus 1% BSA), recovered in 30 µl Buffer D (plus 0.1% BSA) and stored on ice. Similar to what has been proposed for in vivo node attachment 4 , 12 , formins and myosins were attached to their amino- and carboxy-terminal ends, respectively. Immediately before each experiment, myosin- and formin-coated microsphere stocks were diluted 2- to 5-fold into Buffer D (containing 0.1% BSA) yielding appropriate microsphere densities. Microspheres were incubated for 3 min before the flow chamber was rinsed with Buffer D (plus 1% BSA) and incubated for an additional 2 min. Immediately before the actin polymerization mix was applied, the flow chamber was rinsed with a 1:1 dilution of Buffer A. At last, 1.5 µM MgATP G-actin (10–15% Oregon green- or Alexa488-actin) was mixed with 3 µM profilin in Buffer A and immediately transferred to the flow chamber. In cases where individual red SNAP-formin dimers were immobilized on the glass surface, ultraclean PEG-silane coated glass coverslips were passivated with streptavidin (0.5 mg ml −1 in water), incubated with biotinylated SNAP-formin construct, and blocked with Buffer E (containing 0.5% BSA). Myosin-coated microspheres were included following the procedure described above. TIRF microscopy images of Oregon green- or Alexa488-labeled actin (ex:488 nm), and SNAP-549(red) formin (ex:561 nm) were collected at 5 s intervals with an iXon plus X-4818 EMCDD camera (Andor Technology) using an Olympus IX-50 microscope equipped with a plan-apochromatic through-the-objective TIRFM illumination lens (100 × , N.A. 1.45).
Quantitative immunoblotting of Myo2 on microspheres
The number of Myo2 motor heads bound to the microspheres was analyzed by quantitative immunoblotting with an antibody against the amino-terminal FLAG-tag epitope (DYKDDDDK) of the Myo2 head domain. Myo2-coated biomimetic nodes were prepared as described above, where for this purpose microspheres were coated with 30 µl containing initial concentrations of either 3 µg ml −1 (corresponds to the condition used in all experiments), 1.5, 0.75 or 0.375 µg ml −1 myosin. Microsphere density was monitored over the course of the preparation procedure yielding 1.35×10 8 particles per 30 µl sample. Samples were separated by SDS–PAGE (7.5% bis-acrylamide) and transferred onto a PVDF membrane (Immobilon-FL, 0.45 µm, Millipore) using a semi-dry transfer apparatus. Biomimetic node-bound myosin was detected by immunoblotting with 1:500 diluted mouse anti-FLAG M2 primary antibody (monoclonal, Sigma, #F3165) and 1:5,000 diluted IRDye 680RD-conjugated goat anti-mouse IgG (H+L, polyclonal, Licor Biotechnologies, Lincoln, NE, #P/N 925-68070) secondary antibody. Immunoblotted samples of-interest were imaged at 700 nm wavelength and quantified by densitometry using a Myo2-standard of known concentrations (indicated in Supplementary Fig. 2b ) of the 170 kDa full-length product. The total number of myosin heads per sample was determined and divided by the number of microsphere particles (9×10 7 particles) to calculate the motor head density. For Myo2-coated beads that were used in in this study, there are 2,000 myosin heads per bead yielding a density of 637 myosin heads per µm 2 .
S. pombe strains
The fission yeast strains used in this study are listed in Supplementary Table 3 . N-terminal cdc12 (residues 1–881) was amplified by PCR (iProof, Bio-Rad Laboratories, Hercules, CA) from S. pombe genomic DNA and cloned into pBluescript II KS(-) (Stratagene) with restriction enzymes XhoI and BamHI. mDia2 FH1FH2 domains (residues 521–1034) were fused to C-terminal cdc12 (residues 1391–1841) by overlap PCR, and cloned into pBluescript- cdc12 (N) by homologous recombination using the In-Fusion Advantage PCR Cloning Kit (Clontech) to make cdc12(N)::mDia2(FH1FH2)::cdc12(C) . The cdc12 promoter (1–700 bp upstream of the translation start site) (SacI) and monomeric GFP (NotI to SalI) were amplified and cloned into the S. pombe integration vector pJK210 58 . The cdc12 chimera construct was cloned by In-Fusion (XhoI to NotI) into the pJK210 vector to generate a plasmid containing the cdc12 promoter and cdc12(N)::mDia2(FH1FH2)::cdc12(C)::mGFP . Inserts of the recombinant plasmids were confirmed by sequencing. The chimera formin construct ( pJK210-P cdc12 -cdc12(N-term)-mDia2(FH1FH2)-cdc12(C-term)-GFP::ura4 +) was integrated into the ura4 locus 58 . Endogenous cdc12 was deleted through Kan -cassette gene replacement 59 . Markers for contractile rings, rlc1-tdTomato-NatMX6 60 , and spindle pole bodies, sad1-tdTomato-NatMX6 61 , were introduced to the formin chimera strains by mating.
Fluorescence live cell microscopy and imaging conditions
Cells were grown in liquid YE5S (yeast extract plus five supplements) media for 20 h at 25 °C and transferred to EMM5S (Edinburgh minimal medium plus five supplements) for 20 h before imaging. Contractile ring assembly was followed in cells spread onto a 25% gelatin EMM5S pad containing 0.1 mM n-propyl gallate 62 , 63 . For visualization of cytokinesis nodes, four Z-stacks of 0.5 μm slices were acquired at 100 ms exposure time every 15 s for 20 min. Identical imaging conditions were used for visualization of spindle pole bodies and contractile ring assembly, except when Z-stacks were collected every 20 s. Spinning disk confocal images were collected with an inverted Nikon Eclipse Ti-E microscope equipped with a CFI Plan Apo 1.2-numerical aperture (NA)/60× water-immersion objective (Nikon, Tokyo, Japan) and a TI-ND6-PFS Perfect Focus unit using 488 nm ( Rlc1-3GFP ) and 561 nm ( Sad1-tdTomato ) illumination from 50 mW solid-state sapphire lasers (Coherent, Santa Clara, CA). Images were collected on an Andor iXon 897 EMCCD camera (Andor, South Windsor, CT).
BODIPY-phallicidin cell staining and imaging
Fission yeast cells were stained with BODIPY-phallicidin 64 . In brief, BODIPY-phallicidin powder (Thermo Fisher Scientific, Waltham, MA) was resuspended in methanol to 0.2 units per µl and then aliquoted and lyophilized in a centrifugal evaporator for storage at −20 °C. Cells grown in YE5S were fixed in 16% formaldehyde for 5 min and washed with PEM buffer (0.1 M NaPIPES pH 6.8, 1 mM EGTA, 1 mM MgCl 2 ) three times, both at room temperature, then permeabilized in PEM buffer with 1% triton X-100 for 1 min. After the cells were spun at 7,000 RPM for 30 s, the supernatant was removed and cells were washed in PEM buffer three times. Cells were then resuspended in 10 µl PEM buffer. BODIPY-phallicidin powder was resuspended in PEM buffer to 1 unit per µl and then 1 µl of resuspended phallicidin was added to 10 µl cells and incubated for 30 min in the dark at room temperature. After incubations, cells were washed once with 1 ml PEM buffer, spun at 7,000 r.p.m. for 30 s, and the supernatant was removed. Cells were imaged on glass slides using a Zeiss Axiovert 200 M fitted with a 100×, 1.4 NA objective and Yokogawa CSU-10 spinning disk unit (McBain, Simi Valley, CA) equipped with a Cascade 512B EM-CCD camera (Photometrics, Tuscon, AZ) and a 50 mW 473-nm DPS laser.
Comparative FH1 domain sequence analysis
The sequences of formin homology 1 (FH1) domains from S.pombe Cdc12 (accession number: CAA92232.1 ) and M. musculus mDia2 (accession number: Q9Z207 .1) were aligned using MegAlign software (version 14.1.0.118) by DNASTAR, Inc. (Madison, WI). We defined a profilin-binding poly-L-proline track (PBT) as more than three consecutive proline residues 65 , 66 . PBT with > 12 consecutive prolines were counted as multiple tracks. Sequence similarity was determined in ClustalW mode, using the blosum62 amino acid table.
Data quantification and statistical analysis
All statistical analysis was performed with GraphPad Prism (version 6.0d, GraphPad Software, Inc., La Jolla, CA). Formin-mediated F-actin elongation was quantified by measuring the lengths over time of all filaments that underwent Search-Capture-Pull events. Filament lengths were measured every frame (frame interval 5 s) using ImageJ64 (NIH, Bethesda, MD) for up to 150 frames before and after Capture-Pull, and traces were recorded as regions of interest (ROIs). Plots of length vs. time for each individual filament gave the average elongation rate (subunits s −1 ) before, during, and after Capture-Pull. Using ImageJ64 along with the recorded ROIs, kymographs of representative Search-Capture-Pull events were generated that show the filament length ( y -axis) over time ( x -axis) with the barbed ends aligned at the bottom. An event was counted as Capture-Pull when the Myo2 bead of-interest underwent binding to a formin-elongating actin filament for longer than three consecutive frames and at the same time showed an obvious displacement towards the formin-bound barbed end of the filament during that encounter. Potential events for which the elongation rate after Capture-Pull (i.e. dissociation of the Myo2 bead) did not resume to the approximate baseline pre-capture elongation rate were excluded from the data set. For comparison of average formin-mediated F-actin elongation rates, the rates from during and after Capture-Pull were normalized to the rate before Capture-Pull and summarized in Box-Whisker plots (whiskers mark inter-quartile range). Statistically significant differences between the three states were calculated by using an ordinary one-way ANOVA along with the Tukey’s multiple comparisons test. Significant differences when p ≥ 0.05. n.s. indicates non-significant differences. A minimum of 7 independent but in most cases ≥10 independent experiments yielding an obvious Search-Capture-Pull event were used for the analysis (see also Supplementary Table 1 ). The minimum sample size requirement is based on experience and the fact that the observed differences between different conditions were statistically highly significant ( p 1.15). To visualize node distribution in cdc12 control and mDia2 mutant S. pombe cells during contractile ring assembly, 3-dimensional surface plots were generated using open source software Gnuplot ( http://gnuplot.info ). Pixel intensities were averaged using the individual intensity values for each of the eight surrounding pixels, the average background intensity values were subtracted. The arbitrary units were scaled so that the peak intensity for the respective cell was 1.0, making control cdc12 and mutant mDia2 3D projections comparable. Representative cells expressing the ring marker Rlc1-3xGFP were selected and 3D surface intensity plots were generated from still images taken 8 min before a mature ring had assembled. Cell dimensions were plotted along the x - and y -axis in increments of 2 µm, while relative fluorescence intensity (in a.u.) was plotted along the z -axis. Contractile rings in fission yeast cells were visualized upon BODIPY-phallicidin staining. An ROI encompassing the contractile ring was created in cells in which the contractile ring had formed but not yet begun constriction. Mean fluorescence of the BODIPY-phallicidin in each ring was measured using ImageJ64. In line with previous studies that performed these types of analysis 64 , a minimum of 20 randomly picked cells were analyzed and unless specified otherwise the two groups were compared using the Student’s t -test (unpaired, one-sided). Full details of mathematical modeling Determining Myo2 head number engaged with captured F-actin : To compute how many myosin heads are able to bind to an actin filament, we compute the fraction of the surface area within a certain distance of the actin filament. For this calculation, based on the fact that the entire surface of the microspheres is coated with Neutravidin, the ~ 2,000 myosin heads were treated as uniformly distributed across the surface area of the myosin bead (radius R bead = 500 nm) in the in vitro experiments and 20 myosin heads 12 are spread evenly over half the surface of a spherical node (radius R node = 25 nm) in vivo (Supplementary Fig. 2d ). Therefore, the myosin head density in vitro is 637 per µm 2 in vitro and ~ 5,000 per µm 2 in vivo. To account for some flexibility of an individual myosin, we make the approximation that the ability to bind at a distance is Gaussian distributed around a mean length of l myo = 100 nm 67 with a s.d. of 5%, that is σ myo = 0.05 l myo : documentclass[12pt]{minimal} usepackage{amsmath} usepackage{wasysym} usepackage{amsfonts} usepackage{amssymb} usepackage{amsbsy} usepackage{mathrsfs} usepackage{upgreek} setlength{oddsidemargin}{-69pt} begin{document}$$Gleft( x right) = {e^{ - frac{{{{left( {x - {l_{{rm{myo}}}}} right)}^2}}}{{2,sigma _{{rm{myo}}}^2}}}}$$end{document} G x = e - x - l myo 2 2 σ myo 2 Due to the (assumed) spherical symmetry of the nodes, we assume without loss of generality that in cartesian coordinates the node is aligned with x = 0, and separated by a distance d actin in the z-direction and that the myosin binds to the nearest position along the filament (at the same y position as the myosin is bound to the sphere). In spherical coordinates, this assumption can be represented as: documentclass[12pt]{minimal} usepackage{amsmath} usepackage{wasysym} usepackage{amsfonts} usepackage{amssymb} usepackage{amsbsy} usepackage{mathrsfs} usepackage{upgreek} setlength{oddsidemargin}{-69pt} begin{document}$$Dleft( {{d_{{rm{actin}}}},R,theta ,phi } right) = sqrt {delta {x^2} + delta {y^2} + delta {z^2}} \ = sqrt {{{left( {R{rm{sin}}left( theta right){rm{cos}}left( phi right)} right)}^2} + {0^2} + {{left( {R + {d_{{rm{actin}}}} - R{rm{cos}}left( theta right)} right)}^2}}$$end{document} D d actin , R , θ , ϕ = δ x 2 + δ y 2 + δ z 2 = R sin θ cos ϕ 2 + 0 2 + R + d actin - R cos θ 2 Given these assumptions, we integrate over the surface in spherical coordinates “counting” the number of myosins within range to bind the actin filament as a function of the distance of the actin filament from the bead/node. documentclass[12pt]{minimal} usepackage{amsmath} usepackage{wasysym} usepackage{amsfonts} usepackage{amssymb} usepackage{amsbsy} usepackage{mathrsfs} usepackage{upgreek} setlength{oddsidemargin}{-69pt} begin{document}$${N_{{rm{bead}}}}left( {{d_{{rm{actin}}}}} right) = frac{{{N_{{rm{myo}}}}mathop {int }nolimits_0^pi mathop {int }nolimits_0^{2pi } Gleft( {Dleft( {{d_{{rm{actin}}}},{R_{{rm{bead}}}},theta ,phi } right)} right)sin left( theta right){rm d}theta {rm d}phi }}{{4pi }}$$end{document} N bead d actin = N myo ∫ 0 π ∫ 0 2 π G D d actin , R bead , θ , ϕ sin θ d θ d ϕ 4 π The results of the calculation for these parameters are found in Supplementary Fig. 2d showing that for the number of myosin heads on the bead calculated from Supplementary Fig. 2b (2,000) and the number on a node (20) reported in ref. 12 , the number of myosin heads that can engage with an actin filament when the filament is separated from the bead by the size of the myosin is similar. This seems reasonable, given our observations that the myosin beads behave processively and show relatively long residence times (tens of seconds, e.g., Supplementary Movie 2 ) on actin filaments once they are engaged. Modified search-capture-pull model : To study the forces and dynamics of bead-bead coalescence based on the previous works of Vavylonis and co-workers 3 , 27 , we designed a simplified Search-Capture-Pull model (all parameters and variables are listed in Supplementary Table 3 ). The primary difference from the model of Laporte et al. 27 is that we use a representation where the average behavior of motors on the myosin bead is represented in such a way that the motor speed was set rather than the force, prescribing a force-velocity relationship to the myosin behavior. The details of the model are presented below. Our system has three components: (1) “nodes” of diameter d representing the formin and myosin-coated beads in experiments; (2) actin filaments, represented as polymers that are attached to a formin node and extend from the barbed end; and (3) motor attachments, represented as springs bound at one end to a formin node and at the other end to an actin filament, while processing towards the barbed end of the actin filament. Simulations were performed in two dimensions for simplicity and to mimic experimental and in vivo conditions, where nodes are constrained to a quasi-2D region. Simulations were started with an initial distance of 5 µm for every data point shown, 48 simulations were run and analysed if a capture event took place, as happened in >50% of cases. Our system was simulated using overdamped Langevin dynamics as in ref. 27 , using the equations of ref. 68 to perform the integration. For each time-step of length dt the positions of every particle R i ( t ) was updated using the following rule (with the exception of the motor attachment, see below): documentclass[12pt]{minimal} usepackage{amsmath} usepackage{wasysym} usepackage{amsfonts} usepackage{amssymb} usepackage{amsbsy} usepackage{mathrsfs} usepackage{upgreek} setlength{oddsidemargin}{-69pt} begin{document}$${R_i}left( {t + dt} right) = {R_i}left( t right) + dtfrac{{{F_i}}}{{{zeta _i}}} + sqrt {frac{{{k_{rm B}}T,dt}}{{2{zeta _i}}}} left( {Wleft( {t + dt} right) + Wleft( t right)} right)$$end{document} R i t + d t = R i t + d t F i ζ i + k B T d t 2 ζ i W t + d t + W t where F i is the force on particle I , ζ i is the drag felt by particle I , and W ( t ) is a random number chosen at time t from a Gaussian distribution of mean = 0 and unit standard deviation. The forces in the above equation come from the derivative of the energy function of the system. There are three types of interactions in the system. An actin filament is composed of a series of particles connected by springs, and a motor attachment is also a spring, each having a rest length l 0 and spring constant k , such that documentclass[12pt]{minimal} usepackage{amsmath} usepackage{wasysym} usepackage{amsfonts} usepackage{amssymb} usepackage{amsbsy} usepackage{mathrsfs} usepackage{upgreek} setlength{oddsidemargin}{-69pt} begin{document}$$Uleft( l right) = frac{1}{2}k{left( {l - {l_0}} right)^2}$$end{document} U l = 1 2 k l - l 0 2 For actin filaments, we chose a value of k smaller than the actual measured value as in ref. 27 for efficient simulations, which does not seem to affect any important properties of filaments or even cross-linked actin networks. Actin filaments have an angular potential of the form documentclass[12pt]{minimal} usepackage{amsmath} usepackage{wasysym} usepackage{amsfonts} usepackage{amssymb} usepackage{amsbsy} usepackage{mathrsfs} usepackage{upgreek} setlength{oddsidemargin}{-69pt} begin{document}$$Uleft( theta right) = frac{1}{2}kappa {left( {theta - {theta _0}} right)^2}$$end{document} U θ = 1 2 κ θ - θ 0 2 where documentclass[12pt]{minimal} usepackage{amsmath} usepackage{wasysym} usepackage{amsfonts} usepackage{amssymb} usepackage{amsbsy} usepackage{mathrsfs} usepackage{upgreek} setlength{oddsidemargin}{-69pt} begin{document}$$kappa = {k_{rm B}}T,{L_{rm p}}/{l_0}$$end{document} κ = k B T L p ∕ l 0 was set to achieve an actin persistence length value L p , with l 0 the length of an actin segment, and θ 0 setting the rest angle to straight (180°). Finally, as in ref. 27 a restoring torque was applied using the first two particles of the actin filament to keep the filament at its initial angle from the formin bead, and in contrast to ref. 27 , we do not allow this angle to change since it is also not observed within the resolution of our experimental setup. This force is applied perpendicular to the angle between the filament and the formin bead, and is of the form documentclass[12pt]{minimal} usepackage{amsmath} usepackage{wasysym} usepackage{amsfonts} usepackage{amssymb} usepackage{amsbsy} usepackage{mathrsfs} usepackage{upgreek} setlength{oddsidemargin}{-69pt} begin{document}$${F^{rm rot}}left( theta right) = frac{{{k_{rm rot}}}}{{{l_0}}}left( {theta - {theta _0}} right)$$end{document} F r o t θ = k r o t l 0 θ - θ 0 where l 0 is the length of the first actin segment. A force of this magnitude is applied to the first particle of the actin filament and the negative of that force to the second particle of the filament (with overall sign depending on the definition of vector perpendicular to the filament). Drags on particle I , ζ i are set as in ref. 27 and are proportional to the viscosity, which can be tuned depending on the experimental conditions. In the Langevin dynamics described above, nodes by default feel a drag viscosity documentclass[12pt]{minimal} usepackage{amsmath} usepackage{wasysym} usepackage{amsfonts} usepackage{amssymb} usepackage{amsbsy} usepackage{mathrsfs} usepackage{upgreek} setlength{oddsidemargin}{-69pt} begin{document}$${zeta _i} = 6pi eta left( {D/2} right)$$end{document} ζ i = 6 π η D ∕ 2 and actin particles feel a drag for a rod length l 0 : documentclass[12pt]{minimal} usepackage{amsmath} usepackage{wasysym} usepackage{amsfonts} usepackage{amssymb} usepackage{amsbsy} usepackage{mathrsfs} usepackage{upgreek} setlength{oddsidemargin}{-69pt} begin{document}$${zeta _i} = frac{{4pi eta {l_0}}}{{ln left( {frac{{{l_0}}}{{2a}}} right) + 0.84}}$$end{document} ζ i = 4 π η l 0 ln l 0 2 a + 0.84 where a is the radius of an actin filament. We also allowed the drag on the nodes to be set independently of the drag on the actin filaments, to allow us to test the observed effect of variable experimental conditions resulting in different drag forces on biomimetic nodes in vitro, and the effect of being membrane-bound in vivo. Actin filaments : For the data analysed in this work, each formin node has two actin filaments attached and polymerizing, which balances the polymerization force before each capture. In each case, a random angle to the horizontal was chosen between −60° and 60°. The first actin segment connects the center of the formin bead to the first actin particle, which is placed on the surface of the formin node to make this initial angle. A second actin particle is added l 0 away from the first actin particle and the formin node center. The spring connecting the formin node and first actin particle has the same stiffness as the actin segments, scaled linearly to account for its length of D /2. A second filament is initialized diametrically opposite to this one. Polymerization is accomplished by extending the segment between actin particle 1 and 2 from length l 0 to 2 l 0 linearly. When this segment reaches twice its rest length, a new particle is inserted at the average position of these two particles. The spring constant on this first segment was scaled linearly to account for the longer length. In order to study the effect of formin arrest on node behavior, we set out to determine the force on the formin, and we chose to define this as the extensional force on this first actin segment. documentclass[12pt]{minimal} usepackage{amsmath} usepackage{wasysym} usepackage{amsfonts} usepackage{amssymb} usepackage{amsbsy} usepackage{mathrsfs} usepackage{upgreek} setlength{oddsidemargin}{-69pt} begin{document}$${F_{{rm{formin}}}} = kleft( t right)left( {lleft( t right) - {l_0}left( t right)} right)$$end{document} F formin = k t l t - l 0 t where the spring constant, length and rest length all change with time due to the extension of this segment. When the formin force exceeded a threshold F cut in any given time step, the extension of the first segment was stopped. Myosin dynamics : Myosin behavior is all performed at a longer time scale ( t event ) than the molecular dynamics event time, both for efficiency and to allow the system to respond to discrete myosin events, as would occur under experimental in vivo conditions. The distance of the closest particle on each actin filament to the myosin node was computed every t event , and when the closest particle on the actin filament fell within the capture radius (chosen as 110% of the node radius) a myosin link was added between the myosin bead and the closest particle on the actin filament. For simplicity in interpreting our results, we chose not to use a finite attachment rate, and neither did allow for detachment of the myosin node once engaged with the actin filament. The myosin attachment is represented as a spring, and the force due to stretching was used with a linear force–velocity relationship to determine the myosin ‘walking’ speed between 0 and 2 v myo . documentclass[12pt]{minimal} usepackage{amsmath} usepackage{wasysym} usepackage{amsfonts} usepackage{amssymb} usepackage{amsbsy} usepackage{mathrsfs} usepackage{upgreek} setlength{oddsidemargin}{-69pt} begin{document}$${v_{{rm{myo}}}} = v_{{rm{myo}}}^0left( {1 - frac{F}{{{F_{{rm{cut}}}}}}} right),,left| F right| < {F_{{rm{cut}}}}$$end{document} v myo = v myo 0 1 - F F cut , F < F cut The myosin attachment on the actin filament has a fixed relative position between the two actin particles of the segment to which it is attached, such that normal dynamics of the system stretches or compresses the motor as a regular spring. Every t event, the position of the motor head is moved towards the barbed end by a distance d = v myo t event . The forces on the myosin shown in Supplementary Figs. 5 and 8 are computed directly from the extension of myosin’s internal spring.
Code availability
The simulation code used in this study is freely available for use and modification upon request to the authors.
Data availability
All relevant data are available from the authors upon reasonable request.
Electronic supplementary material Supplementary Information Supplementary Movie 1 Supplementary Movie 2 Supplementary Movie 3 Supplementary Movie 4 Supplementary Movie 5 Supplementary Movie 6 Supplementary Movie 7 Peer Review File
📊 Figures
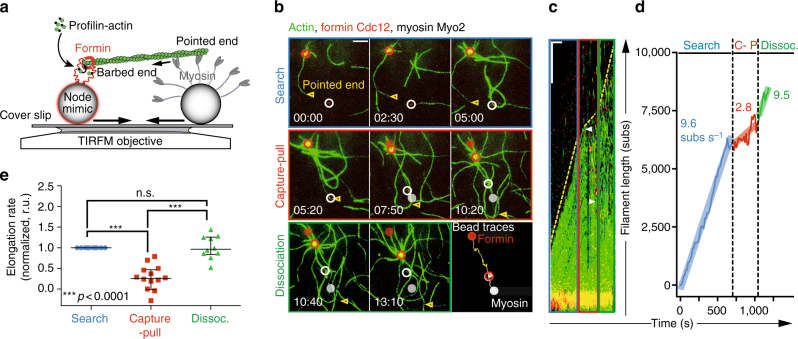
Fig. 1
Formin Cdc12-mediated actin assembly is inhibited by myosin Capture-Pull. a Schematic of reconstituted Search-Capture-Pull using node mimics, 1u2009u00b5m microspheres coated with either formin Cdc12 ...
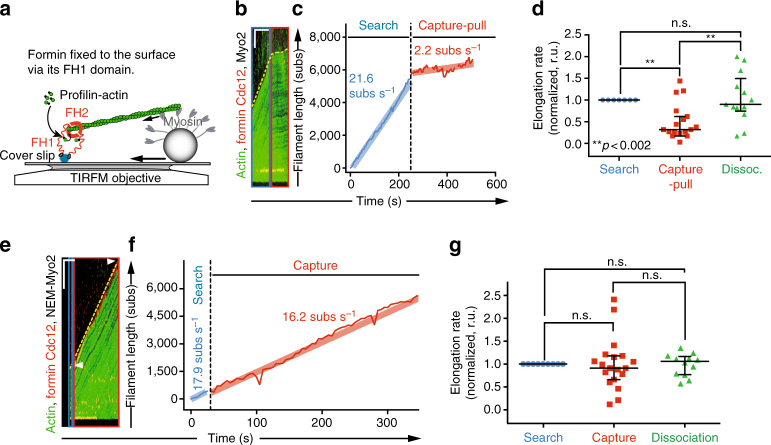
Fig. 2
Active myosin Myo2 pulling is required to inhibit formin Cdc12. a Schematic of reconstituted Search-Capture-Pull with individual formin dimers fixed to the glass surface via the formin homology FH1 do...
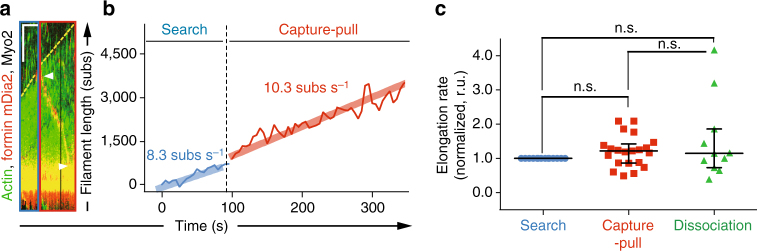
Fig. 3
Formin mDia2 remains active during Capture-Pull. a u2013 c TIRFM kymograph ( a , scale bars =u2009100u2009s and 5u2009u00b5m in x - and y -direction, respectively) and corresponding elongation rates (...
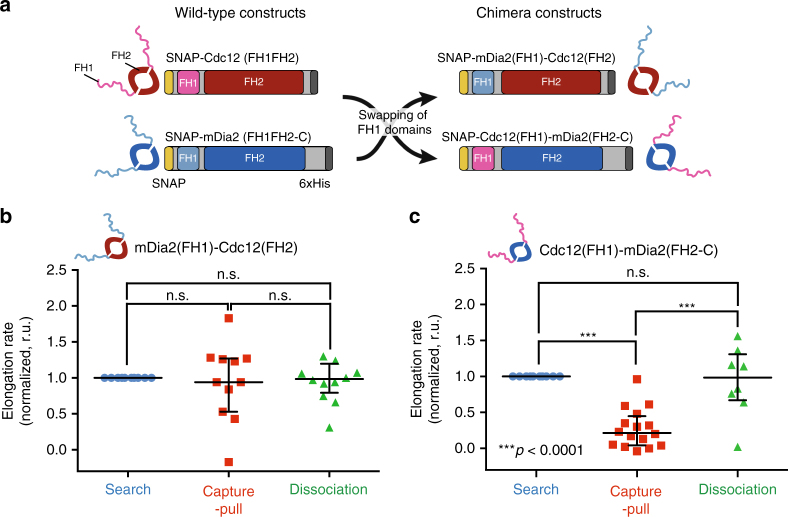
Fig. 4
Mechanosensitive inhibition maps to formin Cdc12u2019s FH1 domain. a Wild-type and chimeric formin constructs generated by exchanging the FH1 domains of Cdc12 and mDia2. b , c Normalized mDia2(FH1)-Cd...
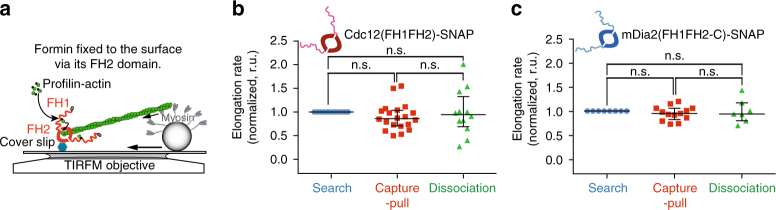
Fig. 5
Formin Cdc12 remains active when its FH2 domain experiences pulling force. a Schematic of reconstituted Search-Capture-Pull with individual formin dimers fixed to the glass surface via the formin homo...
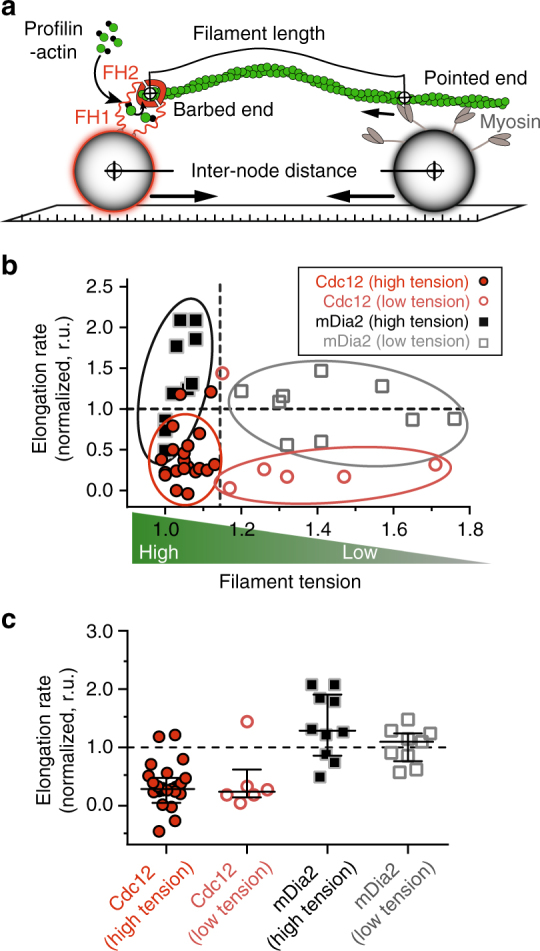
Fig. 6
Formin Cdc12u2019s force response does not require filament tension. a Illustration of filament tension T , the ratio of node-to-node contour filament length and formin node-to-myosin node distance. b...
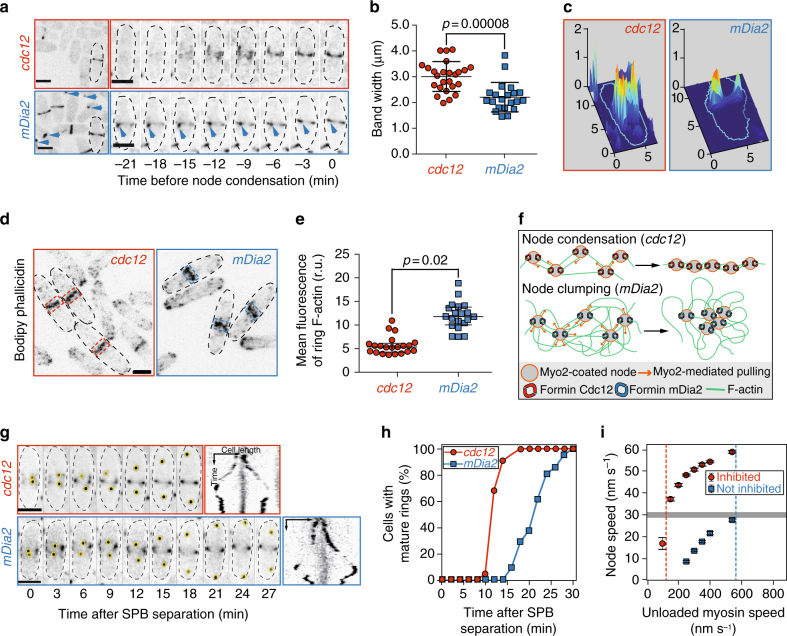
Fig. 7
Myosin-mediated inhibition of formin Cdc12 facilitates contractile ring assembly in vivo. a Representative fields and time-series of dividing control ( cdc12 ) and chimera mutant mDia2 (Cdc12N-mDia2FH...
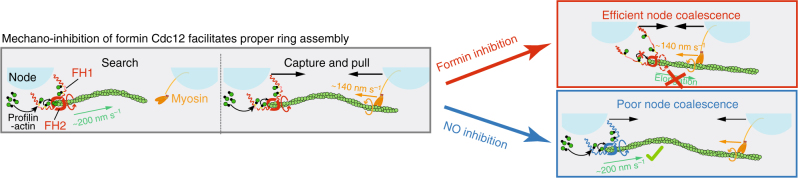
Fig. 8
Cartoon model of how mechano-inhibition of formin Cdc12 is critical for facilitating proper ring assembly from cytokinesis nodes. By slowing down in vivo F-actin polymerization rates to a level where ...
Figure images are served from the NIH/NLM PubMed Central Open Access Subset or Europe PMC; copyright remains with the publishers and authors.
💬 Discussion
0 commentsNo comments yet. Be the first to start a discussion!
Leave a Comment