Abstract
AbstractIncreasing evidence shows that the anti-tumor functions of tumor-infiltrating T lymphocytes (TILs) were inhibited significantly, but the underlying mechanisms remain not fully understood. In this study, we found that 14-3-3ζ expression was up-regulated in hepatocellular carcinoma (HCC) cells and in TILs. TILs with 14-3-3ζ high-expression (14-3-3ζhigh) exhibited impaired activation (CD69), proliferation (Ki67) and anti-tumor functions compared to 14-3-3ζ low expression (14-3-3ζlow) TILs. Flow cytometry assay showed that compared with 14-3-3ζlow CD8+T cells, 14-3-3ζhigh ones exhibited higher frequency of exhausted phenotypes as measured by inhibitory receptors such as PD-1, TIM-3, LAG3, and CTLA-4. 14-3-3ζ overexpression inhibited the activity and proliferation of peripheral blood CD3+ T cells, deviated the differentiation of naive T cells from effector T cells to regulatory T cells. Moreover, we found that 14-3-3ζ expression levels in TILs correlated positively with those in HCC cells. Naive T cells co-cultured with HCC cells or the visible components of culture medium of HCC cells exhibited increased 14-3-3ζ expression. Stochastic optical reconstruction microscopy (STORM) and confocal assay showed that 14-3-3ζ-containing exosomes derived from HCC cells could be swallowed by T cells, suggesting that 14-3-3ζ might be transmitted from HCC cells to TILs at least partially through exosomes. In conclusion, our study for the first time demonstrated that 14-3-3ζ is up-regulated in and inhibited the anti-tumor functions of tumor-infiltrating T cells in HCC microenvironment and that 14-3-3ζ might be transmitted from HCC cells to T cells at least partially through exosomes.
🔬 Techniques
🔭 Microscopes
💻 Software
✨ Fluorophores
🧪 Sample Preparation
🔬 Cell Lines
🏭 Microscope Brands
🧪 Reagent Suppliers
💻 Software Details
🏛️ Research Organizations (ROR)
Affiliated research institutions:
📋 Methods
Patients Fresh HCC tissues, corresponding adjuvant noncancerous tissues, and HCC serum samples were collected from patients undergoing hepatectomy between Sep, 2016 and Feb, 2017. Peripheral blood samples were collected before hepatectomy. Healthy serum samples were randomly selected from patients receiving physical examination at the First Affiliated Hospital of Nanjing Medical University (Nanjing, China). The study was approved by our Institutional Ethics Committee and performed in accordance with the Helsinki Declaration and government policies. All participants have signed the written informed consent. Clinical and pathological characteristics were summarized in Table 1 . Animals Male C57BL/6 mice were bred and maintained under specific pathogen-free conditions in the Laboratory Animal Center of Nanjing Medical University. Immature mice were intraperitoneal injected (ip) with 25 μg/g diethylnitrosamine (DEN) at two-week old for once and subsequently challenged with 0.5 μg/g CCl4 (ip) once a week from four-week old to the end. Mice were killed under ether anesthesia at design time point and tissue samples were carefully collected. All animals received humane care and all experiments were carried out according to the guidelines outlined in the Guide for the Care and Use of Laboratory Animals. Cells and cell transfection Human PBTC were cultured in RPMI-1640 medium (Invitrogen) supplemented with 10% heat-inactivated FBS, 100 U/ml penicillin, and 100 mg/ml streptomycin (Invitrogen). For lenti-virus construction, the 14-3-3ζ sequence was synthesized by GenScript Inc (China), short-hairpin RNA to interfere 14-3-3ζ in MHCC97H cells was purchased from (sc-29583, Santa Cruz, CA, USA), and then were inserted into lentiviral vector PCDH. For retrovirus construction, the 14-3-3ζ sequence was synthesized by GenScript Inc (China) and subcloned into retroviral vector pMXs. Retroviral particles were generated by 293 T cells and transfected into CD3 + T cells or naive T cells 24 h after activation with anti-human CD3/CD28 beads. Lentiviral particles were generated by 293 T cells, and transduced into SMCC7721 cells. Then, transductants were placed into puromycin-containing medium for 3 days before culture. Isolation of lymphocyte, CD3 + , CD4 + , CD8 + T cells and naive T cells Fresh human HCC tissues (the tissue volume was recorded) were obtained and maintained in phosphate-buffered saline (PBS), then cut into pieces and filtered through a 70 μm cell strainer (BD Biosciences) into a 50 ml Falcon tube. Human peripheral blood was collected from HCC patients or healthy volunteers (10 ml each). Single-cell suspensions were softly added to the surface of 10 ml Ficoll-Paque (GE Healthcare), then centrifuged at 400 × g for 30 min at 20 °C according to the manufacturer’s instructions. A portion of peripheral blood mononuclear (PBMC) or tumor infiltrating lymphocytes were used to separate T cells by using anti-human CD3, CD4, or CD8 beads, isolated cells were measured by subsequent flow cytometric analysis. For naive T cells separation, PBMC was labeled with anti-human CD45RA and CD197, then naive T cells (CD45RA + CD197 + ) were sorted with flow cytometry on BD ARIA III (BD Biosciences). Stimulation of T cells cRPMI-10 consisted of RPMI-1640 medium supplemented with 10% fetal bovine serum, antibiotic/antimycotic solution, and HEPES buffer (Sigma-Aldrich). Fetal bovine serum was from a single lot qualified for low background and high responses in flow cytometer assays. T cells were resuspended at 1 × 10 6 viable cells per ml in cRPMI-10 medium. For stimulation, 2 × 10 5 cells/well were plated in polypropylene U-bottom microtiter plates in a total volume of 200 µl of RPMI-1640. They were stimulated for 8 h at 37 °C, 5% CO 2 , using 10 ng/ml phorbol 12-myristate 13-acetate (PMA, Sigma-Aldrich), 500 ng/ml ionomycin (Sigma-Aldrich) and 1 g/ml Brefeldin A (BFA, Sigma-Aldrich). After then, T cells were measured by detection of CD69 expression using flow cytometry or used for RNA extration. Cells were stimulated with anti-CD3/CD28 beads (Thermo Fisher Scientific) at a 1:2 bead to cell ratio. Proliferation was then measured by detection of Ki67 expression using flow cytometry. Real time polymerase chain reaction (PCR) Total RNA was extracted from live cells or exosomes using TRIzol reagent (Invitrogen) according to the instructions and total RNAs (500 ng) were reverse transcribed using the PrimeScript RT Master Mix (Takara). The expression levels of 14-3-3ζ was deteced by quantitative real-time PCR using the SYBR Premix Ex Taq (Takara, Dalian, China) on the ABI Prism 7900HT (Applied Biosystems). The relative expression levels of 14-3-3ζ were normalized to GAPDH (for cells) or β-Actin (for exosomes). The reactions were incubated in a 384-well optical plate at 95 °C for 30 s, followed by 40 cycles of 95 °C for 5 s and 60 °C for 30 s. Related primer sequence was provided in Table S1 . Immunohistochemistry and western blot For IHC, tissues were fixed in 4% paraformaldehyde overnight at 4 °C, processed by paraffin embedding, then sectioned into 5 mm 3 slices, and dewaxed. Antigen retrieval was performed by heating the slides in the autoclave for 3 min using citrate buffer (pH6.0). The slides were incubated overnight at 4 °C with the following primary antibodies (diluted at 1/1000): anti-14-3-3ζ antibody (Cell signaling technology). Immunodetection was performed with a UltraSensitiveTM SP(Mouse/Rabbit) IHC Kit (Fuzhou Maixin Biotech.). Images were acquired using a microscope (Nikon, ECLIPSE 50i) equipped with software NIS Elements v4.0, and average IOD was obtained by randomly collecting and analyzing five fields per slide using Image-Pro Plus software v.5.0. Detection for each index was performed for at least three times. For western blot assay, total proteins were extracted from cells or exosomes using radio-immunoprecipitation assay buffer plus fresh protease and phosphatase inhibitors (Beyotime), then quantified with the Bradford assay (Bio-Rad Laboratories). Equal amounts of protein samples (30 μg) were loaded to each lane, then separated by sodium dodecyl sulfate polyacrylamide gel electrophoresis (SDS–PAGE) and subsequently transferred to a polyvinylidene fluoride membrane.
Show full methods section
Patients Fresh HCC tissues, corresponding adjuvant noncancerous tissues, and HCC serum samples were collected from patients undergoing hepatectomy between Sep, 2016 and Feb, 2017. Peripheral blood samples were collected before hepatectomy. Healthy serum samples were randomly selected from patients receiving physical examination at the First Affiliated Hospital of Nanjing Medical University (Nanjing, China). The study was approved by our Institutional Ethics Committee and performed in accordance with the Helsinki Declaration and government policies. All participants have signed the written informed consent. Clinical and pathological characteristics were summarized in Table 1 . Animals Male C57BL/6 mice were bred and maintained under specific pathogen-free conditions in the Laboratory Animal Center of Nanjing Medical University. Immature mice were intraperitoneal injected (ip) with 25 μg/g diethylnitrosamine (DEN) at two-week old for once and subsequently challenged with 0.5 μg/g CCl4 (ip) once a week from four-week old to the end. Mice were killed under ether anesthesia at design time point and tissue samples were carefully collected. All animals received humane care and all experiments were carried out according to the guidelines outlined in the Guide for the Care and Use of Laboratory Animals. Cells and cell transfection Human PBTC were cultured in RPMI-1640 medium (Invitrogen) supplemented with 10% heat-inactivated FBS, 100 U/ml penicillin, and 100 mg/ml streptomycin (Invitrogen). For lenti-virus construction, the 14-3-3ζ sequence was synthesized by GenScript Inc (China), short-hairpin RNA to interfere 14-3-3ζ in MHCC97H cells was purchased from (sc-29583, Santa Cruz, CA, USA), and then were inserted into lentiviral vector PCDH. For retrovirus construction, the 14-3-3ζ sequence was synthesized by GenScript Inc (China) and subcloned into retroviral vector pMXs. Retroviral particles were generated by 293 T cells and transfected into CD3 + T cells or naive T cells 24 h after activation with anti-human CD3/CD28 beads. Lentiviral particles were generated by 293 T cells, and transduced into SMCC7721 cells. Then, transductants were placed into puromycin-containing medium for 3 days before culture. Isolation of lymphocyte, CD3 + , CD4 + , CD8 + T cells and naive T cells Fresh human HCC tissues (the tissue volume was recorded) were obtained and maintained in phosphate-buffered saline (PBS), then cut into pieces and filtered through a 70 μm cell strainer (BD Biosciences) into a 50 ml Falcon tube. Human peripheral blood was collected from HCC patients or healthy volunteers (10 ml each). Single-cell suspensions were softly added to the surface of 10 ml Ficoll-Paque (GE Healthcare), then centrifuged at 400 × g for 30 min at 20 °C according to the manufacturer’s instructions. A portion of peripheral blood mononuclear (PBMC) or tumor infiltrating lymphocytes were used to separate T cells by using anti-human CD3, CD4, or CD8 beads, isolated cells were measured by subsequent flow cytometric analysis. For naive T cells separation, PBMC was labeled with anti-human CD45RA and CD197, then naive T cells (CD45RA + CD197 + ) were sorted with flow cytometry on BD ARIA III (BD Biosciences). Stimulation of T cells cRPMI-10 consisted of RPMI-1640 medium supplemented with 10% fetal bovine serum, antibiotic/antimycotic solution, and HEPES buffer (Sigma-Aldrich). Fetal bovine serum was from a single lot qualified for low background and high responses in flow cytometer assays. T cells were resuspended at 1 × 10 6 viable cells per ml in cRPMI-10 medium. For stimulation, 2 × 10 5 cells/well were plated in polypropylene U-bottom microtiter plates in a total volume of 200 µl of RPMI-1640. They were stimulated for 8 h at 37 °C, 5% CO 2 , using 10 ng/ml phorbol 12-myristate 13-acetate (PMA, Sigma-Aldrich), 500 ng/ml ionomycin (Sigma-Aldrich) and 1 g/ml Brefeldin A (BFA, Sigma-Aldrich). After then, T cells were measured by detection of CD69 expression using flow cytometry or used for RNA extration. Cells were stimulated with anti-CD3/CD28 beads (Thermo Fisher Scientific) at a 1:2 bead to cell ratio. Proliferation was then measured by detection of Ki67 expression using flow cytometry. Real time polymerase chain reaction (PCR) Total RNA was extracted from live cells or exosomes using TRIzol reagent (Invitrogen) according to the instructions and total RNAs (500 ng) were reverse transcribed using the PrimeScript RT Master Mix (Takara). The expression levels of 14-3-3ζ was deteced by quantitative real-time PCR using the SYBR Premix Ex Taq (Takara, Dalian, China) on the ABI Prism 7900HT (Applied Biosystems). The relative expression levels of 14-3-3ζ were normalized to GAPDH (for cells) or β-Actin (for exosomes). The reactions were incubated in a 384-well optical plate at 95 °C for 30 s, followed by 40 cycles of 95 °C for 5 s and 60 °C for 30 s. Related primer sequence was provided in Table S1 . Immunohistochemistry and western blot For IHC, tissues were fixed in 4% paraformaldehyde overnight at 4 °C, processed by paraffin embedding, then sectioned into 5 mm 3 slices, and dewaxed. Antigen retrieval was performed by heating the slides in the autoclave for 3 min using citrate buffer (pH6.0). The slides were incubated overnight at 4 °C with the following primary antibodies (diluted at 1/1000): anti-14-3-3ζ antibody (Cell signaling technology). Immunodetection was performed with a UltraSensitiveTM SP(Mouse/Rabbit) IHC Kit (Fuzhou Maixin Biotech.). Images were acquired using a microscope (Nikon, ECLIPSE 50i) equipped with software NIS Elements v4.0, and average IOD was obtained by randomly collecting and analyzing five fields per slide using Image-Pro Plus software v.5.0. Detection for each index was performed for at least three times. For western blot assay, total proteins were extracted from cells or exosomes using radio-immunoprecipitation assay buffer plus fresh protease and phosphatase inhibitors (Beyotime), then quantified with the Bradford assay (Bio-Rad Laboratories). Equal amounts of protein samples (30 μg) were loaded to each lane, then separated by sodium dodecyl sulfate polyacrylamide gel electrophoresis (SDS–PAGE) and subsequently transferred to a polyvinylidene fluoride membrane.
Antibodies against 14-3-3ζ
(Cell signaling technology), human reduced glyceraldehyde-phosphate dehydrogenase (GAPDH) (Cell Signaling Technology) and β-actin (Cell Signaling Technology) were used in immunoblotting. The integrated density of the bands was quantified using ImageJ software (NIH).
Exosomes isolation
Exosomes in supernatant were collected from HCC cells cultured for 48-72 h. The supernatant of cell culture medium was collected, then centrifuged at 800 × g for 5 min, followed by centrifugation of 2000 × g for 10 min to remove cellular debris. Then, the media was filtered through a 0.2 μm pore strainer (Syringe filter), and then ultracentrifuged at 100,000 × g for 2 h at 4 °C. The pellet was washed with 35 ml 1 PBS, followed by a second step of ultracentrifugation at 100,000 × g for 2 h at 4 °C. Afterwards, the supernatant was discarded. For serum exosomes isolation, serum was diluted in 1 × PBS and filtered through a 0.2 μm filter, then ultracentrifuged at 150,000 × g overnight at 4 °C. Next, the pellet was washed in 10 ml 1 × PBS followed by ultracentrifugation at 150,000 × g at 4 °C for 2 h. The pelleted (exosomes) was collected. Exosomes resuspended in 500 μl of Trizol were for RNA extraction, resuspended in 250 μl of lysis buffer (8 M Urea/2.5%SDS, 5 μg/ml leupeptin, 1 μg/ml pepstatin and 1 mM phenylmethylsulphonyl fluoride) for protein extraction or re-suspended in PBS for immunofluorescence staining.
Enzyme-linked immuno sorbent assay
(ELISA) assay Exosome suffering freezing and freeze-thaw cycles were used to extract protein for ELISA assay, which was performed with an ELISA Kit for 14-3-3ζ (R&D Systems Inc., Minneapolis, USA) according to the instruction. Immunofluorescence For CD63 immunofluorescence label of exosomes, 4 μl of exosome specimens was diluted in 400 μl of PBS buffer mixed with 1 μl of primary antibody (1 mg/ml rabbit anti-CD63, Thermofisher Scientific). Samples the were incubated for 2 h at room temperature. For the blank control, the PBS buffer instead of the primary antibody was used. Then, the reaction solution was treated with ultrafiltration (50 Kda) at 6000 rpm for 20 min. The precipitation was collected and suspended in PBS. Next, 1 μL of secondary antibody (2 mg/ml Alexa Fluor 647 labeled Goat anti-Rabbit IgG, ab150079, Abcam) was added. The mixture was vigorously stirred for 1 h at room temperature and then treated with ultrafiltration (50 Kda) at 6000 rpm for 20 min to remove excess reagents. The precipitation was collected and resuspended in 400 μL of PBS for stochastic optical reconstruction microscopy (STORM). To immunofluorescence label 14-3-3ζ, cells were fixed in fresh acetone followed by permeabilization in 0.2% Triton X-100/0.5% normal goat serum/PBS, then incubated with primary antibody against 14-3-3ζ (Cell signaling technology) and secondary antibodies labeled with FITC. DAPI was used for nuclear staining. The cells were visualized using Confocal Laser Scanning Microscope (Leica TCS SP8). Uptake of exosomes Exosomes were incubated in 1uM 1,1′-dioctadecyl-3,3,3′3′-tetramethylindocarbocyanine perchlorate (DiI, Thermofisher Scientific) for 20 min, followed by an additional round of PBS wash. PBS was then used to resuspend the exosomes for cell treatment. Cells were co-cultured with DiI-labeled exosomes for 2 h. To simultaneously label 14-3-3ζ, the immunofluorescence experiment followed a similar procedure as described above.
Flow cytometry assay Isolated
T cells were collected by centrifugation (330 × g , 5 min at 4 ℃) and cell counts were determined by using a Countess Counter (Invitrogen). For surface staining, cells were resuspended in PBS (with 2% FBS) containing the antibody, incubated on ice for 30 min, washed in PBS (with 2% FBS), and analyzed using flow cytometry. Flow cytometry assay was performed on CANTO II (BD Biosciences). For intracellular molecule detection, fixation and permeabilization buffers (eBioscience) were used according to the instructions. Data were collected on BD CANTO II (BD Biosciences) with FACSCanto software version 2.1 (BD). Antibodies used were described in Table S2 .
Statistical analysis
All statistical analyses were performed using SPSS 18.0 (SPSS Inc, Chicago, IL, USA) software and presented with the GraphPad prism software (GraphPad Software, San Diego, CA, USA). FlowJo 7.6.1, https://www.flowjo.com/solutions/flowjo ) was used to analyze and output the data of flow cytometry assay. Results of quantitative real-time PCR were expressed as mean ± S.E.M. Student’s t test. In all cases, P < 0.05 was considered significant.
Electronic supplementary material Fig S1 Fig S2 Fig S3 Fig S4 Fig S5 Table S1 Table S2
📊 Figures
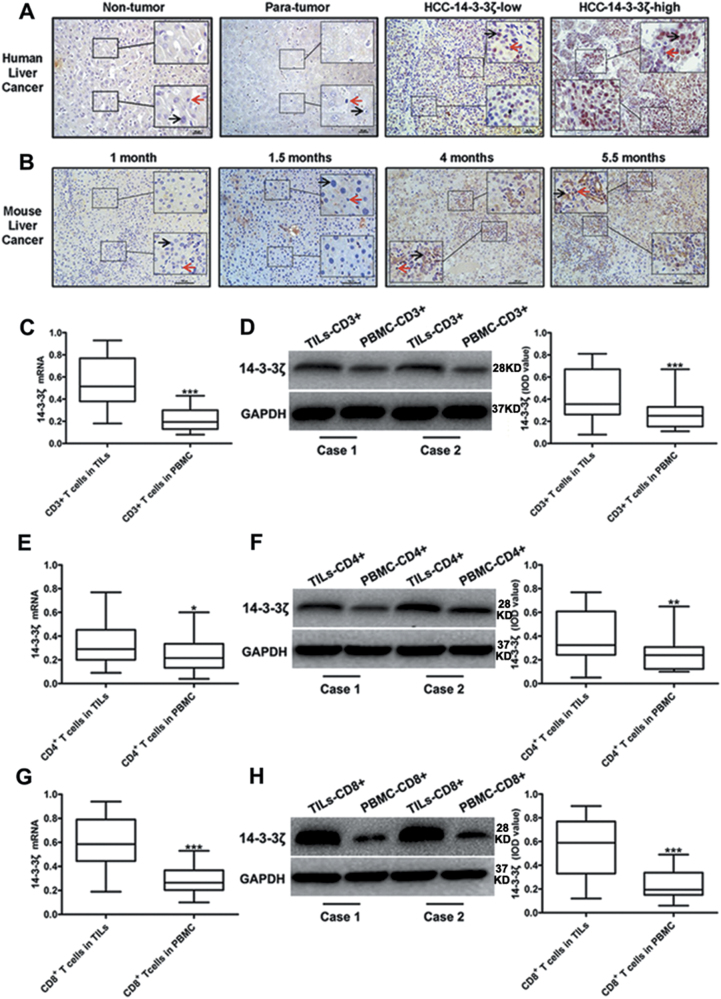
Fig. 1
The expression of 14-3-3u03b6 in HCC cells and TILs in HCC.
a Representative results of IHC staining of 14-3-3u03b6 in normal liver tissues ( n =u200910), paracancerous tissues ( n =u200928) and HCC tissues ( n =u200928). 14-3-3u03b6 was stained in brown and n...
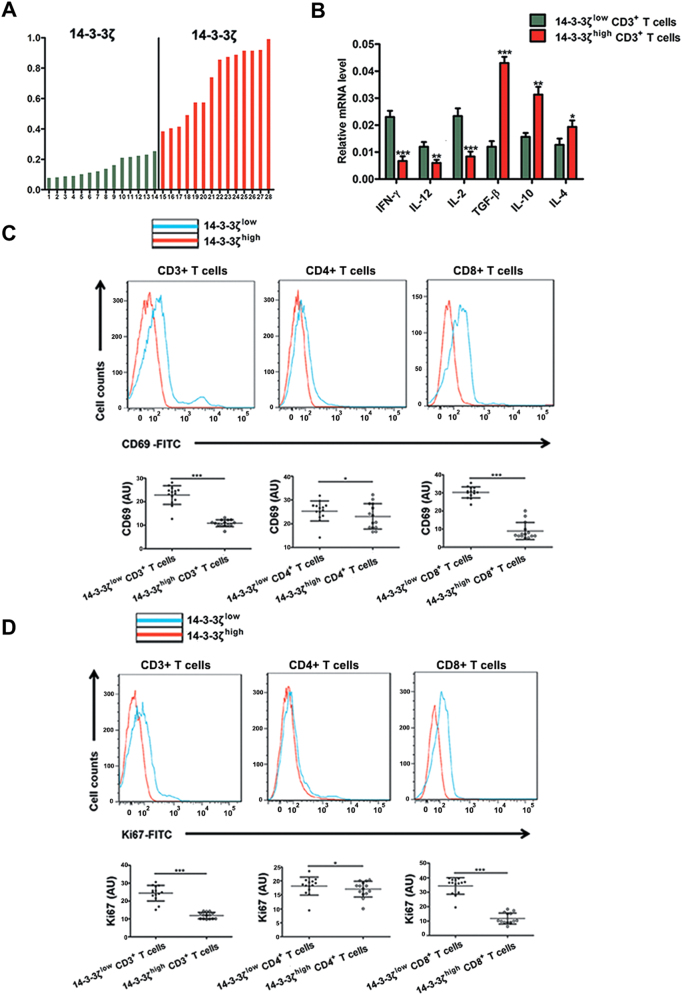
Fig. 2
Cytokine Secretion, cell viability and proliferation of T cells from 14-3-3u03b6 high and 14-3-3u03b6 low group.
a Totally 28 HCC tissues were divided into 14-3-3u03b6 low group and 14-3-3u03b6 high group according to the expression level of 14-3-3u03b6 in CD3 + T cells assay by western blot. A total of 28 tumor...
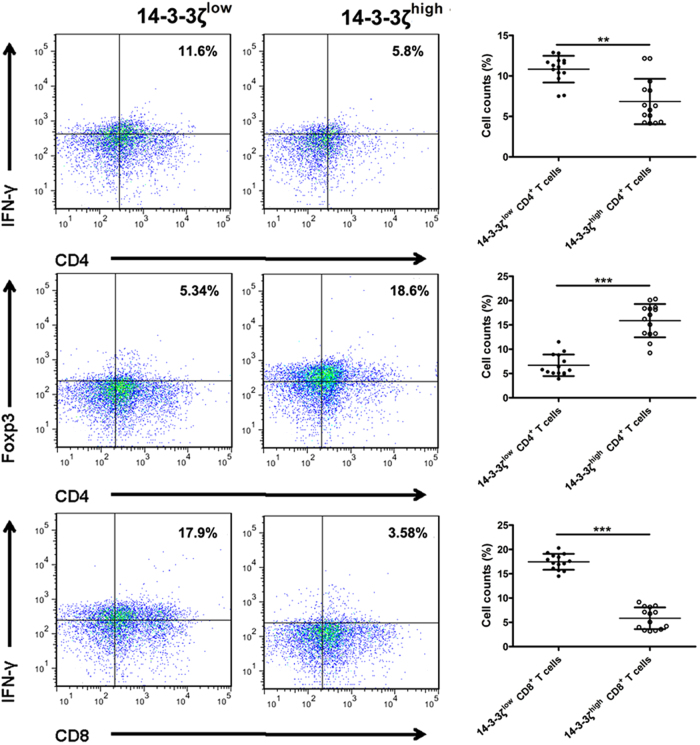
Fig. 3
Anti-tumor functions of T cells of 14-3-3u03b6 high and 14-3-3u03b6 low goups in HCC.
Flow cytometry analyses of the proportions of CD4 + IFN-u03b3 + , CD4 + Foxp3 + and CD8 + IFN-u03b3 + T cells among tumor-infiltrating CD3 + T cells from 14-3-3u03b6 high ( n =u200914) and 14-3-3u03b6...
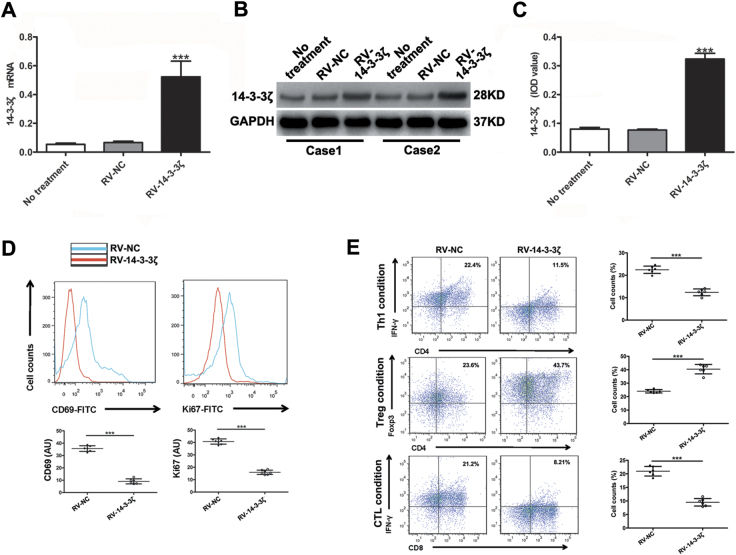
Fig. 4
14u20133u20133u03b6 overexpression inhibited the viability and proliferation of T cells and deviated the differentiation of naive T cell from effector T cells (T eff ) to regulatory T cells (T reg ).
a Naive T cells were transfected with empty retro-virus (RV-NC) or overexpressing 14-3-3u03b6 retro-virus (RV-14-3-3u03b6) then the mRNA level of 14-3-3u03b6 was detected by real-time PCR ( n =u20096)...
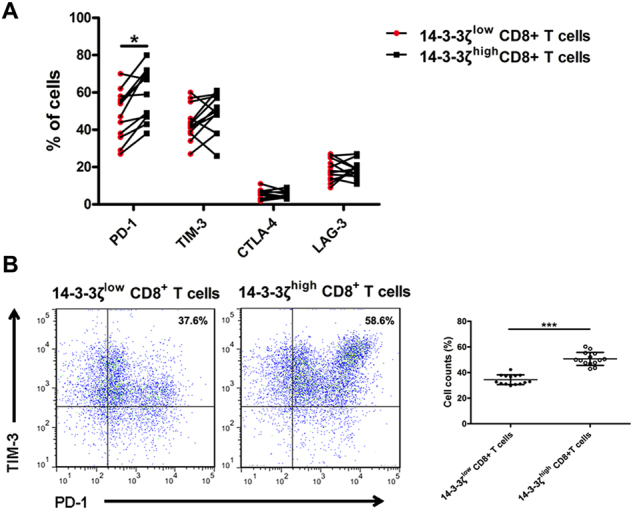
Fig. 5
Detection of the expression levels of inhibitory receptors on CD8 + T cells from 14-3-3u03b6 high and 14-3-3u03b6 low group.
a Flow cytometry assay of PD-1, TIM-3, CTLA-4 and LAG3 in 14-3-3u03b6 high CD8 + T cells ( n =u200914) and 14-3-3u03b6 low CD8 + T cells ( n =u200914). b Flow cytometry assay of PD-1 + TIM-3 + cells i...
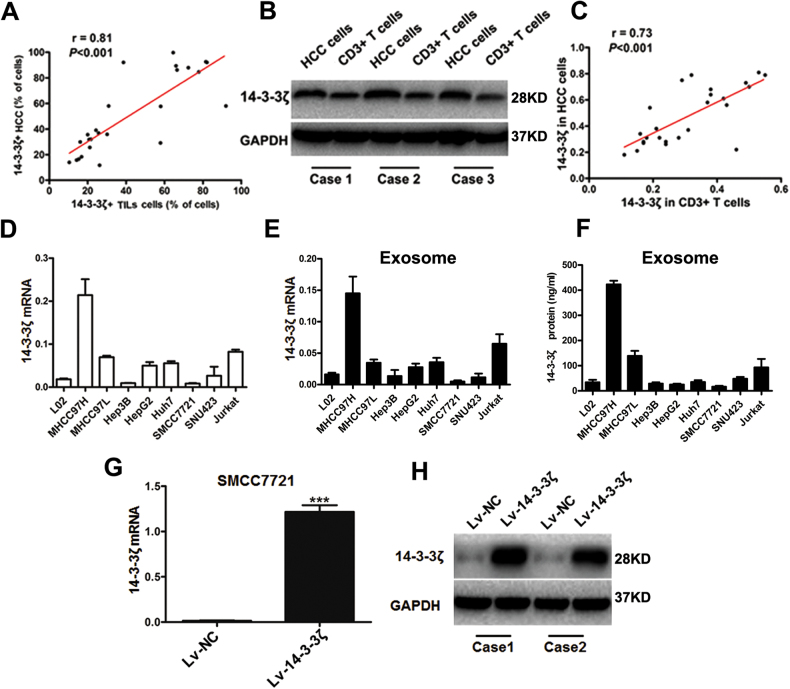
Fig. 6
14u20133u20133u03b6 was detected in T cells and HCC cells.
a Correlation between the percentages of 14-3-3u03b6-positive HCC cells and those of 14-3-3u03b6-positive TILs. b , c Left panel: Semiquantitative assay by western blot of the 14-3-3u03b6 expression i...
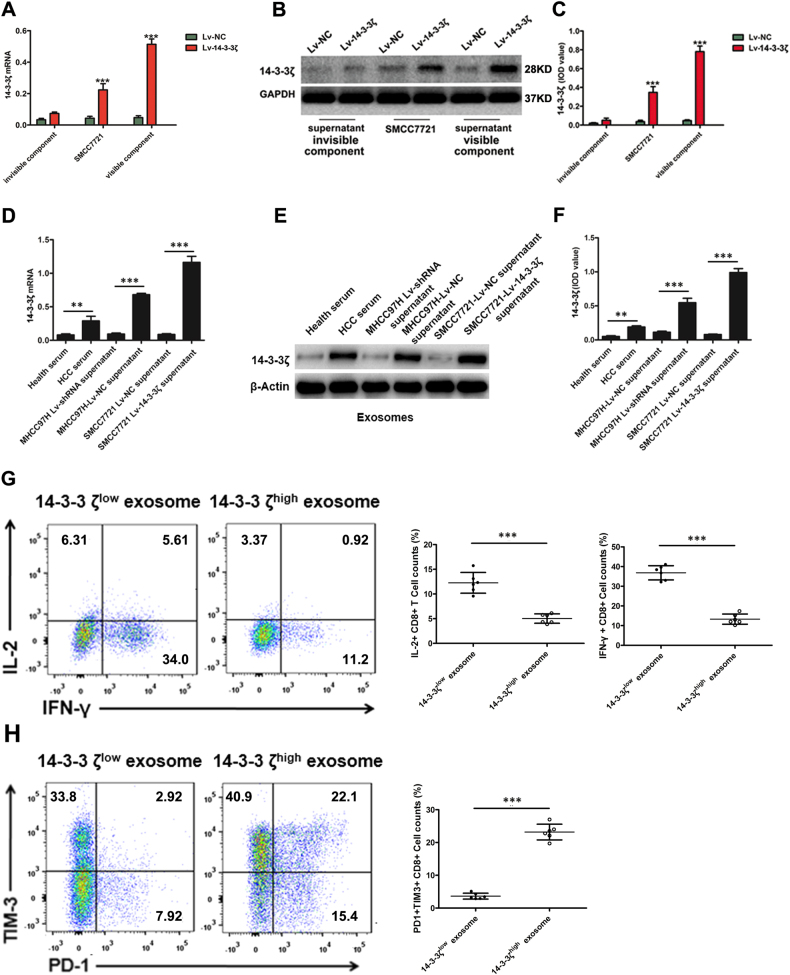
Fig. 7
14u20133u20133u03b6 was detected in co-cultured naive T cells and isolated exosomes.
a The mRNA level of T cells was detected by real-time PCR in naive T cells co-cultured with SMCC7721 transfected with Lv-NC or Lv-14-3-3u03b6, the invisible or visible components from the culture supe...
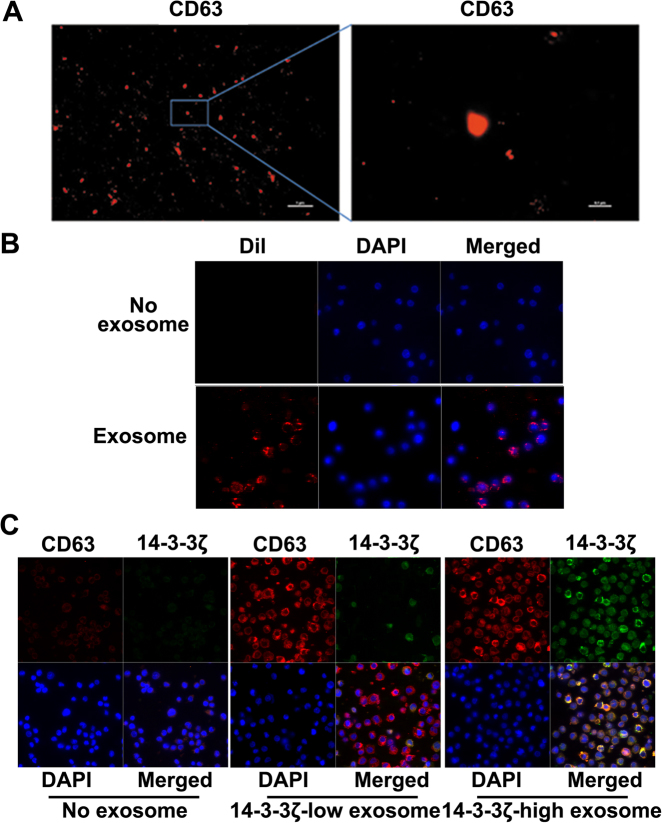
Fig. 8
Increased 14-3-3u03b6 expression in T cells mediated by HCC cell-derived exosomes.
a Exosomes stained with anti-human CD63 were detected by STORM (Scale: left panel, 1u2009u00b5m; right panel: 0.1u2009u00b5m) ( n =u20096). b Exosomes stained with dye for membrane (Dil, red) and subs...
Figure images are served from the NIH/NLM PubMed Central Open Access Subset or Europe PMC; copyright remains with the publishers and authors.
💬 Discussion
0 commentsNo comments yet. Be the first to start a discussion!
Leave a Comment