Abstract
The entry of calcium into mitochondria is central to metabolism, inter-organelle communication, and cell life/death decisions. Long-sought transporters involved in mitochondrial calcium influx and efflux have recently been identified. To obtain a unified picture of mitochondrial calcium utilization, a parallel advance in understanding the forms and quantities of mitochondrial calcium stores is needed. We present here the direct 3D visualization of mitochondrial calcium in intact mammalian cells using cryo-scanning transmission electron tomography (CSTET). Amorphous solid granules containing calcium and phosphorus were pervasive in the mitochondrial matrices of a variety of mammalian cell types. Analysis based on quantitative electron scattering revealed that these repositories are equivalent to molar concentrations of dissolved ions. These results demonstrate conclusively that calcium buffering in the mitochondrial matrix in live cells occurs by phase separation, and that solid-phase stores provide a major ion reservoir that can be mobilized for bioenergetics and signaling.
🔬 Techniques
🔭 Microscopes
✨ Fluorophores
🧪 Sample Preparation
🔬 Cell Lines
🏭 Microscope Brands
🧪 Reagent Suppliers
📷 Detectors
💻 Software Details
💾 Data Repositories
🏛️ Research Organizations (ROR)
Affiliated research institutions:
📋 Methods
Key resources table
Reagent type (species) or resource Designation Source or reference Identifiers Cell line WI-38 Coriell Institute NA06814 Cell line Human Dermal Microvascular Endothelial Cells (HDMEC) juvenile foreskin Promocell C-22020 Cell line U2OS ATCC HTB-96 Cell line MCF10A ATCC CRL-10317 Cell line mouse embryonic fibroblasts Weizmann Institute Stem Cell Core Unit MEFs Cell line mouse embryonic fibroblasts (MCU -/-) Pan et al., 2013 MEFs MCU -/- Cell line mouse embryonic fibroblasts (MCU +/+) Pan et al., 2013 MEFs MCU +/+ Cell culture and sample preparation WI-38 embryonic lung fibroblasts were purchased from Coriell and maintained in Minimal Essential Medium (Gibco) supplemented with 15% fetal calf serum, L-glutamine, and penicillin/streptomycin. MEFs were obtained from the Stem Cell Core Unit of the Weizmann Institute and maintained in Dulbecco’s modified Eagle’s medium (DMEM; Gibco) with 10% fetal calf serum, L-glutamine, and penicillin/streptomycin. MEFs from MCU -/- mice and MCU +/+ littermates were obtained from the laboratory of Toren Finkel at NIH and maintained in the same medium. Cell cultures grown in parallel to those placed on grids were genotyped by PCR using the primers shown in Figure 2—figure supplement 2 . These primers produce for MCU +/+ mice an expected amplicon of 190 bp that is eliminated in MCU -/- mice by insertion of the trapping vector ( Pan et al., 2013 ). MCF10A breast epithelial cells, obtained from the laboratory of Yosef Yarden at the Weizmann Institute, were grown in DMEM:F12 medium (Biological Industries) supplemented with 5% horse serum, L-glutamine, penicillin/streptomycin, 10 µg/ml insulin, 10 ng/ml EGF (Peprotech), 0.5 µg/ml hydrocortisone (Sigma), and 100 ng/ml cholera toxin (Sigma). U2OS cells, obtained from the laboratory of Benjamin Geiger at the Weizmann Institute, were maintained in DMEM (Gibco) supplemented with 10% fetal calf serum, 5% L-glutamine, and penicillin/streptomycin.
Show full methods section
Key resources table
Reagent type (species) or resource Designation Source or reference Identifiers Cell line WI-38 Coriell Institute NA06814 Cell line Human Dermal Microvascular Endothelial Cells (HDMEC) juvenile foreskin Promocell C-22020 Cell line U2OS ATCC HTB-96 Cell line MCF10A ATCC CRL-10317 Cell line mouse embryonic fibroblasts Weizmann Institute Stem Cell Core Unit MEFs Cell line mouse embryonic fibroblasts (MCU -/-) Pan et al., 2013 MEFs MCU -/- Cell line mouse embryonic fibroblasts (MCU +/+) Pan et al., 2013 MEFs MCU +/+ Cell culture and sample preparation WI-38 embryonic lung fibroblasts were purchased from Coriell and maintained in Minimal Essential Medium (Gibco) supplemented with 15% fetal calf serum, L-glutamine, and penicillin/streptomycin. MEFs were obtained from the Stem Cell Core Unit of the Weizmann Institute and maintained in Dulbecco’s modified Eagle’s medium (DMEM; Gibco) with 10% fetal calf serum, L-glutamine, and penicillin/streptomycin. MEFs from MCU -/- mice and MCU +/+ littermates were obtained from the laboratory of Toren Finkel at NIH and maintained in the same medium. Cell cultures grown in parallel to those placed on grids were genotyped by PCR using the primers shown in Figure 2—figure supplement 2 . These primers produce for MCU +/+ mice an expected amplicon of 190 bp that is eliminated in MCU -/- mice by insertion of the trapping vector ( Pan et al., 2013 ). MCF10A breast epithelial cells, obtained from the laboratory of Yosef Yarden at the Weizmann Institute, were grown in DMEM:F12 medium (Biological Industries) supplemented with 5% horse serum, L-glutamine, penicillin/streptomycin, 10 µg/ml insulin, 10 ng/ml EGF (Peprotech), 0.5 µg/ml hydrocortisone (Sigma), and 100 ng/ml cholera toxin (Sigma). U2OS cells, obtained from the laboratory of Benjamin Geiger at the Weizmann Institute, were maintained in DMEM (Gibco) supplemented with 10% fetal calf serum, 5% L-glutamine, and penicillin/streptomycin.
Human dermal endothelial cells
(HDMEC) supplied by Promocell (Heidelberg, Germany) were obtained from the laboratory of Ronen Alon at the Weizmann Institute and grown in the endothelial cell growth medium purchased from Promocell. WI-38 and MCF10A cell cultures were tested for mycoplasma every 3 weeks. Gold Quantifoil R3.5/1 grids were subjected to glow-discharge treatment and immediately immersed in water by placing them carbon-side up onto a glass (fibroblasts) or tissue-culture treated plastic (other cell types) coverslip affixed to the bottom of a tissue culture dish to facilitate manipulation of grids with surgical tweezers. Grids in the open tissue culture dishes filled with water were then UV sterilized for half an hour in a tissue culture hood. Grids for MCF10A, U2OS, and HDMEC cells were coated with fibronectin after sterilization. For all cell types, water was replaced with the appropriate culture medium, and cells were plated onto the grids. Cultures on grids were grown to 30–70% confluence, typically over 2 or 3 days. Immediately prior to vitrification, grids were lifted from the coverslip platform in the tissue culture dish, 1 μl colloidal gold (10 nm) ( Duchesne et al., 2008 ) at a concentration of 120 nM in phosphate buffered saline was added to provide fiducial markers, and 4 μl of cell culture medium at 37°C was placed on the cell side of the grid. The grids were blotted at 21°C and >90% humidity for 2–4 s from the side opposite the cells, flash-frozen in liquid ethane using a Leica EM-GP plunger, and stored in liquid nitrogen until use. FCCP (Sigma) was prepared as a 1 mM stock in DMSO and diluted 1:1000 into the medium of WI-38 fibroblasts cultured on grids to give a final concentration of 1 μM. Cells were grown for a further 24 hr before vitrification. Doxorubicin (Sigma) was prepared as a 2 mM stock in DMSO and diluted 1:2000 into WI-38 fibroblasts cultured on grids to give a final concentration of 1 μM. Samples were vitrified 16 hr after doxorubicin treatment. JC-1 was prepared as a 1 mg/ml stock in DMSO and diluted 100-fold into warm medium, which was then mixed 1:1 with the medium of cells cultured on grids. After 30-min incubation, cells were washed with PBS and vitrified. The following is an accounting of the number of tomograms collected and the number of mitochondria observed for the different cell types and treatments. Mitochondria were counted as distinct if they did not share matrix content. During the course of this study, about 22 tomograms of untreated WI-38 fibroblasts that had grown 2 to 4 days on grids were collected. Altogether 66 mitochondria were observed in reconstructions of these tomograms, and all these mitochondria contained granules. In addition, 13 tomograms were collected from WI-38 fibroblasts that had grown for 6 or 7 days on grids without exchange of medium and were near confluence. Thirty mitochondria were observed in these tomograms, 15 of which contained granules. Seven tomograms of wild-type MEFs yielded 33 mitochondria, all containing granules, whereas 3 tomograms of MCU-/- MEFs showed 17 mitochondria, 7 of them lacking granules). Two tomograms of U2OS (eight mitochondria, all with granules), 6 tomograms of HDMEC (26 mitochondria, all with granules) and 3 tomograms of MCF10A cells (14 mitochondria, 7 of which had no granules) were acquired. Nine tomograms of WI-38 (59 mitochondria, 10 of which had no deposits) were taken after doxorubicin treatment, and 8 tomograms (68 mitochondria, none of which contained deposits) were taken after FCCP treatment. In addition to full tomograms, numerous single STEM images of cell regions were taken during this study. Due to the time investment in collecting tomograms, cell regions were not chosen randomly for tomography but were rather selected for ideal depth (600 nm to 1 μm) and for the likelihood of containing mitochondria, as assessed by the presence in single STEM images of organelles that appeared slightly darker than bulk cytosol.
Cryo-light microscopy
Fluorescence imaging of JC-1 treated cells cryopreserved on Quantifoil grids was done using an Olympus BX51 microscope equipped with a cryostage (Linkam). LED excitation was at 470 nm. Emission was collected between 515 and 555 nm for the green channel and between 575 and 635 for the red channel. After fluorescence imaging, grids were stored in liquid nitrogen for subsequent electron microscopy.
Cryo-scanning transmission electron tomography
Vitrified cell samples were observed with a Tecnai F20 S/TEM instrument at 200 kV. STEM was performed with extraction voltage = 4300 V, gun lens = 3 or 6, and spot size = 5, with 10 or 20 μm condenser apertures, yielding probe diameters of 2 or 1 nm and semi-convergence angles of 1.3 or 2.7 mrad, respectively. The camera length was set either to 320 or to 520 mm so that the acceptance cone semi-angle at the bottom-mounted bright-field detector (BF; Gatan model 805, later upgraded to 806) was slightly larger than the illumination cone semi-angle, providing conditions for on-axis BF signal ( Rez et al., 2016 ). Simultaneous dark-field data were collected on a Fischione HAADF detector located at the 35 mm port of the microscope column. The geometry imposes a gap between the outer cutoff angle of the BF and the inner cutoff angle of the HAADF detectors; the ratio between these angles is approximately 4. Images of 1024 × 1024 or 2048 × 2048 pixels were recorded with probe dwell times between 5 and 20 µs, yielding frame exposure times of approximately 10 to 20 s. Spatial sampling was set between 1 and 4 nm/pixel. Doses, measured as described previously ( Wolf et al., 2014 ), were limited to 1–3 electrons/Å 2 per dwell spot. Single-axis tilt series were recorded using either FEI Xplore3D software or SerialEM ( Mastronarde, 2005 ), with angular sampling from ±60° in 2° steps. Data collection schemes were either sweeping from −60° to +60°, or collecting from +20° to −60°, and then from +22° to +60°. Dynamic focus adjustment was employed to maintain focus conditions perpendicular to the tilt axis at all tilt angles.
Tomogram reconstruction and segmentation
The tomographic tilt series were aligned using fiducial markers and reconstructed using weighted back projection ( Frangakis and Hegerl, 2001 ) as implemented in the IMOD software suite ( Kremer et al., 1996 ). Reconstructions are displayed after non-linear anisotropic diffusion filtering within IMOD. Tomograms will be deposited in the Electron Microscopy Data Bank. Segmentation and volume rendering were performed using Amira 6.3 (FEI Visualization Sciences Group). EDX measurements Energy-dispersive X-ray spectroscopy was performed in STEM mode on vitrified cell samples with the same electron microscope set-up as used for CSTET, using a liquid N 2 cooled Si(Li) detector (EDAX).
Preparation and analysis of amorphous calcium phosphate
Amorphous calcium phosphate was prepared according to published protocol ( Habraken et al., 2013 ). Briefly, 10 mM stocks of calcium chloride and potassium phosphate were prepared in Tris-buffered saline and mixed. At 1.5 min after mixing and every 5 min following, 5 μl were removed, placed on Quantifoil Multi A copper 200 mesh grids, and vitrified. Samples at several timepoints were inspected using CSTET and zero-loss energy-filtered cryo TEM tomography.
Zero-loss energy filtered cryo TEM tomography
Vitrified cell samples were observed with the same Tecnai F20 S/TEM instrument as used for CSTET, which is equipped with a Gatan Quantum 967 ‘special’ energy filter and K2 summit direct electron detector. Experiments were performed at 200 kV, with extraction voltage = 4300 V, gun lens = 4, and spot size = 5, a condenser aperture of 30 μm, and a zero-loss energy slit of 20 eV. Dose was set to 0.12 electrons/Å 2 /sec, with 9 s exposures divided over 18 frames in movie mode. Motion correction was performed using MotionCor2 ( Zheng et al., 2017 ). The data collection scheme was the same as used for CSTET. TEM tilt series were corrected for CTF using phase-flipping routine in IMOD. TEM imaging of thin cell sections For preparation of thin cell sections, WI-38 cells were grown on glass coverslips, fixed using 2.5% gluteraldehyde, 2% paraformaldehyde in 0.1 M sodium cacodylate buffer at room temperature, washed in cacodylate buffer at 4°C, and stained with 1% osmium tetroxide and 2% uranyl acetate. Samples were dehydrated in cold ethanol and then embedded in Epon. After removing the glass coverslips with liquid nitrogen, ultrathin sections of the monolayer Epon blocks (~70 nm) were cut parallel to the cover slip surface and transferred to 200-mesh copper grids. Thin plastic sections were imaged in a FEI Tecnai Spirit T-12 operated at a 120 kV. Images were recorded with a 2 k Eagle CCD camera (FEI, Eindhoven). Estimate of calcium/phosphate densities For quantitative analysis, reconstructions were performed using the simultaneous iterative reconstruction technique (SIRT) as implemented in the Tomo3D program ( Agulleiro and Fernandez, 2015 ). SIRT compares projections of the reconstructed volume with the raw data to minimize numerical differences. BF data, which showed greater signal-to-noise than DF data, were used for the analysis presented here. A band-pass filter with lower and upper cutoff of 1 and 100 pixel widths, respectively, was imposed to reduce minor shading artifacts. The known composition of ribosomes and water were used to scale the image intensities. To estimate the expected scattering away from the BF detector by ribosomes, differential scattering cross-sections were integrated from the BF outer cutoff angle (five mrad) up to π rad according to the densities of constituent elements ( Table 1 ). In addition to the scattering of whole ribosomes, scattering of ribosomal RNA was calculated separately, since the RNA component will scatter more strongly than the protein and solvent components. The integrated cross-section for TCP with chemical formula Ca 3 (PO 4 ) 2 and density 3.14 gm/cm 3 was calculated similarly. Five intensity levels were measured from a representative tomogram: two for the granules (peak and inclusive levels), two for ribosomes (peak and inclusive levels), and one for cytosolic fluid, used to approximate water ( Table 2 ). These intensities were determined by adjusting a threshold using ImageJ ( Schneider et al., 2012 ) until the objects of interest were selected. Measured intensities in the tomographic reconstruction include an additive background x from unscattered illumination, which can be estimated by imposing predicted intensity ratios between known components. For example, the ratio of ribosomal RNA (peak ribosomal intensities) ( Voss and Gerstein, 2005 ) to water would be (5.3- x )/(16- x )=2.29, yielding x = 24.3. The choice of total ribosomes (inclusive ribosome intensities) and the corresponding predicted intensity ratios, (7.5- x )/(16- x )=1.56, yields a value of x = 30.9. Using these background values and the predicted scattering for TCP, which is 6.06 times that of water, the expected intensity for TCP in tomogram images was calculated. On the scale from background to TCP thus obtained, the maximal and typical densities of the granules were found to be in the range of 34% to 48% and 31% to 42% of TCP density, respectively. The corresponding mass densities are 1.1 to 1.5 and 1.0 to 1.3 gm/cm 3 , respectively. These values can be compared with a density of 2 gm/cm 3 for amorphous calcium phosphate (ACP) prepared in vitro ( Fawcett, 1973 ). For mitochondrial volume fraction estimates, MEF mitochondria were segmented in Chimera ( Pettersen et al., 2004 ) applying conservative intensity thresholds to define granule boundaries. A rectangular prism was selected within a mitochondrion. The ratio of the sum of the volumes of the segmented granule regions within the rectangular prism to the volume of the prism was about 0.2, indicating that about 20% of the mitochondrial volume is occupied by granules in this case. Taking as a lower estimate a density 31% that of TCP ( Table 3 ), a density of 3.2 × 10 −3 mol/cm 3 is obtained for calcium phosphate within the granules. The equivalent liquid concentration based on the 20% vol estimate would be about 0.64 M, corresponding to 1.9 M calcium ions and 1.3 M phosphate ions. These concentrations are compatible with the solubility of calcium ions (e.g. from CaCl 2 ) in aqueous solution but exceed by a factor of ~10 4 the solubility of Ca 3 (PO 4 ) 2 in aqueous solution.
Additional files 10.7554/eLife.29929.027 Transparent reporting form
📊 Figures
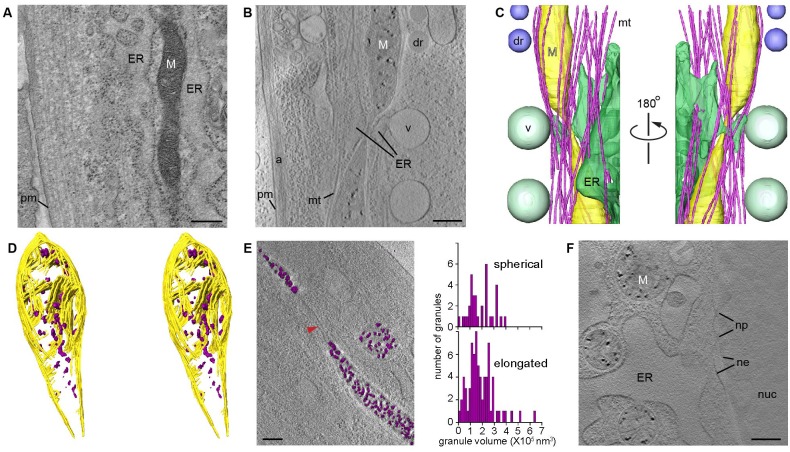
Figure 1.
CSTET imaging shows whole mitochondria in situ in mammalian cells.
White M indicates mitochondria; pm, plasma membrane; ER, endoplasmic reticulum; mt, microtubules; dr, lipid droplet; v, vesicle; a, actin; nuc, nucleus; ne, nuclear envelope; np, nuclear pore. Scale b...
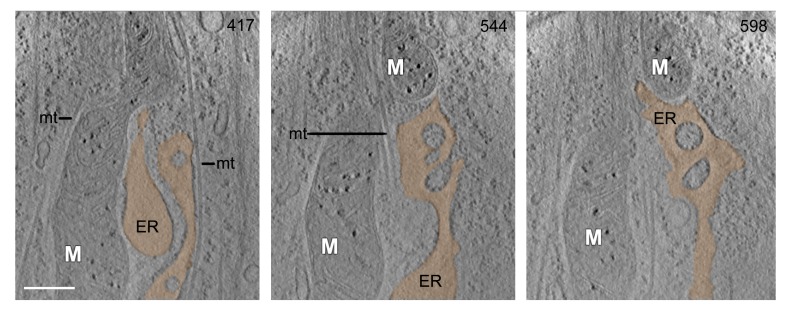
Figure 1u2014figure supplement 1.
CSTET visualization of mitochondrial interactions.
An additional instance of a mitochondrial/ER junction is displayed through a series of 30-nm thick sections from a CSTET reconstruction of a region in a WI-38 fibroblast. Height (in nm) from the botto...
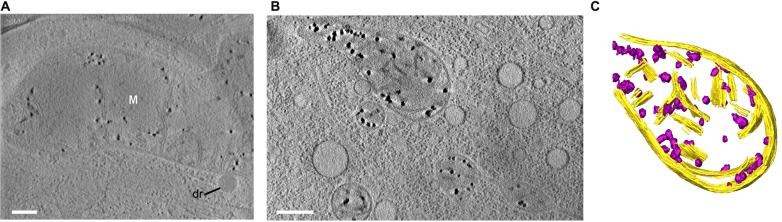
Figure 1u2014figure supplement 2.
Matrix granules are ubiquitous in mitochondria.
All panels show 30-nm thick sections from CSTET reconstructions. White M indicates mitochondria. dr, lipid droplet. Scale bars 400 nm. ( A ) U2OS osteosarcoma cell. Thickness of the cell in the region...
Video 1.
Aligned tilt series of CSTET BF images from a region 750-nm thick within a WI-38 fibroblast.
The tilt series corresponds to Figure 1B .u00a0Scale bar is 400 nm.
Video 2.
Aligned tilt series of CSTET DF images from a region 750-nm thick within a WI-38 fibroblast.
The data for this tilt series were collected simultaneously with those shown in Video 1 . Scale bar is 400 nm.
Video 3.
BF tomographic reconstruction of a region within a WI-38 fibroblast.
The reconstruction corresponds to Figure 1B and was done based on the tilt series shown in Video 1 . Scale bar is 400 nm.
Video 4.
DF tomographic reconstruction of a region within a WI-38 fibroblast.
The reconstruction was done based on the tilt series shown in Video 2 .
Video 5.
Animation of segmentation shown in Figure 1C , overlaid on the reconstruction shown in Figure 1B and Video 3 .
The reconstruction contrast has been inverted.
Video 6.
Animation of segmentation shown in Figure 1D .
Video 7.
Aligned tilt series of CSTET BF images from a region within a human dermal microvascular endothelial cell, shown in Figure 1u2014figure supplement 2B .
Scale bar is 400 nm.
Video 8.
BF tomographic reconstruction of a region within a human dermal microvascular endothelial cell, shown in Figure 1u2014figure supplement 2B .
The reconstruction was done based on the tilt series shown in Video 7 . Scale bar is 400 nm.
Video 9.
Animation of segmentation shown in Figure 1u2014figure supplement 2C , overlaid on the reconstruction shown in Figure 1u2014figure supplement 2B and Video 8 .
The BFu00a0reconstruction contrast has been inverted.
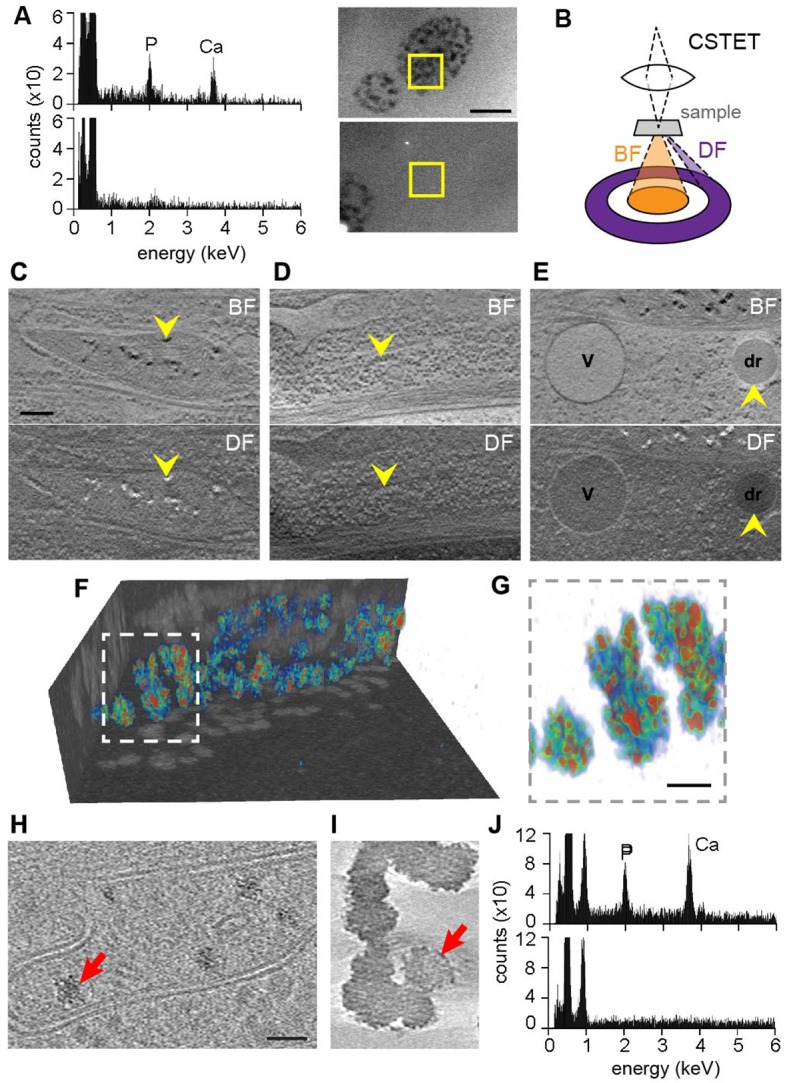
Figure 2.
Elemental characterization of mitochondrial granules.
( A ) EDX identifies calcium (Ca) and phosphorus (P) enrichment in mitochondria. Areas of a WI-38 fibroblast subjected to EDX (boxed) were imaged prior to spectroscopic analysis. Scale bar is 400 nm. ...
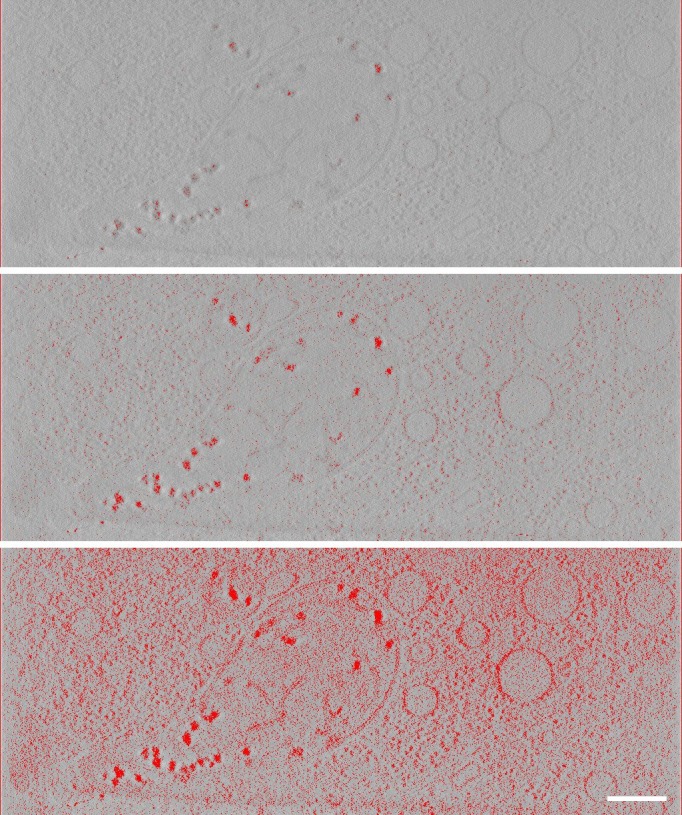
Figure 2u2014figure supplement 1.
Intensity thresholding for quantitative estimation of mitochondrial granule scattering.
The BF tomogram obtained from the HDMEC cell imaged in Figure 1u2014figure supplement 2B was used for analysis. A movie of the tilt series and reconstruction of this cell region are shown in Videos 7 ...
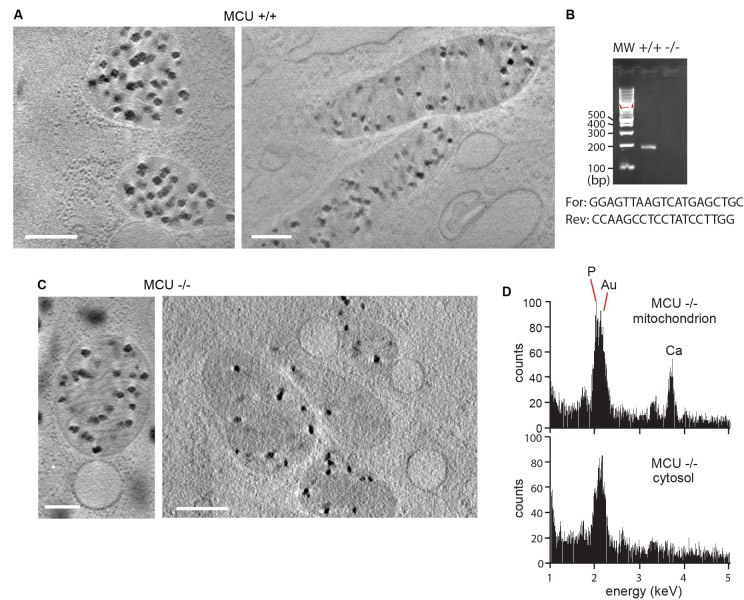
Figure 2u2014figure supplement 2.
Large granules are observed in mitochondria of murine embryonic fibroblasts (MEFs) and are independent of the presence of the mitochondrial calcium uniporter MCU.
( A ) Mitochondria in wild-type MEFs. Scale bars are 400 nm. ( B ) PCR was used to confirm the MCU -/- and +/+genotypes ( Pan et al., 2013 ). ( C ) Mitochondria from MCU -/- MEFs contain granules. Sca...
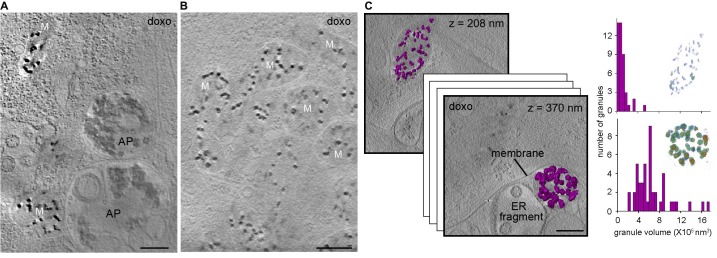
Figure 3.
Effect of cell stress on mitochondrial granules.
Sections 30-nm thick from BF CSTET reconstructions of doxorubicin-treated WI-38 cells are displayed. Scale bars are 400 nm. ( A ) Mitochondria in the vicinity of autophagosomes (AP) (cell is 890-nm th...
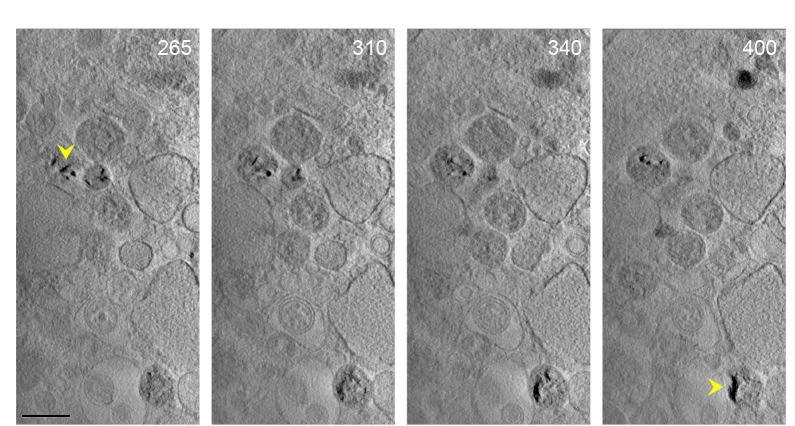
Figure 3u2014figure supplement 1.
Region of a doxorubicin-treated fibroblast cell.
A region of a WI-38 fibroblast shows multivesicular bodies and irregular membrane structures. Organelles consistent with the size of round mitochondria contain dense material with a fibrous or crystal...
Video 10.
Aligned tilt series of CSTET BF images from a region within a WI-38 fibroblast treated with doxorubicin.
Scale bar is 400 nm.
Video 11.
BF tomographic reconstruction of the tilt series in Video 10 .
Scale bar is 400 nm.
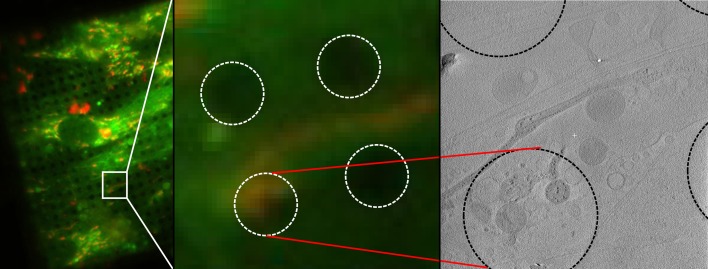
Figure 4.
Correlative imaging of mitochondria using fluorescence from a membrane-potential reporter.
Mitochondria in WI-38 fibroblasts were stained with JC-1, cryo-preserved, and imaged successively by fluorescence microscopy and CSTET. A field of JC-1 stained cells is shown on the left. The section ...
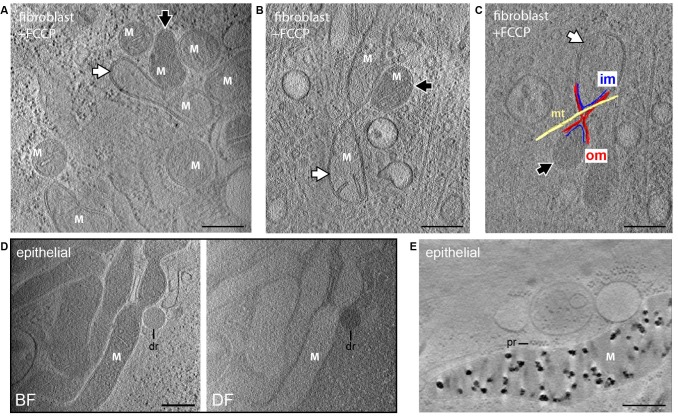
Figure 5.
Dissipation of matrix granules.
All panels show 30-nm thick sections from CSTET reconstructions. White M indicates mitochondria. Scale bars are 400 nm. ( A,B ) Fibroblasts treated with FCCP show no granules. White and black arrows i...
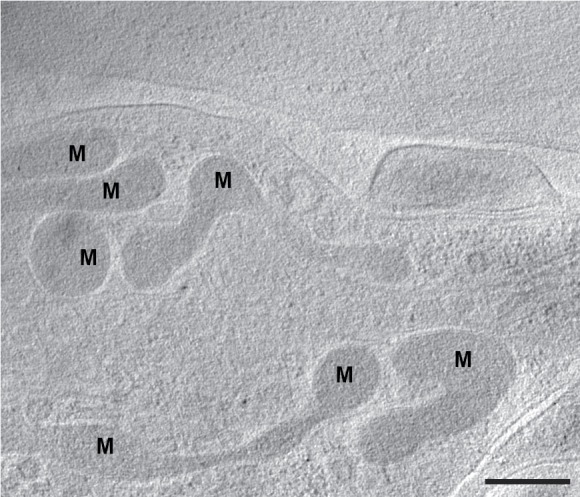
Figure 5u2014figure supplement 1.
Granule-free mitochondria in fibroblasts nearing confluence.
A section of a tomogram of WI-38 fibroblasts that had grown to near confluence on the grid shows mitochondria lacking granules. Black M indicates mitochondria. Scale bar is 400 nm.
Figure images are served from the NIH/NLM PubMed Central Open Access Subset or Europe PMC; copyright remains with the publishers and authors.
💬 Discussion
0 commentsNo comments yet. Be the first to start a discussion!
Leave a Comment