Abstract
Most pathological conditions elicit changes in the tissue optical response that may be interrogated by one or more optical imaging modalities. Any single modality typically only furnishes an incomplete picture of the tissue optical response, hence an approach that integrates complementary optical imaging modalities is needed for a more comprehensive non-destructive and minimally-invasive tissue characterization. We have developed a dual-modality system, incorporating optical coherence tomography (OCT) and fluorescence lifetime imaging microscopy (FLIM), that is capable of simultaneously characterizing the 3-D tissue morphology and its biochemical composition. The Fourier domain OCT subsystem, at an 830 nm center wavelength, provided high-resolution morphological volumetric tissue images with an axial and lateral resolution of 7.3 and 13.4 µm, respectively. The multispectral FLIM subsystem, based on a direct pulse-recording approach (upon 355 nm laser excitation), provided two-dimensional superficial maps of the tissue autofluorescence intensity and lifetime at three customizable emission bands with 100 µm lateral resolution. Both subsystems share the same excitation/illumination optical path and are simultaneously raster scanned on the sample to generate coregistered OCT volumes and FLIM images. The developed OCT/FLIM system was capable of a maximum A-line rate of 59 KHz for OCT and a pixel rate of up to 30 KHz for FLIM. The dual-modality system was validated with standard fluorophore solutions and subsequently applied to the characterization of two biological tissue types: postmortem human coronary atherosclerotic plaques, and in vivo normal and cancerous hamster cheek pouch epithelial tissue.
🔬 Techniques
💻 Software
🧪 Sample Preparation
🏭 Microscope Brands
🧪 Reagent Suppliers
📷 Detectors
🔎 Objectives
💻 Software Details
🏛️ Research Organizations (ROR)
Affiliated research institutions:
📋 Methods
OCT/FLIM dual-modality imaging system A schematic diagram of the dual-modality imaging system is shown in Fig. 1 Fig. 1 Schematic diagram of the dual-modality imaging system. La1-La5: free-space collimation and coupling lenses, Lf1-Lf7: fiber-connected collimation and coupling lenses, NDF: neutral density filter, M1-M4: mirrors, DM1-DM4: dichroic mirrors, and F1-F3: filters . The diagram can be divided into three sub-diagrams: OCT subsystem, FLIM subsystem, and Common Path. The solid black arrows indicate the optical path of the reference and sample arms of theOCT module. The dashed gray arrows show the FLIM excitation light path, and the solid gray arrows show the FLIM fluorescence emission optical path. The connection between a central computer and all electronics and interfaces is symbolized by a thin solid black line.
OCT subsystem
A fiber-based Fourier domain OCT system was implemented as the OCT module. The light source was a superluminescent light emitting diode (SLED) (EXS8410-2413, Exalos, Langhome, PA) with a center wavelength of 830 nm and spectral bandwidth of 40 nm, providing a coherence length (or axial resolution) of 7.3 µm in air. The SLED light propagated into an isolator (AC Photonics, Santa Clara, CA) designed to protect the light source from unwanted back reflections. Light exciting the isolator through single-mode optical fiber (AC Photonics, Santa Clara, CA) was divided by a 2x2 (50/50) single-mode coupler (AC Photonics, Santa Clara, CA) and directed to the reference and sample arms. The reflected beam from a reference mirror in the reference arm and the backscattered light from the sample were recombined at the coupler and generated a spectral interferogram on a custom designed high-speed spectrometer. The spectrometer was based around a transmissive grating (1200 L/mm, Wasatch Photonics, Logan, UT) and a CCD linescan camera (Aviiva, SM2CL1014, EV2 Technologies, Essex, England) capable of lines rates of up to 59 KHz with a minimum integration time of 5 µs. The detected signal was digitally converted and acquired by a high speed imaging acquisition board (PCIe-1427, National Instruments, Austin, TX). The OCT subsystem had a signal-to-noise ratio (SNR) of 98 dB and a 3 dB single sided fall-off of 900 µm. The sample arm of the interferometer is encompassed in the Common Path in the OCT/FLIM System will be described in detail below.
Show full methods section
OCT/FLIM dual-modality imaging system A schematic diagram of the dual-modality imaging system is shown in Fig. 1 Fig. 1 Schematic diagram of the dual-modality imaging system. La1-La5: free-space collimation and coupling lenses, Lf1-Lf7: fiber-connected collimation and coupling lenses, NDF: neutral density filter, M1-M4: mirrors, DM1-DM4: dichroic mirrors, and F1-F3: filters . The diagram can be divided into three sub-diagrams: OCT subsystem, FLIM subsystem, and Common Path. The solid black arrows indicate the optical path of the reference and sample arms of theOCT module. The dashed gray arrows show the FLIM excitation light path, and the solid gray arrows show the FLIM fluorescence emission optical path. The connection between a central computer and all electronics and interfaces is symbolized by a thin solid black line.
OCT subsystem
A fiber-based Fourier domain OCT system was implemented as the OCT module. The light source was a superluminescent light emitting diode (SLED) (EXS8410-2413, Exalos, Langhome, PA) with a center wavelength of 830 nm and spectral bandwidth of 40 nm, providing a coherence length (or axial resolution) of 7.3 µm in air. The SLED light propagated into an isolator (AC Photonics, Santa Clara, CA) designed to protect the light source from unwanted back reflections. Light exciting the isolator through single-mode optical fiber (AC Photonics, Santa Clara, CA) was divided by a 2x2 (50/50) single-mode coupler (AC Photonics, Santa Clara, CA) and directed to the reference and sample arms. The reflected beam from a reference mirror in the reference arm and the backscattered light from the sample were recombined at the coupler and generated a spectral interferogram on a custom designed high-speed spectrometer. The spectrometer was based around a transmissive grating (1200 L/mm, Wasatch Photonics, Logan, UT) and a CCD linescan camera (Aviiva, SM2CL1014, EV2 Technologies, Essex, England) capable of lines rates of up to 59 KHz with a minimum integration time of 5 µs. The detected signal was digitally converted and acquired by a high speed imaging acquisition board (PCIe-1427, National Instruments, Austin, TX). The OCT subsystem had a signal-to-noise ratio (SNR) of 98 dB and a 3 dB single sided fall-off of 900 µm. The sample arm of the interferometer is encompassed in the Common Path in the OCT/FLIM System will be described in detail below.
FLIM subsystem
A scanning direct pulse-recording FLIM implementation was adopted for the FLIM module. A frequency tripled (355 nm) Q-switched Nd:YAG laser (SPOT-10-50-355, Elforlight Ltd., England) with a pulse width of 1 ns, maximum pulse energy of 5µJ and maximum repetition rate of 50 KHz was used as an excitation light source. A 50 µm multi-mode fiber delivered the excitation light to the OCT-FLIM Common Path. The emission light exiting the OCT-FLIM Common Path was directed through a 200 µm multi-mode fiber into a multi-spectral detection module. The multi-spectral detection module was introduced for real-time time-resolved fluorescence spectroscopy [ 11 ]. We have recently adapted this multispectral detection module design for in vivo FLIM imaging [ 12 ]. We have taken the same approach for the FLIM module of the dual-modality imaging system. Three fluorescence decays at three different emission bands (390 +/− 20, 452 +/− 22.5 and 600 +/−125 nm) in the multispectral detection module was produced by using a set of dichroic mirrors and filters (Chroma Technology, Bellows Falls, VT). These bands were temporally separated by propagating each band through a different length (1, 10, or 19 m) of multimode fiber which imparted a 45 ns time delay between each band. The emission bands and fiber lengths were selected to detect tissue endogenous fluorophores, such as flavin adenine dinucleotide (FAD), nicotinamide adenine dinucleotide (NADH), collagen, elastin and lipids. Upon a single pulse excitation, the three fluorescence decays were simultaneously detected by a MCP-PMT with 150 ps rise time (R3809U-50, Hamamatsu, Japan) and amplified using a high-bandwidth pre-amplifier (1.5 GHz bandwidth, C5594, Hamamatsu, Japan). Finally, the sequence composed of the three consecutive decays was digitized at 4 GS/s using a PCI-ADC card (1.5 GHz analog bandwidth, CS14G8 CobraMax, GaGe, Lockport, IL). A spectral intensity calibration was performed on the three spectral bands in order to compensate for wavelength dependent losses in the detection system and the PMT sensitivity. Images of capillary tubes containing POPOP and NADH were recorded. Both have appreciable intensity in the three bands. The spectra of POPOP and NADH were also recorded with a spectrometer recently calibrated with a NIST traceable quartz-tungsten-halogen calibration lamp. The average intensity over the bands noted above was calculated from the high resolution spectra. A normalized calibration coefficient (0.795@390 nm, 1@452 nm, 0.779@600 nm) was then determined for each band which brought the intensities measured with the FLIM subsystem into agreement with the average intensities from the spectrometer. For a more detailed description and discussion of the FLIM subsystem see [ 11 , 12 ]. Common path in OCT/FLIM system The true integration of the OCT and FLIM subsystems takes place in the common optical path that is used to illuminate and scan the sample. The OCT sample beam and FLIM excitation were combined via a dichroic mirror (DM1) which was highly reflective in the UV and passed vis-nearIR light. The copropogating beams passed through a set of galvo mirrors (6230H, Cambridge Technology, Lexington, MA) used to raster scan the sample. A broadly achromatic (UV-nearIR) objective lens (5X/0.16 NA, EC plan-Neufluar, Zeiss, Germany) was used to simultaneously focus the OCT sample beam and FLIM excitation resulting in lateral resolutions of 13.4 µm for OCT and 100 µm for FLIM. The powers of the OCT beam and FLIM excitation light on the sample were 0.6 and 3.3 mW, respectively. The fluorescence emission was directed into the detection module by a second dichroic mirror (DM2) placed between the fiber collimating optics of the OCT sample beam and DM1. The mirror was highly reflective in the UV-vis range and passed nearIR. System control and data processing An OCT/FLIM data acquisition program written in Labview (Labview8.6, National Instruments, Austin, TX) was developed to control the electronics, data acquisition boards and imaging parameters. The program sent synchronized trigger signals to both the FLIM laser and the OCT camera, so that a pixel fluorescence decay acquisition coincides with the corresponding OCT A-line collection. 2-D FLIM decay data and co-registered 3-D OCT volume data were acquired after a controlled raster scan with two galvanometers, and saved into the central main computer. Due to the low pulse energy of the current FLIM laser (maximum of 240 nJ at 10 KHz), tissue autofluorescence decays resulting from a single laser pulse excitation had an inadequate signal-to-noise-ratio (SNR). To improve the SNR of the FLIM signal, multiple fluorescence decays at a given pixel were acquired with multiple excitation laser pulses, and the decays were averaged. The FLIM maps of the ex vivo artery and in vivo hamster pouch used 20 fluorescence decays to represent one pixel. Each Fourier domain OCT A-line was processed in the standard way using Matlab (Matlab R2007a, The Mathworks, Inc., Natick, MA); convert from λ to k-space, resample, and fast Fourier transform to get the depth resolved tissue reflectivity. In the context of time-domain FLIM data analysis, the measured fluorescence decay at each pixel of the image corresponds to the time convolution of the instrument response with the intrinsic fluorescence decay at that pixel. Therefore, to estimate the intrinsic fluorescence decay at each pixel of the image, the instrument response needs to be deconvolved from the measured pixel fluorescence decay. A recently proposed and validated deconvolution method based on the orthogonal expansion of the intrinsic fluorescence decays on a set of Laguerre functions was applied [ 17 ]. The Laguerre deconvolution method allowed for almost real-time estimation of the intrinsic fluorescence decays at each pixel of the FLIM images. After deconvolution, intensity maps for each band were computed by integrating over time the intrinsic fluorescence decay at each pixel. Then, the normalized fluorescence intensity maps were calculated by dividing (pixel-by-pixel) the intensity of each emission band by the sum of the intensity of all three bands. Thus, the 2-D normalized fluorescence intensity maps indicate the relative fluorescence intensity emitted at each band. To estimate the 2-D lifetime maps, the average lifetime was computed from the estimated pixel intrinsic fluorescence decay. The OCT volume and FLIM maps were fused by overlaying the 3-D OCT volume with 2-D FLIM maps. The fused OCT/FLIM data were rendered using ImageJ (1.42q, NIH, Bethesda, MA).
Sample preparation and imaging 2.6.1
Capillary tubes filled with fluorophores in Intralipid Three standard fluorophores with known emission spectra and lifetimes were selected to evaluate the OCT/FLIM dual-modality system: POPOP in ethanol (Emission peak = 390 nm, lifetime = 1.2 - 1.5 ns), NADH in PBS (Emission peak = 450 nm, lifetime = 0.3 - 0.4 ns), and FAD in PBS (Emission peak = 540 nm, lifetime = 2.3 - 2.85 ns) [ 18 ]. The fluorophore concentrations (0.015 mM in POPOP, 0.5 mM in NADH, and 1 mM in FAD) were chosen such that the peak emission intensity from each fluorophore was comparable. The dye samples were loaded into three quartz capillary tubes (ID = 300 µm, OD = 400 µm, and Length = 2500 µm). The capillary tubes were sealed to prevent leakage of dyes and were collaterally placed in 2% intralipid which is commonly used to mimic tissue light scattering [ 19 ]. The capillary tubes were placed ~100 µm below the surface of the intralipid and imaged. No averaging was performed, since the fluorescence efficiencies of the dyes were high enough even with a single excitation laser pulse at a pulse repetition rate of 30 kHz.
Ex vivo human coronary artery
Postmortem human coronary artery specimens were obtained within 40 hours from the time of the autopsy, according to a protocol approved by the Texas A&M University Institutional Review Board. The artery specimens were longitudinally opened to acquire OCT/FLIM images from the internal lumen side. For imaging, the specimens were placed on a quartz slide to minimize background fluorescence signal, and moistened to prevent it from drying during the experiment. The imaged artery samples were processed following standard procedures for histopathology analysis. In vivo hamster cheek pouch The OCT/FLIM dual-modality system was also being evaluated for the early detection of oral cancer lesions using a Syrian (Golden) hamster cheek pouch model of epithelial cancer. Following a previously reported protocol [ 20 ], epithelial cancer was induced by treating one cheek pouch of each hamster with a suspension of 2.0% Benzo[a]pyrene (Sigma Aldrich Corporation, St. Louis MO) in mineral oil three times per week for up to 32 weeks. Control hamsters were similarly treated with mineral oil only. The treatment and imaging protocol was approved by the Institutional Animal Care and Use Committee at Texas A&M University. For imaging, the hamster was anesthetized with a cocktail of ketamine (Bioniche pharma USA, Lake Forest, IL) and xylazine (Akorn. Inc., Decatur, IL). After placing the hamster on a small lab jack-typed table, the cheek pouch was exposed to the air and positioned under the objective lens of the OCT/FLIM system. Co-registered OCT images and FLIM maps of 2x2 mm 2 tissue sections were simultaneously acquired at cancer-suspicious locations, which were thereafter marked with ink for identification with the tissue histopathology. The heart rate and oxygen saturation of the hamster were continuously monitored during the imaging procedure using a compact veterinary monitor (PC-VetGrad +TM , Vmed Technology, Mill Creek, WA). After imaging, the hamster was euthanized using nembutal (Hospira, Inc., Lake Forest, IL), and biopsy samples from the imaged locations were taken for H&E histopathology analysis.
📊 Figures
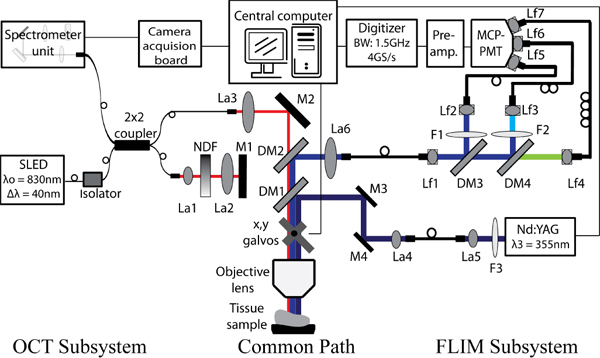
Fig. 1
Schematic diagram of the dual-modality imaging system. La1-La5: free-space collimation and coupling lenses, Lf1-Lf7: fiber-connected collimation and coupling lenses, NDF: neutral density filter, M1-M4...
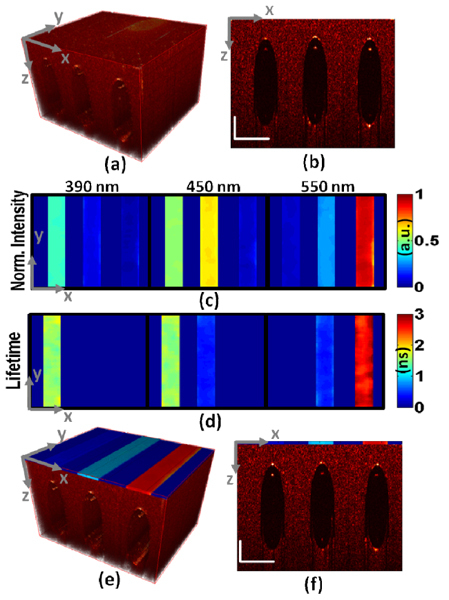
Fig. 2
Dual-modal OCT and FLIM images of three capillary tubes loaded with POPOP (left tube), NADH (center tube) and FAD (right tube) within the 2% intralipid (2500 (x) x 2500 (y) x 600 (z) u00b5m). (a) 3-D ...
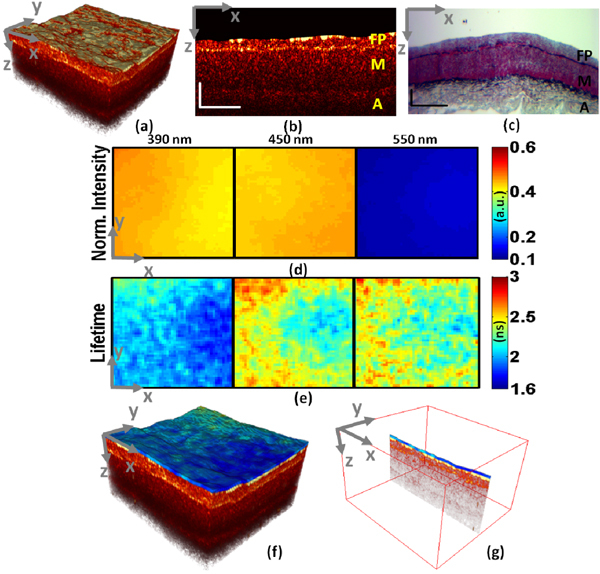
Fig. 3
Dual-modal OCT and FLIM images of an ex vivo human atherosclerotic artery tissue with thin fibrotic plaque (2000 (x) x 2000 (y) x 350 (z) u00b5m). (a) 3-D OCT volume, (b) 2-D OCT B-scan (FB: Fibrotic ...
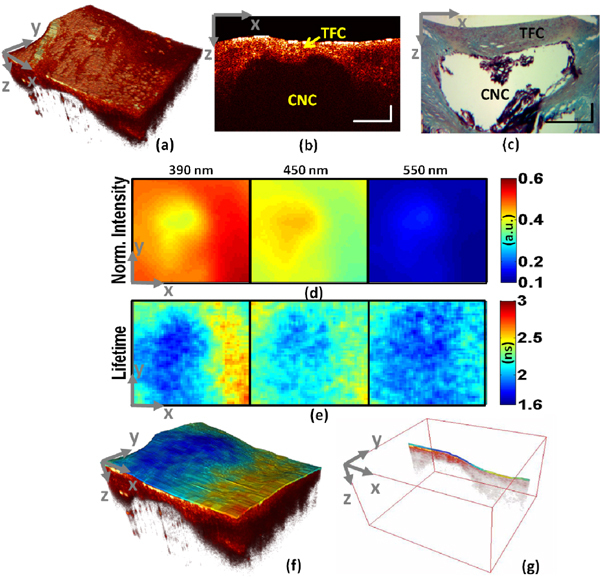
Fig. 4
Dual-modal OCT and FLIM maps of an ex vivo calcified human atherosclerotic artery tissue (2000 (x) x 2000 (y) x 650 (z) u00b5m). (a) 3-D OCT volume, (b) 2-D OCT B-scan (TFC: thick fibrotic cap, CNC: c...
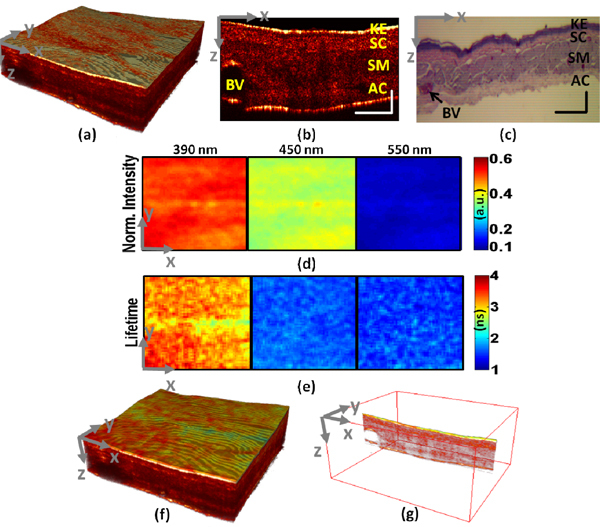
Fig. 5
Dual-modal OCT images and FLIM maps of in vivo normal hamster cheek pouch (2000 (x) x 2000 (y) x 450 (z) u00b5m). (a) 3-D OCT volume, (b) 2-D OCT B-scan (KE: Keratinized stratified squamous epithelium...
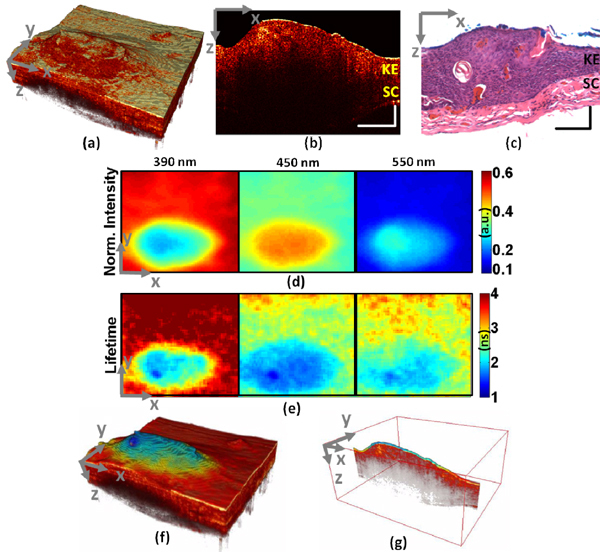
Fig. 6
Dual-modal OCT images and FLIM maps of in vivo cancerous hamster cheek pouch (2000 (x) x 2000 (y) x 650 (z) u00b5m). (a) 3-D OCT volume, (b) 2-D OCT B-scan (KE: Keratinized stratified squamous epithel...
Figure images are served from the NIH/NLM PubMed Central Open Access Subset or Europe PMC; copyright remains with the publishers and authors.
💬 Discussion
0 commentsNo comments yet. Be the first to start a discussion!
Leave a Comment