Abstract
Transcription factor (TF)-directed enhanceosome assembly constitutes a fundamental regulatory mechanism driving spatiotemporal gene expression programs during animal development. Despite decades of study, we know little about the dynamics or order of events animating TF assembly at cis-regulatory elements in living cells and the long-range molecular "dialog" between enhancers and promoters. Here, combining genetic, genomic, and imaging approaches, we characterize a complex long-range enhancer cluster governing Krüppel-like factor 4 (Klf4) expression in naïve pluripotency. Genome editing by CRISPR/Cas9 revealed that OCT4 and SOX2 safeguard an accessible chromatin neighborhood to assist the binding of other TFs/cofactors to the enhancer. Single-molecule live-cell imaging uncovered that two naïve pluripotency TFs, STAT3 and ESRRB, interrogate chromatin in a highly dynamic manner, in which SOX2 promotes ESRRB target search and chromatin-binding dynamics through a direct protein-tethering mechanism. Together, our results support a highly dynamic yet intrinsically ordered enhanceosome assembly to maintain the finely balanced transcription program underlying naïve pluripotency.
🔬 Techniques
🧬 Organisms
💻 Software
✨ Fluorophores
🧪 Sample Preparation
🔬 Cell Lines
🏭 Microscope Brands
🧪 Reagent Suppliers
📷 Detectors
💻 Software Details
💾 Data Repositories
🏛️ Research Organizations (ROR)
Affiliated research institutions:
📋 Methods
Cell culture Mouse JM8.N4
ESCs were cultured on 0.1% gelatin-coated plates without feeders. The ESC medium was prepared by supplementing knockout DMEM with 15% FBS (HyClone), 1 mM GlutaMAX, 0.1 mM nonessential amino acids, 0.1 mM 2-mercaptoethanol, and 1000 U of LIF (Millipore).
STAT3 or ESRRB knockout
ESCs were maintained in ESC medium supplemented with 2i (1 µM MEKi PD0325901, 3 µM GSK3i CHIR99021). Mouse EpiSCs (OEC2 cell line; a kind gift from Dr. Austin Smith) were cultured in N2B27 medium supplemented with 20 ng/mL Activin A and 12 ng/mL Fgf2 as described in Guo et al. (2009) . 293T or NIH/3T3 cells were grown in DMEM high glucose with GlutaMAX supplemented with 10% FBS. Small molecule inhibitors are used as follows: 20 µM TGFβRI inhibitor SB 431542 (Sigma) and 10 µM JAK inhibitor InSolution JAK inhibitor I (EMD). ChIP-qPCR ChIP experiments were performed as described previously ( Li et al. 2016 ) with minor modifications. Briefly, cells were cross-linked for 10 min at room temperature with 1% paraformaldehyde (methanol-free) in PBS and quenched with 0.125 M glycine. Cells were scraped and resuspended in cold cell lysis buffer (5 mM PIPES at pH 8.0, 85 mM KCl, 0.5% NP-40) and incubated for 10 min on ice. After centrifuging, nuclear pellets were resuspended in at least 6 vol of sonication buffer (50 mM Tris-HCl at pH 8.1, 10 mM EDTA, 0.1% SDS), incubated for 10 min on ice, and sonicated using the Covaris S220 sonicator to obtain an average fragment length of ∼500 bp examined by electrophoresis. Sonicated chromatin was diluted in RIPA buffer, aliquoted, and incubated with Protein G Dynabeads that were prebound with individual antibodies for at least 1 h at room temperature. Immunoprecipitation was performed overnight at 4°C with 2–4 µg of antibodies. Ten percent of the chromatin was saved as input. Immunoprecipitated DNA was washed extensively with RIPA buffer, reverse-cross-linked, and digested with proteinase K and RNase A followed by purification with the Qiagen QIAquick PCR purification kit. Eluted ChIP product was analyzed by qPCR using the SYBR Select master mix for CFX. The antibodies and primers used for ChIP assay are listed in Supplemental Tables S1 and S2 .
Show full methods section
Cell culture Mouse JM8.N4
ESCs were cultured on 0.1% gelatin-coated plates without feeders. The ESC medium was prepared by supplementing knockout DMEM with 15% FBS (HyClone), 1 mM GlutaMAX, 0.1 mM nonessential amino acids, 0.1 mM 2-mercaptoethanol, and 1000 U of LIF (Millipore).
STAT3 or ESRRB knockout
ESCs were maintained in ESC medium supplemented with 2i (1 µM MEKi PD0325901, 3 µM GSK3i CHIR99021). Mouse EpiSCs (OEC2 cell line; a kind gift from Dr. Austin Smith) were cultured in N2B27 medium supplemented with 20 ng/mL Activin A and 12 ng/mL Fgf2 as described in Guo et al. (2009) . 293T or NIH/3T3 cells were grown in DMEM high glucose with GlutaMAX supplemented with 10% FBS. Small molecule inhibitors are used as follows: 20 µM TGFβRI inhibitor SB 431542 (Sigma) and 10 µM JAK inhibitor InSolution JAK inhibitor I (EMD). ChIP-qPCR ChIP experiments were performed as described previously ( Li et al. 2016 ) with minor modifications. Briefly, cells were cross-linked for 10 min at room temperature with 1% paraformaldehyde (methanol-free) in PBS and quenched with 0.125 M glycine. Cells were scraped and resuspended in cold cell lysis buffer (5 mM PIPES at pH 8.0, 85 mM KCl, 0.5% NP-40) and incubated for 10 min on ice. After centrifuging, nuclear pellets were resuspended in at least 6 vol of sonication buffer (50 mM Tris-HCl at pH 8.1, 10 mM EDTA, 0.1% SDS), incubated for 10 min on ice, and sonicated using the Covaris S220 sonicator to obtain an average fragment length of ∼500 bp examined by electrophoresis. Sonicated chromatin was diluted in RIPA buffer, aliquoted, and incubated with Protein G Dynabeads that were prebound with individual antibodies for at least 1 h at room temperature. Immunoprecipitation was performed overnight at 4°C with 2–4 µg of antibodies. Ten percent of the chromatin was saved as input. Immunoprecipitated DNA was washed extensively with RIPA buffer, reverse-cross-linked, and digested with proteinase K and RNase A followed by purification with the Qiagen QIAquick PCR purification kit. Eluted ChIP product was analyzed by qPCR using the SYBR Select master mix for CFX. The antibodies and primers used for ChIP assay are listed in Supplemental Tables S1 and S2 .
ChIP-exo library preparation and sequencing analysis
ChIP-exo libraries for ESRRB and STAT3 were prepared as described previously ( Rhee and Pugh 2011 ; Li et al. 2016 ) by adapting the SoLid sequencer adaptors/primers compatible with the Illumina sequencing on a HiSeq 2500 in 50-bp single-end format. After trimming the 3′-most 14-bp error-prone regions, we aligned ChIP-exo reads to the mouse genome (University of California at Santa Cruz build mm10) using Bowtie (version 0.12.7; options -S-t -m 1), accepting only uniquely aligning reads. The resulting SAM files were converted to BAM format, sorted (SAMtools version 0.1.19), and converted to bigWig files scaled to 10 million total mapped reads. We called peaks in all samples using several methods: MACS version 2 (options call peak -t $BAM_FN –f BAM -g mm -n $NAME -B -q 0.01 --outdir $MACS2_OUTDIR) or GEM (options –t $NUMCPU –g $GENOMESIZE_FN –out $GEM_ OUTBASEDIR/$GEM_OUTDIR --f SAM --genome $GENOME FASTA_DIR --k_min 6 --k_max 15 --expt $BAM_FN). We used 1% false discovery rate cutoffs for peak calling. We converted the GEM output to 50-nt peaks centered around the GEM peak summit (custom Perl script). For GEM analysis of the STAT3 ChIP-exo data, we “seeded” the joint peak/motif calling by specifying seed motifs of TTCCTGGAA. Raw sequencing data were deposited to NCBI Gene Expression Omnibus (GEO) with accession number GSE97304 . To enable side-by-side comparison, STAT3 and ESRRB ChIP-exo were compared with STAT3 ( GSM288353 ) and ESRRB ( GSM288355 ) ChIP-seq data sets. SOX2 and SP1 ChIP-exo libraries were reported previously ( Chen et al. 2014 ; Li et al. 2016 ). Co-IP Full-length Esrrb/Sox2 were PCR-amplified from the mESC cDNA and cloned into a PiggyBac construct backbone with the N-terminal HA or 3XFlag tag. The domain deletions for Esrrb or Sox2 were further generated by PCR or site-directed mutagenesis and verified by Sanger sequencing. HEK293T cells grown on 10-cm tissue culture plates were transfected with 5 µg of each construct by Lipofectamine 2000 following the manufacturer's instructions. Forty-eight hours after transfection, cells were scraped off the plate with ice-cold PBS and centrifuged, and the cell pellet was resuspended in ice-cold cell lysis buffer (5 mM PIPES at pH 8.0, 85 mM KCl, 0.5% NP-40, protease inhibitors) and incubated for 10 min on ice. Nuclei were pelleted by centrifuge at 4°C and resuspended in 500 µL of low-salt cell lysis buffer. After preclearing with protein G sepharose beads for 1 h at 4°C, ∼1 mg of proteins was diluted in 1 mL of co-IP buffer (0.2 M NaCl, 25 mM HEPES, 1 mM MgCl 2 , 0.2 mM EDTA, 0.5% NP-40, protease inhibitors) and incubated with 4 µg of IgGs or specific antibodies overnight in a cold room. Fifty microliters of precleared lysate was kept overnight at 4°C as input. Fifty microliters of Protein G sepharose beads in co-IP buffer supplemented with 0.5% BSA was added to the samples and incubated for 2 h in a cold room. After extensive washes in co-IP buffer, proteins were eluted from the beads by boiling for 5 min in 1× SDS loading buffer and analyzed by SDS-PAGE and Western blot with the indicated antibodies ( Supplemental Table S1 ). Western blot was exposed to Western Lightning Plus-ECL (PerkinElmer) and imaged in a ChemiDoc MP (Bio-Rad) detection system. 3C 3C experiments were performed as described previously ( Hagège et al. 2007 ). ESCs or EpiSCs in single-cell suspension were cross-linked with 1% paraformaldehyde for 10 min at room temperature. Reactions were quenched by 250 mM glycine. Chromatin from 10 7 cells was digested with Nla III twice in CutSmart buffer overnight at 37°C. Samples with digestion efficiency >90% as assessed by qPCR were used for the following treatments. After inactivation of the Nla III for 30min at 65°C, chromatin fragments were ligated with T4 DNA ligase (New England Biolabs) overnight at 16°C followed by reverse-cross-linking overnight at 65°C in the presence of 300 µg/mL Proteinase K and 0.5 M NaCl. After RNase A treatment, samples were purified with UltraPure phenol:chloroform:isoamyl alcohol three times, and DNA was harvested by ethanol precipitation. One-hundred nanograms of DNA was used for each qPCR reaction in the triplicate. BAC control DNA template (RP23 111D23) was prepared similarly, and 100 ng of ligated BAC DNA was used for each qPCR reaction as the BAC control. 3C data were first corrected for bias of PCR amplification by using the BAC control template. To compare between samples, data from ESCs and EpiSCs were normalized to each other using the interaction frequencies between fragments in control regions (XRCC RP23-148C24 or Pdhb RP23-366F9). 3C primer information is listed in Supplemental Table S2 .
ATAC-seq and analysis
ATAC-seq was performed according to Buenrostro et al. (2013) using the Nextera DNA library preparation kit (Illumina). Briefly, we performed ATAC-seq on 50,000 cells from wild-type and Klf4_E2_OCT4/SOX2 site deletion ESCs (delOS), which were trypsinized, washed with PBS on ice, and resuspended in the reaction mix (25 μL of 2× TD buffer, 2.5 μL of transposase, 22.5 μL of nuclease-free H 2 O) for 30 min at 37°C. Following transposition, genomic DNA was purified and amplified by 14 cycles of PCR. Both ATAC-seq samples were sequenced in one lane of an Illumina HiSeq 2500 (Janelia Functional Genomics Core) with 50-bp paired-end sequencing. To analyze ATAC-seq libraries, paired-end reads were first adapter-removed by Cutadapt and mapped to the mm9 genome build using Bowtie2 with the following parameters: --no-discordant --no-mixed --phred33 -X2000. Reads mapped to mitochondria and PCR duplicates were removed by SAMtools. We obtained 159,467,372 and 191,574,252 QC-passed reads for wild-type and delOS ESCs, of which 77.31% and 79.63%, respectively, corresponded to paired-end mapped reads. To compare the two ATAC-seq libraries, sequencing reads were normalized to 1× sequence depth, defined by total number of mapped reads × fragment length/effective genome size (2,150,570,000). Raw sequencing data were deposited to NCBI GEO with accession number GSE97304 .
Single-molecule imaging
Single-molecule imaging experiments were carried out primarily as described in Chen et al. (2014) . Cells were seeded on a 25-mm #1.5 coverglass precleaned with KOH and ethanol and coated with Matrigel according to the manufacturer's instructions. All live-cell imaging experiments were conducted using respective culture medium without Pheno-red (FluoroBrite DMEM, ThermoFisher). After testing multiple concentrations, 1 nM JF549 HaloTag ligand was added to cells for 10 min, and then cells were washed three times with imaging medium. The coverglasses were then transferred to a metal holder and mounted onto a custom-built Nikon Eclipse Ti microscope with a 100× oil objective lens with NA 1.49, perfect focusing system, EMCCD camera (iXon3, Andor), and a humidified incubation chamber maintained at 37°C with 5% CO 2 . To excite the JF549 HaloTag ligand, we used a 561-nm laser (MPB Lasertech) adjusted to the illumination intensity of ∼50 W cm −2 and a 500-msec acquisition time to track stable binding molecules and ∼ 0.5 kW cm −2 and 10 msec for fast tracking. The excitation laser was controlled by an AOTF (acousto-optic tunable filter) and reflected into the objective by a multiband dichroic (405/488/561/633 BrightLine quad-band bandpass filter, Semrock). The emission light was filtered by a single-band filter centered at 593 nm (FF01 593/40, Semrock) placed in front of the camera. Nikon NIS-Elements software was used to control the microscope, laser, and camera. Imaging was performed after a minimum of 2–10 sec of prebleaching. We tracked at least 5000 frames for 10-msec acquisition and 500 frames for 500-msec acquisition for eight to 10 cells per condition for at least three independent biological replicates.
📊 Figures
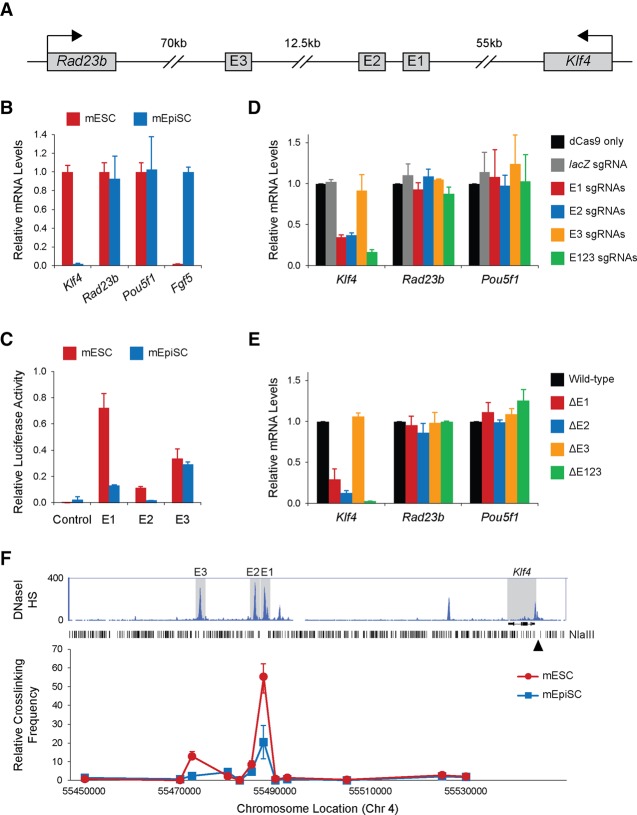
Figure 1.
A long-range enhancer cluster controls Klf4 gene expression in mESCs. ( A ) A schematic diagram of the putative regulatory elements E1, E2, and E3 relative to the Klf4 gene and its neighbor gene, Rad2...
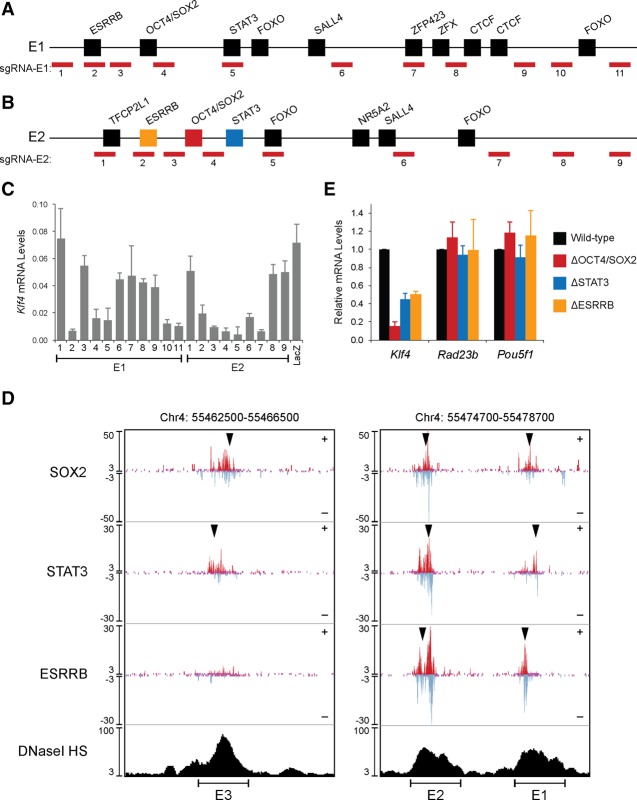
Figure 2.
Fine-mapping of TFs functioning at Klf4 active enhancers E1 and E2. ( A , B ) Schematic diagram of sgRNAs targeting to E1 ( A ) and E2 ( B ), with putative TF motifs shown. ( C ) mESC lines stably exp...
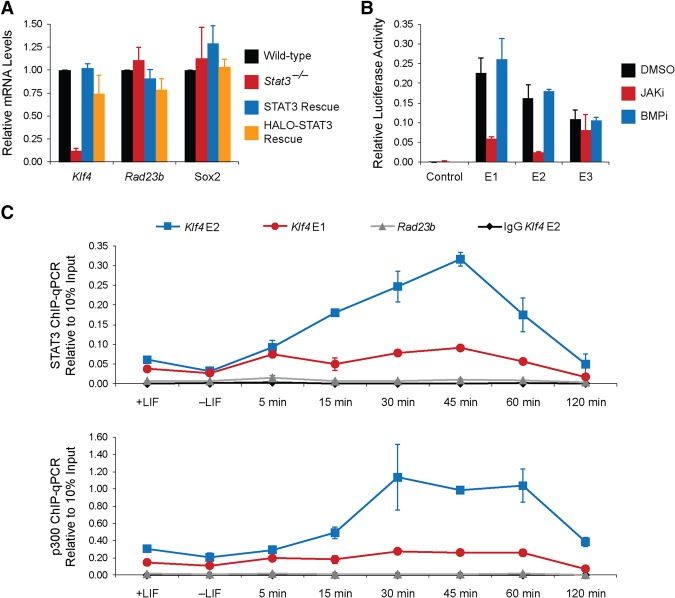
Figure 3.
The Klf4 enhancer cluster integrates nau00efve pluripotency signaling pathways. ( A ) Loss of Stat3 ( Stat3 u2212/u2212 ) reduces expression of Klf4 , which can be rescued upon exogenous expression of...
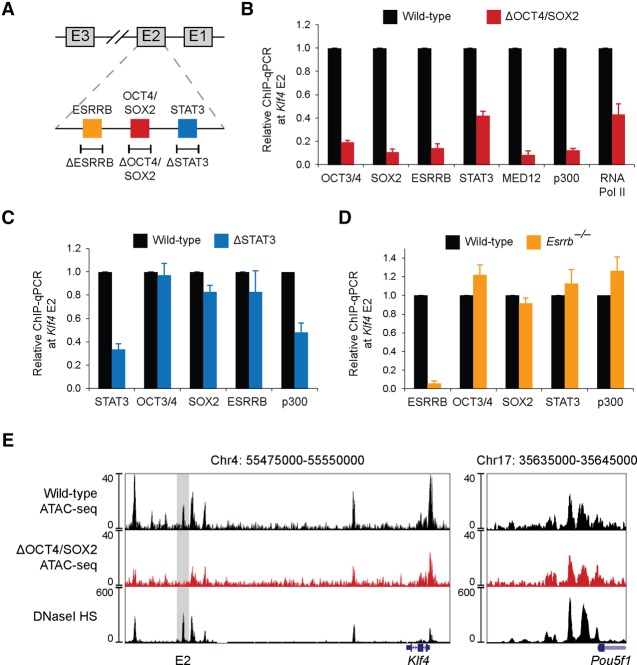
Figure 4.
Lead factors SOX2 and OCT4 hierarchically regulate a higher-order protein ensemble at the Klf4 enhancer. ( A ) Schematic illustration of binding sites for OCT4/SOX2, ESRRB, and STAT3 in the Klf4 enhan...
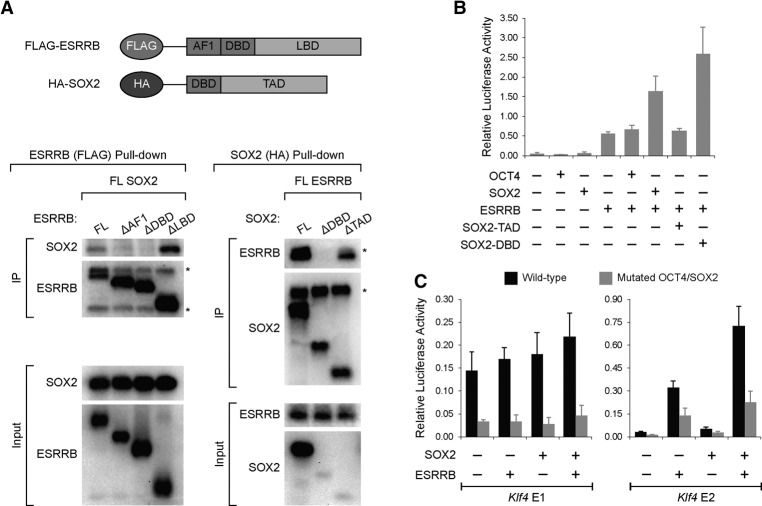
Figure 5.
ESRRB and SOX2 synergistically activate the Klf4 enhancer. ( A ) Co-IP was performed on nuclear lysates from HEK293T cells transfected with plasmids to express Flag-tagged ESRRB and HA-tagged SOX2. (A...
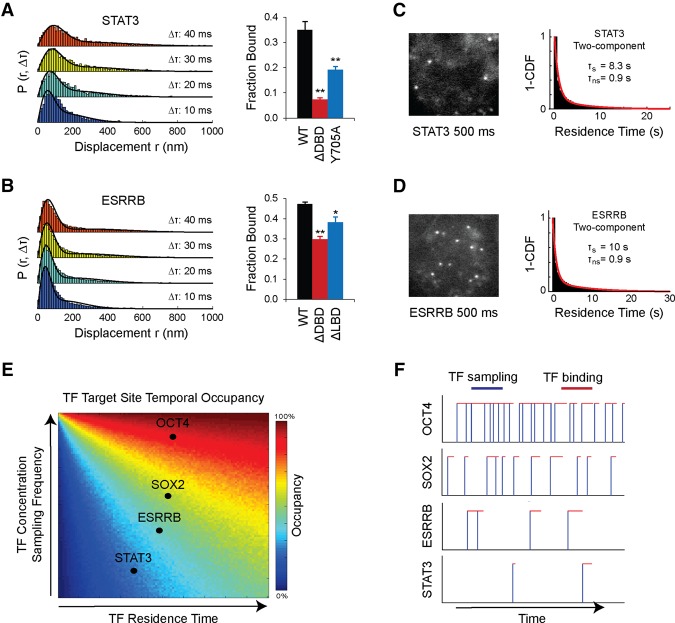
Figure 6.
Single-molecule dynamics analysis of key nau00efve pluripotency TFs in live ESCs. ( A , B ) Analysis of trajectories of single molecules of STAT3 ( A ) and ESRRB ( B ). Single-molecule displacement wa...
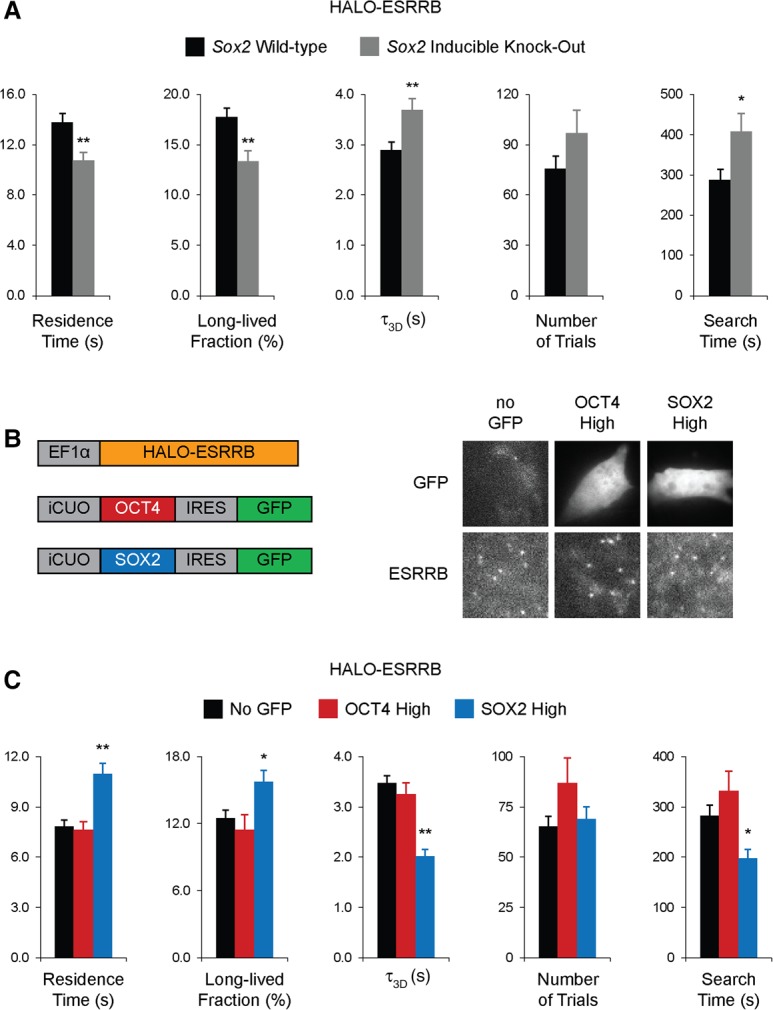
Figure 7.
Dynamics of the hierarchical assembly of the enhanceosome in live cells. ( A ) Analysis of residence time, long-lived fraction, u03c4 3D , number of trials ( N trials ), and search time for ESRRB afte...
Figure images are served from the NIH/NLM PubMed Central Open Access Subset or Europe PMC; copyright remains with the publishers and authors.
💬 Discussion
0 commentsNo comments yet. Be the first to start a discussion!
Leave a Comment