Abstract
The introduction of calcium ion (Ca(2+)) indicators based on red fluorescent proteins (RFPs) has created new opportunities for multicolour visualization of intracellular Ca(2+) dynamics. However, one drawback of these indicators is that they have optimal two-photon excitation outside the near-infrared window (650-1,000 nm) where tissue is most transparent to light. To address this shortcoming, we developed a long Stokes shift RFP-based Ca(2+) indicator, REX-GECO1, with optimal two-photon excitation at <1,000 nm. REX-GECO1 fluoresces at 585 nm when excited at 480 nm or 910 nm by a one- or two-photon process, respectively. We demonstrate that REX-GECO1 can be used as either a ratiometric or intensiometric Ca(2+) indicator in organotypic hippocampal slice cultures (one- and two-photon) and the visual system of albino tadpoles (two-photon). Furthermore, we demonstrate single excitation wavelength two-colour Ca(2+) and glutamate imaging in organotypic cultures.
🔬 Techniques
🔭 Microscopes
🧬 Organisms
✨ Fluorophores
🧪 Sample Preparation
🔬 Cell Lines
🏭 Microscope Brands
🧪 Reagent Suppliers
🔴 Lasers
📷 Detectors
🎨 Filters
💻 Software Details
💾 Data Repositories
🏛️ Research Organizations (ROR)
Affiliated research institutions:
📋 Methods
Engineering and screening of REX-GECO For the engineering of REX-GECO, R-GECO1 in pTorPE 11 was used as a template. Point mutations to R-GECO1 were performed using QuikChange II Site-Directed Mutagenesis Kit (Agilent Technologies). Random mutagenesis was generated by error-prone polymerase chain reaction (PCR) amplification. In the first generation library, the codon for residue 64 was mutated to BMM (where B = guanine and cytosine and thymine and M = adenine and cytosine; encoding Ala, Asp, Gln, Glu, His, Pro, Ser and Tyr), the codon for residue 80 was mutated to VAN (where V = guanine and adenine and cytosine and A = adenine and N = guanine and adenine and thymine and cytosine; encoding Asn, Asp, Gln, Glu, His, and Lys) and the codon for residue 116 was mutated to VHM (where H = adenine and thymine and cytosine; encoding Ala, Asn, Asp, Gln, Glu, His, Ile, Leu, Lys, Met, Pro, Thr, and Val). For REX-GECO variants screening, the imaging system used has been described in detail 46 . PTorPE plasmids containing REX-GECO variants were electroporated into E. coli strain DH10B (Invitrogen). These E. coli were then cultured on 10-cm Lysogeny broth (LB)-agar Petri dishes supplemented with 400 μg ml −1 ampicillin (Sigma) and 0.0004% (wt/vol) L-arabinose (Alfa Aesar) at 37 °C overnight. During screening, a 609/57 nm emission filter was used to capture the fluorescence emission. Two images, image A and image B, were captured by using excitation filter of 438/24 nm or 542/27 nm to illuminate E. coli colonies expressing REX-GECO variants on Petri dishes. These two images were then multiplied to generate a third image C. Colonies that showed the highest 0.1% emission intensities in image C were picked and cultured in 4 ml liquid LB with 100 μg ml −1 ampicillin and 0.0016% (wt/vol) L-arabinose at 37 °C overnight. Proteins were then extracted from the liquid LB culture and subjected to a secondary screen by using a Safire2 fluorescence microplate reader (Tecan).
Show full methods section
Engineering and screening of REX-GECO For the engineering of REX-GECO, R-GECO1 in pTorPE 11 was used as a template. Point mutations to R-GECO1 were performed using QuikChange II Site-Directed Mutagenesis Kit (Agilent Technologies). Random mutagenesis was generated by error-prone polymerase chain reaction (PCR) amplification. In the first generation library, the codon for residue 64 was mutated to BMM (where B = guanine and cytosine and thymine and M = adenine and cytosine; encoding Ala, Asp, Gln, Glu, His, Pro, Ser and Tyr), the codon for residue 80 was mutated to VAN (where V = guanine and adenine and cytosine and A = adenine and N = guanine and adenine and thymine and cytosine; encoding Asn, Asp, Gln, Glu, His, and Lys) and the codon for residue 116 was mutated to VHM (where H = adenine and thymine and cytosine; encoding Ala, Asn, Asp, Gln, Glu, His, Ile, Leu, Lys, Met, Pro, Thr, and Val). For REX-GECO variants screening, the imaging system used has been described in detail 46 . PTorPE plasmids containing REX-GECO variants were electroporated into E. coli strain DH10B (Invitrogen). These E. coli were then cultured on 10-cm Lysogeny broth (LB)-agar Petri dishes supplemented with 400 μg ml −1 ampicillin (Sigma) and 0.0004% (wt/vol) L-arabinose (Alfa Aesar) at 37 °C overnight. During screening, a 609/57 nm emission filter was used to capture the fluorescence emission. Two images, image A and image B, were captured by using excitation filter of 438/24 nm or 542/27 nm to illuminate E. coli colonies expressing REX-GECO variants on Petri dishes. These two images were then multiplied to generate a third image C. Colonies that showed the highest 0.1% emission intensities in image C were picked and cultured in 4 ml liquid LB with 100 μg ml −1 ampicillin and 0.0016% (wt/vol) L-arabinose at 37 °C overnight. Proteins were then extracted from the liquid LB culture and subjected to a secondary screen by using a Safire2 fluorescence microplate reader (Tecan).
Characterization of REX-GECO1
REX-GECO1 proteins were purified as previously described 11 . To measure the fluorescence and absorbance spectra of REX-GECO, a QuantaMaster spectrofluorometer (Photon Technology International), and a DU-800 UV-visible spectrophotometer (Beckman) were used, respectively. REX-GECO1’s extinction coefficient ( ɛ ), quantum yield ( Φ ), p K a and K d were determined as previously described 11 with mCherry and LSS-mKate2 serving as standards. A SX20 stopped-flow spectrometer (Applied Photophysics) was used to measure k off . Briefly, Protein samples with 10 μM CaCl 2 (in 10 mM MOPS, 100 mM KCl pH 7.2) were rapidly mixed with a solution with 10 mM EGTA (in 10 mM MOPS, 100 mM KCl pH 7.2) at room temperature. The k off was determined by fitting the fluorescence decay curve to a single exponential equation. Each protein sample was measured five times, and the averaged value was taken as k off . For characterization of photoactivation of REX-GECOs, purified proteins were diluted to an absorbance value in the range of 0.1–0.5 in a buffered solution. Spectra were recorded using a UV–visible spectrometer (Agilent 8453 spectrophotometer) with or without illumination from a 150 mW (1,200 mW cm −2 ) 405 nm laser (Changchun New Industries Optoelectronics Tech.). Two-photon absorption spectra were measured using fluorescence femtosecond setup, described previously 21 . Briefly, it comprises a tunable parametric amplifier (550–2,000 nm) producing ~100 fs pulses with 1 kHz repetition rate. Rhodamine B in methanol was used as a reference standard 47 for both the spectral shape and absolute cross section evaluations. The cross-sections were measured at 900, 1,000 and 1,130 nm. The quadratic power dependence of fluorescence signal was checked at several wavelengths across the spectrum. The concentration of proteins with matured chromophore was evaluated spectrophotometrically by using the extinction coefficients measured by alkaline denaturation method (see above) and presented in Supplementary Table 2 . Note that Supplementary Fig. 3 presents the effective two-photon cross-section weighted with the relative fractions of neutral (protonated), n (n) , and anionic (deprotonated), n (a) , forms: σ 2 ( λ ) = n ( n ) σ 2 ( n ) ( λ ) + n ( a ) σ 2 ( a ) ( λ ) , where σ 2 ( n ) ( λ ) and σ 2 ( a ) ( λ ) are the molecular two-photon absorption cross-sections of the neutral and anionic forms, respectively, and n (n) + n (a) = 1. Plasmids for mammalian cell imaging For REX-GECO1 plasmid with a CMV promoter, template (REX-GECO1 in pTorPE 11 ) was cloned into a modified pcDNA3 plasmid by PCR as previously described 10 . This vector was used in one-photon, two-photon imaging of HeLa cells and one-photon imaging of dissociated rat hippocampal neurons. For REX-GECO1 plasmid with a human synapsin I promoter, template (REX-GECO1 in pTorPE) was cloned into an AAV2 plasmid flanked by restriction sites BamH1 and HindIII by PCR using following primers: BamH1_fw (5′-GAGGATCCACCATGGTCGACTCATCACGTC-3′) and HindIII_rv (5′-GCGATGAAGCTTCTACTTCGCTGTCATCATTTGTACAAACTCTTCGTAGTTT-3′). For iGluSnFR plasmid with a human synapsin I promoter, iGluSnFR (Addgene plasmid 41732) was used as a template and cloned into an AAV2 plasmid flanked by restriction sites BamH1 and HindIII by PCR using following primers: BamH1_iGlu_fw (5′-CGAGGATCCGCCACCATGGAGACAGACACACTCCTGCTATGGGTAC-3′) and HindIII_iGlu_rv (5′-CCCTTATCATCCTCATCATGCTTTGGCAGAAGAAGCCACGTTAGAAGCTTCGATCC-3′). For GCaMP6s R-GECO1 and RCaMP1h plasmid (with a human synapsin I promoter) used in comparison with REX-GECO1 in rat hippocampal organotypic brain slices, GCaMP6s (Addgene plasmid 40753), R-GECO1 and RCaMP1h (Addgene plasmid 42874) were used as a template and cloned into the same AAV2 plasmid, respectively.
Cell culture HeLa cells
(CCL2 line; ATCC) were cultured on collagen-coated 35-mm glass bottom dishes (Matsunami) until they reached 40–60% confluency. Transfection was performed by incubating HeLa cells with the mixture of 1 μg of plasmid DNA and 3 μl of Lipofectamine 2000 (Life Technologies) for 2 h. After incubation, the medium was exchanged to DMEM (supplemented with 10% fetal bovine serum (FBS; Sigma), 2 mM GlutaMax (Invitrogen) and penicillin-streptomycin) and the cells were incubated for 48 h at 37 °C in a CO 2 incubator. Before imaging, culture medium was changed to HEPES (25 mM) buffered Hanks’ balanced salt solution (HBSS). Dissociated E18 Sprague Dawley Hippocampal Cells in Hibernate EB Complete Media were purchased from BrainBits LLC. The cells were grown on ( In Vitro Scientific) 35 mm glass bottom dish containing NbActiv4 (BrainBits LLC) supplemented with 2% FBS, penicillin-G potassium salt (50 units ml −1 ), and streptomycin sulfate (50 μg ml −1 ). Half of the culture media is replaced every 4–5 days. Neuronal cells were transfected on day 7 with plasmids containing constructs of interest using Lipofectamine 2000.
Transfection of rat hippocampal organotypic brain slices
Horizontal brain slices (250 μm thickness) from a 0-day-old (P0) Sprague Dawley rat were generated in ice-cold HBSS containing 1.3 mM CaCl 2 and 1 mM MgSO 4 with a vibrating microtome (Leica VT1000S, Leica Microsystems, Richmond Hill, ON, Canada) as described previously 30 . All procedures were carried out in compliance with the guidelines of the Canadian Council for Animal Care and with the approval of the University of Alberta Animal Care and Use Committee for Health Science. Hippocampal regions were cut from horizontal brain slices and placed on a sterile 0.4-μm-pore-membrane cell culture insert (Millipore PICMORG50). The insert and slice were then placed in a Petri dish containing 1.5 ml of NbActiv4 (BrainBits) supplemented with 5% FBS, penicillin-G potassium salt (50 units ml −1 ), and streptomycin sulfate (50 μg ml −1 ). Slices are cultured at 37 °C and 5% CO 2 for 24 h before transfection by electroporation. The insert and slice are then placed directly above a Platinum Plate Petri dish electrode (CUY700-P2E, Nepa Gene, Japan) and the gap between the electrode and the membrane is filled with electroporation buffer (EB) (HBSS with 1.5 mM MgCl 2 and 10 mM D-glucose). Plasmids (pcDNA3.1, Life Technologies and AAV2 plasmid) for expression of the gene of interest are dissolved in EB at a concentration of 1 μg μl −1 and sufficient volume is added to just cover the slice. A square platinum electrode (CUY700-P2L, Nepa Gene, Japan) is then placed directly above the hippocampus slice and a power supply is used to apply five 20 V pulses (5 ms each, 1 Hz). The direction of electrical field is reversed and a second set of five pulses with the same settings is applied. The EB is carefully replaced with supplemented NbActiv4 and slices are returned to incubator at 37 °C with 5% CO 2 .
Microscopes for fluorescence imaging
Widefield imaging was performed on an inverted Nikon Eclipse Ti microscope equipped with a 200 W metal halide lamp (PRIOR Lumen), ×20 and ×40 objectives (Nikon), and a 16-bit QuantEM 512SC electron-multiplying charge-coupled device (CCD) camera (Photometrics). A filter set of 472/30 nm (excitation), 622/18 nm (emission) and 495 nm (dichroic) was used for long Stokes shift excitation. Another filter set of 620/600 nm (excitation), 700/75 nm (emission) and 666 nm (dichroic) was used for short Stokes shift excitation. For time-lapse imaging, HeLa cells were treated with 5 μM (final concentration) histamine, 4 mM EGTA (with 5 μM ionomycin) and 10 mM CaCl 2 (with 5 μM ionomycin) in chronological order. Regions of interest (ROIs) corresponding to visually identifiable and healthy cells (based on their morphology) were selected for analysis. For one-photon imaging, we used an upright FV1000 confocal microscope (OlympusCanada, Markham, ON, Canada) equipped with software (FluoView1000, Olympus Canada), a ×20 XLUMPlanF1 water immersion objective (numerical aperture (NA) = 1.00), or a ×60 XLUMPlanF1 water immersion objective (NA = 0.90), and connected to multi-line argon lasers (457, 488 and 515 nm) and HeNe lasers (543 and 633 nm) (Olympus Canada). For two-photon imaging, we used a similar confocal system connected to a MaiTai DeepSee Ti:sapphire laser with a tunable excitation range from 690–1,040 nm (Spectra Physics, Santa Clara, CA, USA). For measuring photostability of REX-GECO1 with two-photon excitation, HeLa cells expressing REX-GECO1 (treated with CaCl 2 (10 mM) and ionomycin (5 μM)) were imaged by two-photon microscopy with a ×20 XLUMPlanF1 water immersion objective (NA = 1.00), and with excitation at 910 nm. Red fluorescent emission was acquired via a 605–680 nm bandpass filter (Semrock Inc, Rochester, NY, USA) with a frame resolution of 256 × 256 and a 10 μs per pixel scanning rate for 500 s. All images were processed and analyzed using ImageJ.
Imaging of rat organotypic hippocampal slices
The brain slice on the Millipore insert was placed in a custom-made chamber to hold it in place during imaging. Immediately before imaging, the slices were perfused with artificial cerebrospinal fluid (ACSF) containing: 120 mM NaCl, 3 mM KCl, 1 mM CaCl 2 , 2 mM MgSO 4 , 26 mM NaHCO 3 , 1.25 mM NaH 2 PO 4 and 10 mM D-glucose (pH adjusted to 7.4 by gassing with 95% O 2 , 5% CO 2 ), at 5 ml −1 min using a peristaltic pump (Watson-Marlow Alitea-AB, Sin-Can, Calgary, AB, Canada) and kept at room temperature. Imaging was started within 10 min following activation of the perfusion system. For single-colour one-photon imaging of REX-GECO1, the hippocampal slice was excited with 488 nm laser and emission was collected from 550 nm to 650 nm using a variable barrier filter. For single-colour one-photon imaging of Ca 2+ using R-GECO1 or RCaMP1h, the hippocampal slice was excited with 543 nm laser and emission was collected from 550 nm to 650 nm using a variable barrier filter. For dual-colour imaging of Ca 2+ using REX-GECO1 and glutamate using iGluSnFR, the slice was excited with 488 nm laser and emission was collected simultaneously in two channels from 500 to 520 nm for iGluSnFR and 590 to 690 nm for REX-GECO1 using variable barrier filters. In all cases, images were acquired at ×1–3 digital zoom at a reduced frame resolution (256 × 256) and with a 4 μs per pixel scanning rate. This allowed image acquisition to be 2–3 frame s- to detect Ca 2+ and glutamate oscillations in neurons ( Figs 3a,c and 4 ) and glial cells ( Fig. 3f,g ). For one-photon imaging of theophylline-induced Ca 2+ and/or glutamate rises in neurons, images were acquired every 0.5 s. Approximately 30 s after the start of the experiment, the superfusate was changed from control ACSF to ACSF containing 10 mM theophylline (Sigma-Aldrich, directly dissolved in ACSF). Approximately 10 min later, the superfusate was changed back to control ACSF. For KCl-evoked depolarization, 10 μl of (2.5 M) KCl was added to raise the concentration of KCl in the recording buffer to 30 mM instantaneously and then left to wash out at the regular rate of the perfusion system at 5 ml min −1 . For one-photon imaging of glutamate-induced Ca 2+ dynamics in glial cells, images were acquired every 0.5 s. Approximately 30 s after the start of the experiment, the superfusate was changed from control ACSF to ACSF containing 100 μM glutamate (Sigma-Aldrich, 1 M stock in dH 2 O, diluted to final concentration in control ACSF) for 10 min and then switched back to control ACSF. For two-colour two-photon imaging of REX-GECO1 and iGluSnFR, the laser wavelength was set at 940 nm. Fluorescence emission was collected using two photomultiplier tube detectors, one of which was equipped with a 460–500 nm bandpass filter, and the other equipped with a 605–680 nm bandpass filter (Semrock Inc, Rochester, NY, USA). Images were acquired every 0.25 s.
Field potential recording
LFP was recorded using a large-diameter patch pipette (outer tip diameter 5–15 μm, d.c. resistance 2–3 M Ω ) micropipette pulled from borosilicate glass capillaries. The micropipette was filled with ACSF solution and placed ~100 μm away from a REX-GECO1 transfected neuron. Electrode signals were amplified (×10 k) and bandpass filtered (0.3–1 kHz) (A-M systems, 1700, Carlsborg, WA, USA). Signals were then integrated (τ: 15 ms) and digitally sampled at 1 kHz (Powerlab/8SP, ADInstruments, Colorado Springs, CO, USA), and stored on a computer using LabChart7 software (ADInstruments). REX-GECO1 fluorescence (imaged at 2 Hz) was imaged simultaneously using the same imaging setup described for imaging organotypic brain slices. Fluorescence images were processed and analyzed using ImageJ software. Electrical field stimulation of organotypic brain slices To stimulate hippocampal neurons in organotypic brain slices, a borosilicate glass capillary electrode (outer tip diameter 30–40 μm) attached to an ISO-Flex pulse stimulator (A.M.P.I.) was placed ~500 μm away from the transfected neurons. The electrode was manoeuvered using a ROE-200 micromanipulator (Sutter Instruments, Novato, CA, USA). Field stimulation pulses (4 V, 1 ms, 100 Hz) were delivered in trains of 1, 3, 5, 10, 20, 50 and 150 pulses using Powerlab/8SP (ADInstruments) to control the pulse stimulator. Each field stimulation pattern was repeated twice. Fluorescence signals (imaged at 2 Hz) induced by field electrode stimulation was recorded using the same imaging setup described for imaging organotypic brain slices. Fluorescence images were processed and analyzed using ImageJ software. In vivo experimental animals Albino X. laevis tadpoles were bred by human chorionic gonadotropin-induced mating. Embryos were reared at room temperature in 0.1× modified Barth’s saline with HEPES (MBSH). Tadpoles were developmentally staged according to the standard criteria of Nieuwkoop and Faber 48 . Experiments were approved by the Montreal Neurological Institute Animal Care Committee in accordance with Canadian Council on Animal Care guidelines. In vivo electroporation Cells in the retina and optic tectum were bulk electroporated as described previously 49 . In brief, glass micropipettes made from borosilicate capillaries pulled on a PC-10 puller (Narishige, Japan) were loaded with DNA plasmid solution (0.5–5 μg μl −1 ) and attached to a custom-made pressure injection system. Plasmid solution was then pressure-injected in the eye or brain ventricle and current was locally delivered across custom-made platinum plate electrodes placed on either side of the eye, or the tectum using three pulses (36 V, 1.6 ms) in each polarity using a constant voltage stimulator (Grass SD-9) with a 3 μF capacitor placed in parallel. In vivo imaging of Xenopus tadpoles Stage 40 tadpoles for retinal electroporation and stage 43 for tectal electroporation were transfected with plasmids encoding REX-GECO1 mixed with EGFP-encoding plasmid, and given at least 48 h to express the protein. Stage 45–47 tadpoles were immobilized by bath application of pancuronium bromide (2 mM, Sigma) and placed in a custom-made imaging chamber, embedded in 1% low-melting point agarose, and then immersed in modified Barth s saline with HEPES (MBSH) solution for tectal cell imaging and with ACSF external solution for retinal imaging. The ACSF solution contains 115 mM NaCl, 2 mM KCl, 5 mM HEPES, 3 mM CaCl 2 , 1.5 mM MgCl 2 , 10 mM D-glucose, 5 μM glycine; 250 mOsm; pH 7.2. In vivo two-photon images of tectal cells or retinal cells were acquired at 2 and 5 Hz, respectively, using a Thorlabs multiphoton microscope with resonant scanner and Olympus ×20 1.0 NA immersion objective, A MaiTai-BB Ti:sapphire femtosecond pulsed laser set to excite at 910 nm was used for fluorescence excitation. Green (500–550 nm) and red (584–676 nm) emission filters were used for fluorescence detection. For visual stimulation, an A310 Accupulser (WPI) was used to drive a blue LED (447.5 nm, royal-blue Luxeon Star) to present trains of light flashes. Ex vivo imaging of tadpole brains Stage 45–47 tadpoles were anesthetised by immersion in 0.02% MS-222 and the brain was dissected and perfused with Mg-free external solution containing 115 mM NaCl, 2 mM KCl, 5 mM HEPES, 3 mM CaCl 2 , 10 mM D-glucose, 10 μM glycine; 250 mOsm; pH 7.2. Imaging was carried out at 910 nm using an Olympus FV300 confocal microscope converted for multiphoton use, with a ×40 1.0 NA immersion objective. For pharmacological activation of N-methyl-D-aspartate receptors (NMDARs), 20 μM NMDA was applied to the bath. To visualize fluorescence intensity changes, images of the tectum were acquired at 2 Hz simultaneously on green (500–550 nm) and red (593–668 nm) channels. At the end of each experiment, z-series stacks at 1 μm inteval were collected to obtain full three-dimensional cellular morphologies.
Fluorescence intensity change analysis Ellipsoid
ROIs were selected manually around visually identifiable somata, or complex ROIs were drawn around axons or dendrites and the mean intensity of the ROIs in both the green and the red channel was determined for each frame from the time series using ImageJ (NIH). The background intensity was measured by calculating the mean intensity of a large ROI in an area without any fluorescent structures. For each frame, the background intensity was subtracted from the intensity of the ROI of the cell compartment of interest. For the in vivo visual stimulation, F 0 was calculated as an average of the (ROI intensity–background intensity) for the initial 25 frames baseline period before the beginning of the light flashes. The change in fluorescence was measured as Δ F / F 0 , where Δ F = F (t) − F 0 . For the ex vivo pharmacological preparation for each time point the following ratio ( R ) was calculated: R = ( ROI − background ) red /( ROI – background ) green . R 0 was calculated as an average of R during the initial 37 s baseline before application of drug. The change of fluorescence intensity was measured as Δ R / R 0 , where Δ R = R (t) − R 0 . Statistics Two-tailed Student’s t -tests were used to determine significance.
📊 Figures

Figure 1
Structure of R-GECO1 and screening scheme for REX-GECO
( a ) Overall structure of R-GECO1 (PDB ID 4I2Y) and zoom in on its chromophore. The side chains of three proximal residues, Ser64, Lys80 and Ile116, are shown in stick format 9 . Residue numbering is...

Figure 2
Structural model and excitation, emission spectra of REX-GECO1
( a ) Model of REX-GECO1, showing location of substitutions relative to R-GECO1 (PDB ID 4I2Y) 9 . Residue numbering is consistent with the crystal structure of G-CaMP2 (PDB ID 3EVR) 6 . ( b ) Excitati...

Figure 3
Confocal imaging of REX-GECO1 in neurons and glial cells in organotypic brain slices
( a ) An average intensity projection of a 3D Z-stack of images acquired for an organotypic rat hippocampal brain slice in which neurons are expressing REX-GECO1 under the synapsin I promoter. Scale b...
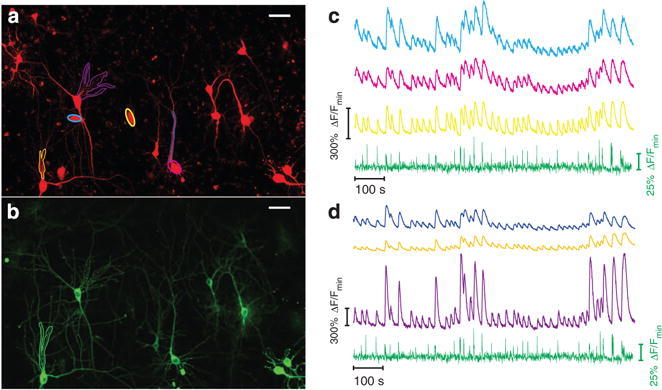
Figure 4
One-photon confocal dual-color imaging of REX-GECO1 co-expressed with a green glutamate indicator (iGluSnFR) in organotypic rat hippocampal slices
( a ) An average intensity projection of a 3D Z-stack of neurons expressing REX-GECO1 under synapsin I promoter in a hippocampal slice, Scale bar represents 30 u03bcm. ( b ) An average intensity proje...

Figure 5
Two-photon dual-color imaging of neurons co-expressing REX-GECO1 and iGluSnFR in organotypic rat hippocampal brain slices
( a ) A neuron expressing cytoplasmic REX-GECO1 under synapsin I promoter in a hippocampal slice (emission 605u2013680 nm), Scale bar represents 20 u03bcm. ( b ) The same neuron as in ( a ) co-express...
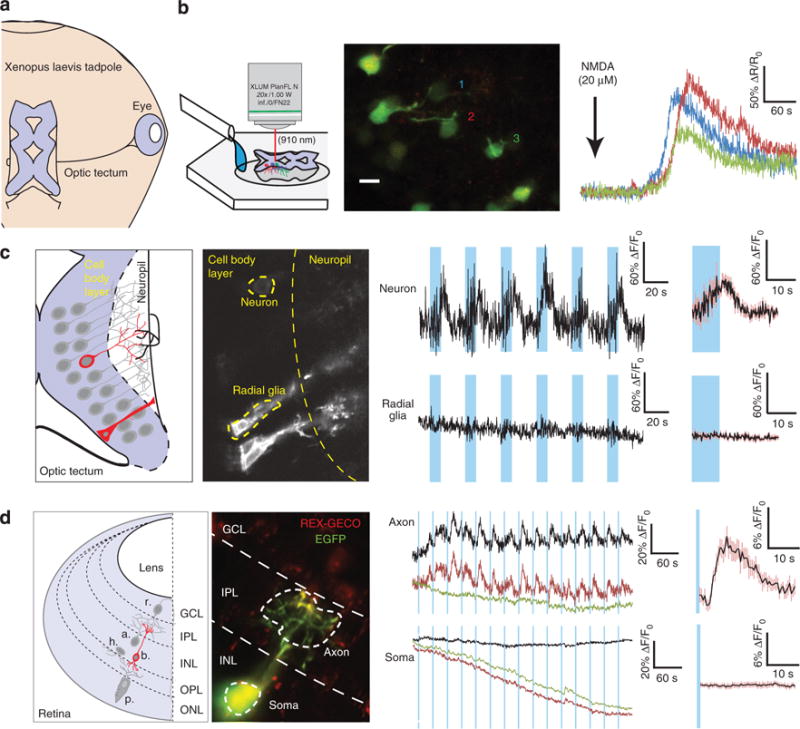
Figure 6
Ex vivo and in vivo two-photon microscopy of REX-GECO responses to pharmacological and visual stimulation in the retinotectal system of Xenopus laevis tadpoles
( a ) The eye projects visual inputs to the contralateral optic tectum in the tadpole (OB, olfactory bulb; DiE, diencephalon; E, eye; OT, optic tectum; and HB, hindbrain). ( b ) An isolated brain prep...
Figure images are served from the NIH/NLM PubMed Central Open Access Subset or Europe PMC; copyright remains with the publishers and authors.
💬 Discussion
0 commentsNo comments yet. Be the first to start a discussion!
Leave a Comment