Abstract
The cell-cycle field has identified the core regulators that drive the cell cycle, but we do not have a clear map of the dynamics of these regulators during cell-cycle progression versus cell-cycle exit. Here we use single-cell time-lapse microscopy of Cyclin-Dependent Kinase 2 (CDK2) activity followed by endpoint immunofluorescence and computational cell synchronization to determine the temporal dynamics of key cell-cycle proteins in asynchronously cycling human cells. We identify several unexpected patterns for core cell-cycle proteins in actively proliferating (CDK2-increasing) versus spontaneously quiescent (CDK2-low) cells, including Cyclin D1, the levels of which we find to be higher in spontaneously quiescent versus proliferating cells. We also identify proteins with concentrations that steadily increase or decrease the longer cells are in quiescence, suggesting the existence of a continuum of quiescence depths. Our single-cell measurements thus provide a rich resource for the field by characterizing protein dynamics during proliferation versus quiescence.
🔬 Techniques
💻 Software
✨ Fluorophores
🧪 Sample Preparation
🔬 Cell Lines
🏭 Microscope Brands
🧪 Reagent Suppliers
🔎 Objectives
💻 Software Details
💻 Code & Software
💾 Data Repositories
🏛️ Research Organizations (ROR)
Affiliated research institutions:
📋 Methods
Single-cell methods for characterizing cell-cycle dynamics in unperturbed cells
We used 2 complementary single-cell methods to chronicle the dynamics of key cell-cycle regulators. The first method uses 4-color IF snapshot images to categorize individual cells as G1, S, G2, M, or G0/quiescent. This approach has the advantage of being readily applicable to any cell line without the need to insert fluorescent sensors or perform time-lapse microscopy but does not explicitly carry time-dependent information. By co-staining cells with Hoechst (to measure DNA content) and EdU (a marker for DNA synthesis) [ 34 ], we could subdivide the cell cycle into 5 categories ( Fig 1B–1D and S1B Fig ): cells with 2N DNA content and no EdU incorporation were classified as G0 or G1; cells with near 2N DNA content and intermediate EdU signal were classified as early S phase; cells with high EdU signal were classified as S phase; cells with near 4N DNA content and intermediate EdU signal were classified as late S phase; and cells with 4N DNA content and no EdU incorporation were classified as G2 or M ( Fig 1B ). To further distinguish cells in G0 from cells in G1, we co-stained cells with an antibody against phospho-Rb at either Serine 780 or Serine 807/811. These sites are phosphorylated by CDK2 and thus can serve as a fixed-cell readout of CDK2 activity. The phospho-Rb signal is bimodally distributed, representing hypo- and hyper-phosphorylated Rb ( Fig 1C ). Newly born cells with hypo-phosphorylated Rb were previously shown to be in the CDK2 low state, whereas newly born cells with hyper-phosphorylated Rb are in the CDK2 inc state [ 11 ]. Therefore, EdU-negative cells with 2N DNA content and hypo-phosphorylated Rb are classified here as G0/quiescent, and EdU-negative cells with 2N DNA content and hyper-phosphorylated Rb are classified here as G1 ( Fig 1C ). To distinguish cells in G2 from cells in M, we used an antibody against phospho-Histone H3 (pHH3), a well-established marker for mitosis. EdU-negative cells with 4N DNA content that were pHH3-negative were classified as G2, and cells that were pHH3-positive were classified as mitotic ( Fig 1D ). We used 3 fluorescent channels to stain cells with Hoechst, EdU, and either phospho-Rb or pHH3 ( S1C Fig ), and used the fourth channel to measure 1 of 14 proteins of interest in MCF10A human mammary epithelial cells. We also validated our results in Hs68 human foreskin fibroblasts. We avoided use of cancer cell lines, which often have mutations in the core cell-cycle regulatory network. The second method involves time-lapse microscopy over 24 hours of MCF10A cells expressing Histone 2B (H2B) fused to mTurquoise and the CDK2 sensor fused to mVenus. Immediately after the last frame was taken, cells were fixed with para-formaldehyde, processed for IF, and reimaged. Custom MATLAB-based cell-tracking scripts were used to extract single-cell traces of CDK2 activity, with a custom “jitter correction” to re-register the images before and after IF (see Materials and methods ). In this way, we can match each cell’s IF staining to its history. The H2B signal is used to automatically identify the frame of anaphase for each cell, which enables automated alignment of all CDK2 activity traces (and consequently each cell’s IF signal) to each cell’s final anaphase of the movie. The resulting plot demonstrates the bifurcation in CDK2 activity that is evident as cells complete mitosis and assume either a CDK2 inc , CDK2 low , or CDK2 emerge state ( Fig 1E ) [ 11 ]. Another subset of cells has no mitoses during the course of the 24-hour movie, of which a further subset has low CDK2 activity for the entire 24-hour imaging period. Although these cells are not cycling, they are also not senescent ( S2A–S2C Fig ) and thus appear to be in a prolonged quiescence ( Fig 1F ). Indeed, we confirmed that these cells can emerge from this prolonged quiescence ( S2D Fig ). In our unperturbed MCF10A cells, 95.6% ± 5.4% of the total population divided at least once during the 24-hour imaging. Of the total population,79.0% ± 6.2% entered the CDK2 inc state after mitosis, 8.8% ± 2.6% remained CDK2 low after mitosis, and 7.8% ± 1.7% entered the CDK2 low state after mitosis but built up their CDK2 activity before the end of the imaging period (CDK2 emerge ) ( Fig 1E ). Among the 4.4% that did not divide during the course of the movie, 52.3% ± 17.7% stayed in a prolonged quiescence (representing 2.3% ± 0.8% of the total population, Fig 1F ) and 47.7% ± 17.7% (or 2.1% ± 0.8% of the total population) were observed to build up CDK2 activity before the end of the imaging period ( S1 Movie and S2D Fig ). For CDK2 emerge cells, automated identification of the time point when cells begin building up CDK2 activity after being in a CDK2 low state allows automated alignment of CDK2 emerge traces to this event ( Fig 1G ), which we have previously argued represents the R-point [ 11 , 35 ]. Alignment of the CDK2 activity traces in these various ways allows for the staging of IF-based protein levels or modification states as a function of time-since-anaphase, or time-since-R-point. Cells treated with EdU for 15 minutes at the end of a 24-hour time-lapse sequence illustrate the power of this approach—CDK2 inc cells display the classic “rainbow” pattern of EdU as a function of time-since-anaphase, allowing us to identify and label G1, S, and G2 phases of the cell cycle in our time-lapse + IF experiments ( Fig 1H , blue). CDK2 low cells ( Fig 1H , red) and prolonged quiescent cells ( Fig 1H , purple) display no EdU signal. A moving average through the CDK2 inc and CDK2 low subpopulations further illustrates the effect ( Fig 1I ). CDK2 emerge cells aligned to the time at which CDK2 activity begins to increase show a pattern similar to the CDK2 inc cells but with less clarity due to the difficulty of automating the identification of the first frame of CDK2 activity rise (relative to the easy automatic identification of the first frame of anaphase; Fig 1J ). This plot shows that CDK2 emerge cells begin S phase at a similar time after the initial CDK2 activity buildup as CDK2 inc cells. These 2 methods were used to chronicle the dynamics of 14 proteins during cell-cycle progression and spontaneous quiescence. The proteins were chosen because of the availability of selective antibodies, their role as core cell-cycle regulators (Cyclin A2, Cyclin B1, Cyclin E, Cyclin D1, p21, p27, Cdt1, Geminin, total Rb, and phospho-Rb), or as important signaling inputs to the cell cycle (cMyc, Fra1, phospho-cJun, and p53). Nine proteins were highly dynamic over the course of the cell cycle (Cyclin A, Cyclin B, Cyclin E, Cyclin D, p21, Cdt1, Geminin, cMyc, and phospho-Rb; Figs 2 – 5 and S3 Fig ), whereas others tested were relatively invariant over the cell cycle in the cell types examined here (p27, total Rb, p53, Fra1, and phospho-cJun; S4 and S5 Figs). 10.1371/journal.pbio.2003268.g002 Fig 2 Protein levels for asynchronous MCF10A cells in G0, G1, S, G2, and M phases of the cell cycle. (A–H) Column 1: Density scatter of the indicated protein versus DNA content; data are pooled from 9 IF images from 1 representative well. Column 2: Contour plot of the indicated protein versus DNA content; contours are color-coded by cell-cycle phase according to the legend. Data are pooled from 9 IF images from 1 representative well. Column 3: Histogram (probability density) of the indicated protein for G0 cells (purple, defined as 2N DNA content, EdU-negative, and hypo-phosphorylated Rb) versus G1 cells (blue, defined as 2N DNA content, EdU-negative, and hyper-phosphorylated Rb). Two biological replicates are shown; each replicate represents 9 pooled IF images. Note that the y-axes for Column 1 and Column 2, and the x-axis for Column 3, are in log base 10; units are arbitrary fluorescence units. All signals are nuclear except where indicated. Also note that because of cell rounding during mitosis, IF signal intensities are artificially high in mitotic cells. Abbreviation: Cyto-CycB1, Cytoplasmic Cyclin B1 signal; IF, immunofluorescence; Rb, retinoblastoma protein. 10.1371/journal.pbio.2003268.g003 Fig 3 Protein dynamics for proliferating and spontaneously quiescent MCF10A cells. (A–I) Column 1: Time-lapse imaging of CDK2 activity in asynchronous cells was followed by fixation and IF staining for the indicated protein. Protein signals were then reconstructed as a function of time-since-anaphase for CDK2 inc cells (blue dots) and CDK2 low cells (red dots), as in Fig 1H . The protein signal in prolonged quiescent cells is plotted at the 24-hour mark (purple dots). The approximate time spent in G1, S, or G2 is marked above the plots, based on EdU incorporation data from Fig 1H . Column 2: Moving average through the blue, red, or purple points from Column 1, as in Fig 1I . Error bars represent standard deviation. Column 3: Protein signal as a function of time since CDK2 activity buildup (R-point), as in Fig 1J . The y-axis units are arbitrary fluorescence units. Total number of cells plotted: (A) 1,949; (B) 433; (C) 1,549; (D) 1,729; (E) 2,596; (F) 1,043; (G) 1,885; (H) 2,117; (I) 1,300. The data for each antibody are pooled from 8 replicate wells (1 image per well). Abbreviations: CDK2, Cyclin-Dependent Kinase 2; IF, immunofluorescence; R-point, Restriction Point. 10.1371/journal.pbio.2003268.g004 Fig 4 Validation of antibody staining in serum-starved cells and validation of Cyclin D1 results by time-lapse imaging of mCitrine-Cyclin D1. (A–B) Cells were serum starved for the indicated time and analyzed by western blotting (A) or IF (B). (B) Column 1: Quantification of western blots in (A). Column 2: Average IF signal of the indicated antibody signal across 3 replicate wells upon serum starvation for the amounts of time indicated in (A). Error bars represent standard deviation from 3 replicate wells. Column 3: Probability density of the indicated antibody signal at 0, 16, 48, 96, and 168 hours after serum withdrawal. (C) Time-lapse imaging of asynchronous mCitrine-Cyclin D1 knock-in MCF10A cells expressing H2B-mTurquoise and mCherry-tagged CDK2 sensor. Single cell traces of CDK2 inc and CDK2 low cells are colored blue and red, respectively, and computationally synchronized to anaphase onset. Upper panel: traces of CDK2 activity in control treatment. Middle panel: corresponding traces of mCitrine-Cyclin D1 level in control treatment. Lower panel: traces of mCitrine-Cyclin D1 level in cells that received 1.4 μM MLN4924 at 1-2 hours after anaphase onset. (D) Examples of single-cell traces of CDK2 activity and mCitrine-Cyclin D1 in 1 CDK2 inc cell (top) and 1 CDK2 low cell (bottom). In CDK2 inc cells, mCitrine-Cyclin D1 levels are moderate in G1, fall in S phase, and increase again in G2, whereas mCitrine-Cyclin D1 levels begin to increase steadily shortly after mitosis in CDK2 low cells. Orange arrows mark mitoses. Abbreviations: CDK2, Cyclin-Dependent Kinase 2; IF, immunofluorescence; R-point, Restriction Point. 10.1371/journal.pbio.2003268.g005 Fig 5 Data synthesis to generate maps of protein dynamics during cell-cycle progression and cell-cycle exit. (A) Moving average traces from Fig 3 Column 2 were normalized such that the minimum signal experienced across CDK2 inc and CDK2 low data for a given protein was set to 0, and the maximum signal experienced across CDK2 inc and CDK2 low data for this protein was set to 1. The approximate time spent in G1, S, or G2 phases is marked above the plots, based on EdU incorporation data from Fig 1H . Group 1 (top row): protein signals that are “off” in quiescent cells. Group 2 (bottom row): protein signals that change dynamically over time in quiescent cells. (B) Schematized representation of the data from (A).
Show full methods section
Single-cell methods for characterizing cell-cycle dynamics in unperturbed cells
We used 2 complementary single-cell methods to chronicle the dynamics of key cell-cycle regulators. The first method uses 4-color IF snapshot images to categorize individual cells as G1, S, G2, M, or G0/quiescent. This approach has the advantage of being readily applicable to any cell line without the need to insert fluorescent sensors or perform time-lapse microscopy but does not explicitly carry time-dependent information. By co-staining cells with Hoechst (to measure DNA content) and EdU (a marker for DNA synthesis) [ 34 ], we could subdivide the cell cycle into 5 categories ( Fig 1B–1D and S1B Fig ): cells with 2N DNA content and no EdU incorporation were classified as G0 or G1; cells with near 2N DNA content and intermediate EdU signal were classified as early S phase; cells with high EdU signal were classified as S phase; cells with near 4N DNA content and intermediate EdU signal were classified as late S phase; and cells with 4N DNA content and no EdU incorporation were classified as G2 or M ( Fig 1B ). To further distinguish cells in G0 from cells in G1, we co-stained cells with an antibody against phospho-Rb at either Serine 780 or Serine 807/811. These sites are phosphorylated by CDK2 and thus can serve as a fixed-cell readout of CDK2 activity. The phospho-Rb signal is bimodally distributed, representing hypo- and hyper-phosphorylated Rb ( Fig 1C ). Newly born cells with hypo-phosphorylated Rb were previously shown to be in the CDK2 low state, whereas newly born cells with hyper-phosphorylated Rb are in the CDK2 inc state [ 11 ]. Therefore, EdU-negative cells with 2N DNA content and hypo-phosphorylated Rb are classified here as G0/quiescent, and EdU-negative cells with 2N DNA content and hyper-phosphorylated Rb are classified here as G1 ( Fig 1C ). To distinguish cells in G2 from cells in M, we used an antibody against phospho-Histone H3 (pHH3), a well-established marker for mitosis. EdU-negative cells with 4N DNA content that were pHH3-negative were classified as G2, and cells that were pHH3-positive were classified as mitotic ( Fig 1D ). We used 3 fluorescent channels to stain cells with Hoechst, EdU, and either phospho-Rb or pHH3 ( S1C Fig ), and used the fourth channel to measure 1 of 14 proteins of interest in MCF10A human mammary epithelial cells. We also validated our results in Hs68 human foreskin fibroblasts. We avoided use of cancer cell lines, which often have mutations in the core cell-cycle regulatory network. The second method involves time-lapse microscopy over 24 hours of MCF10A cells expressing Histone 2B (H2B) fused to mTurquoise and the CDK2 sensor fused to mVenus. Immediately after the last frame was taken, cells were fixed with para-formaldehyde, processed for IF, and reimaged. Custom MATLAB-based cell-tracking scripts were used to extract single-cell traces of CDK2 activity, with a custom “jitter correction” to re-register the images before and after IF (see Materials and methods ). In this way, we can match each cell’s IF staining to its history. The H2B signal is used to automatically identify the frame of anaphase for each cell, which enables automated alignment of all CDK2 activity traces (and consequently each cell’s IF signal) to each cell’s final anaphase of the movie. The resulting plot demonstrates the bifurcation in CDK2 activity that is evident as cells complete mitosis and assume either a CDK2 inc , CDK2 low , or CDK2 emerge state ( Fig 1E ) [ 11 ]. Another subset of cells has no mitoses during the course of the 24-hour movie, of which a further subset has low CDK2 activity for the entire 24-hour imaging period. Although these cells are not cycling, they are also not senescent ( S2A–S2C Fig ) and thus appear to be in a prolonged quiescence ( Fig 1F ). Indeed, we confirmed that these cells can emerge from this prolonged quiescence ( S2D Fig ). In our unperturbed MCF10A cells, 95.6% ± 5.4% of the total population divided at least once during the 24-hour imaging. Of the total population,79.0% ± 6.2% entered the CDK2 inc state after mitosis, 8.8% ± 2.6% remained CDK2 low after mitosis, and 7.8% ± 1.7% entered the CDK2 low state after mitosis but built up their CDK2 activity before the end of the imaging period (CDK2 emerge ) ( Fig 1E ). Among the 4.4% that did not divide during the course of the movie, 52.3% ± 17.7% stayed in a prolonged quiescence (representing 2.3% ± 0.8% of the total population, Fig 1F ) and 47.7% ± 17.7% (or 2.1% ± 0.8% of the total population) were observed to build up CDK2 activity before the end of the imaging period ( S1 Movie and S2D Fig ). For CDK2 emerge cells, automated identification of the time point when cells begin building up CDK2 activity after being in a CDK2 low state allows automated alignment of CDK2 emerge traces to this event ( Fig 1G ), which we have previously argued represents the R-point [ 11 , 35 ]. Alignment of the CDK2 activity traces in these various ways allows for the staging of IF-based protein levels or modification states as a function of time-since-anaphase, or time-since-R-point. Cells treated with EdU for 15 minutes at the end of a 24-hour time-lapse sequence illustrate the power of this approach—CDK2 inc cells display the classic “rainbow” pattern of EdU as a function of time-since-anaphase, allowing us to identify and label G1, S, and G2 phases of the cell cycle in our time-lapse + IF experiments ( Fig 1H , blue). CDK2 low cells ( Fig 1H , red) and prolonged quiescent cells ( Fig 1H , purple) display no EdU signal. A moving average through the CDK2 inc and CDK2 low subpopulations further illustrates the effect ( Fig 1I ). CDK2 emerge cells aligned to the time at which CDK2 activity begins to increase show a pattern similar to the CDK2 inc cells but with less clarity due to the difficulty of automating the identification of the first frame of CDK2 activity rise (relative to the easy automatic identification of the first frame of anaphase; Fig 1J ). This plot shows that CDK2 emerge cells begin S phase at a similar time after the initial CDK2 activity buildup as CDK2 inc cells. These 2 methods were used to chronicle the dynamics of 14 proteins during cell-cycle progression and spontaneous quiescence. The proteins were chosen because of the availability of selective antibodies, their role as core cell-cycle regulators (Cyclin A2, Cyclin B1, Cyclin E, Cyclin D1, p21, p27, Cdt1, Geminin, total Rb, and phospho-Rb), or as important signaling inputs to the cell cycle (cMyc, Fra1, phospho-cJun, and p53). Nine proteins were highly dynamic over the course of the cell cycle (Cyclin A, Cyclin B, Cyclin E, Cyclin D, p21, Cdt1, Geminin, cMyc, and phospho-Rb; Figs 2 – 5 and S3 Fig ), whereas others tested were relatively invariant over the cell cycle in the cell types examined here (p27, total Rb, p53, Fra1, and phospho-cJun; S4 and S5 Figs). 10.1371/journal.pbio.2003268.g002 Fig 2 Protein levels for asynchronous MCF10A cells in G0, G1, S, G2, and M phases of the cell cycle. (A–H) Column 1: Density scatter of the indicated protein versus DNA content; data are pooled from 9 IF images from 1 representative well. Column 2: Contour plot of the indicated protein versus DNA content; contours are color-coded by cell-cycle phase according to the legend. Data are pooled from 9 IF images from 1 representative well. Column 3: Histogram (probability density) of the indicated protein for G0 cells (purple, defined as 2N DNA content, EdU-negative, and hypo-phosphorylated Rb) versus G1 cells (blue, defined as 2N DNA content, EdU-negative, and hyper-phosphorylated Rb). Two biological replicates are shown; each replicate represents 9 pooled IF images. Note that the y-axes for Column 1 and Column 2, and the x-axis for Column 3, are in log base 10; units are arbitrary fluorescence units. All signals are nuclear except where indicated. Also note that because of cell rounding during mitosis, IF signal intensities are artificially high in mitotic cells. Abbreviation: Cyto-CycB1, Cytoplasmic Cyclin B1 signal; IF, immunofluorescence; Rb, retinoblastoma protein. 10.1371/journal.pbio.2003268.g003 Fig 3 Protein dynamics for proliferating and spontaneously quiescent MCF10A cells. (A–I) Column 1: Time-lapse imaging of CDK2 activity in asynchronous cells was followed by fixation and IF staining for the indicated protein. Protein signals were then reconstructed as a function of time-since-anaphase for CDK2 inc cells (blue dots) and CDK2 low cells (red dots), as in Fig 1H . The protein signal in prolonged quiescent cells is plotted at the 24-hour mark (purple dots). The approximate time spent in G1, S, or G2 is marked above the plots, based on EdU incorporation data from Fig 1H . Column 2: Moving average through the blue, red, or purple points from Column 1, as in Fig 1I . Error bars represent standard deviation. Column 3: Protein signal as a function of time since CDK2 activity buildup (R-point), as in Fig 1J . The y-axis units are arbitrary fluorescence units. Total number of cells plotted: (A) 1,949; (B) 433; (C) 1,549; (D) 1,729; (E) 2,596; (F) 1,043; (G) 1,885; (H) 2,117; (I) 1,300. The data for each antibody are pooled from 8 replicate wells (1 image per well). Abbreviations: CDK2, Cyclin-Dependent Kinase 2; IF, immunofluorescence; R-point, Restriction Point. 10.1371/journal.pbio.2003268.g004 Fig 4 Validation of antibody staining in serum-starved cells and validation of Cyclin D1 results by time-lapse imaging of mCitrine-Cyclin D1. (A–B) Cells were serum starved for the indicated time and analyzed by western blotting (A) or IF (B). (B) Column 1: Quantification of western blots in (A). Column 2: Average IF signal of the indicated antibody signal across 3 replicate wells upon serum starvation for the amounts of time indicated in (A). Error bars represent standard deviation from 3 replicate wells. Column 3: Probability density of the indicated antibody signal at 0, 16, 48, 96, and 168 hours after serum withdrawal. (C) Time-lapse imaging of asynchronous mCitrine-Cyclin D1 knock-in MCF10A cells expressing H2B-mTurquoise and mCherry-tagged CDK2 sensor. Single cell traces of CDK2 inc and CDK2 low cells are colored blue and red, respectively, and computationally synchronized to anaphase onset. Upper panel: traces of CDK2 activity in control treatment. Middle panel: corresponding traces of mCitrine-Cyclin D1 level in control treatment. Lower panel: traces of mCitrine-Cyclin D1 level in cells that received 1.4 μM MLN4924 at 1-2 hours after anaphase onset. (D) Examples of single-cell traces of CDK2 activity and mCitrine-Cyclin D1 in 1 CDK2 inc cell (top) and 1 CDK2 low cell (bottom). In CDK2 inc cells, mCitrine-Cyclin D1 levels are moderate in G1, fall in S phase, and increase again in G2, whereas mCitrine-Cyclin D1 levels begin to increase steadily shortly after mitosis in CDK2 low cells. Orange arrows mark mitoses. Abbreviations: CDK2, Cyclin-Dependent Kinase 2; IF, immunofluorescence; R-point, Restriction Point. 10.1371/journal.pbio.2003268.g005 Fig 5 Data synthesis to generate maps of protein dynamics during cell-cycle progression and cell-cycle exit. (A) Moving average traces from Fig 3 Column 2 were normalized such that the minimum signal experienced across CDK2 inc and CDK2 low data for a given protein was set to 0, and the maximum signal experienced across CDK2 inc and CDK2 low data for this protein was set to 1. The approximate time spent in G1, S, or G2 phases is marked above the plots, based on EdU incorporation data from Fig 1H . Group 1 (top row): protein signals that are “off” in quiescent cells. Group 2 (bottom row): protein signals that change dynamically over time in quiescent cells. (B) Schematized representation of the data from (A).
Materials and methods Cell culture and reagents
MCF10A human mammary epithelial cells were maintained in DMEM/F12 (ThermoFisher) supplemented with 5% horse serum (Invitrogen), 20 ng/ml epidermal growth factor (EGF, Sigma-Aldrich), 0.5 mg/ml hydrocortisone (Sigma-Aldrich, St. Louis, MO), 100 ng/ml cholera toxin (Sigma-Aldrich), 10 μg/ml insulin (Invitrogen), and penicillin/streptomycin. For serum starvation media, the horse serum, EGF, and insulin were removed, and 0.3% BSA was added. For live-cell time-lapse imaging, phenol-red free DMEM/F12 was used. Hs68 primary human foreskin fibroblasts were cultured in DMEM with 10% FBS and penicillin/streptomycin. Both cell lines were purchased from ATCC. Hs68 cells can be propagated for 42 passages according to ATCC and are not immortalized; cells were received at passage 12 and were used within 13 passages of receipt. MCF10A cells expressing the CDK2 sensor (DHB-mVenus) and tagged histone H2B (H2B-mTurquoise) are as described [ 11 ]. Integration of the mCitrine-encoding gene into the CCND1 locus was carried out using CRISPR technology [ 68 ]. A CRISPR-Cas9 ribonucleoprotein (RNP) complex was generated using the CRISPR-Cas9 System from IDT. The RNP contains crRNA (GGAGCUGGUGUUCCAUGGCUGUUUUAGAGCUAUGCU) annealed to tracrRNA and Cas9 nuclease. The RNP was electroporated into MCF10A cells using the Neon system from Life Technologies following the manufacturer’s protocol with 2 pulses, 30 ms at 1150 V. Single cells were sorted by flow cytometry into 96-well plates and grown into clones.
Western blot and IF against Cyclin
D1 protein, as well as PCR of the CCND1 gene, were carried out as validation. Data from clone 2A7 is shown in this work ( S8 Fig ). For functional validation, cells were treated with Mek inhibitor (PD0325901, S1036 from Selleckchem) at 100 nM for 32 hours, or treated for 32 hours followed by a Mek inhibitor washout for 6 hours. To confirm a similar response to inhibition of degradation for both mCitrine-Cyclin D1 and endogenous Cyclin D1, the mCitrine-Cyclin D1 line and parental wild type MCF10A line were treated with MLN4924 (Active Biochem, A-1139) at 1.4 μM or Bortezomib (Cayman Chemical,10008822) at 1 μM for 2 hours ( S8A Fig ). siRNA siRNA oligos were synthesized by Dharmacon: CCNA2 (MU-003205-02-002), CCNE1 (MU-003213-02-0002), CCNE2 (MU-003214-02-0002), CDKN1A (MU-003471-00-0002), CCND1 (MU-003210-05-0002), RB1 (MU-003296-03-0002) or IDT: CCNB1 (hs.Ri.CCNB1.13.1), GMNN (hs.Ri.GMNN.13.1), CDT1 (hs.Ri.CDT1.13.2), MYC (hs.Ri.MYC.13.2), and Negative Control DsiRNA (51-01-14-04). The oligos were electroporated into MCF10A cells following manufacturer’s instruction (Neon system, Life Technologies). Cells were fixed for IF or lysed for western blotting 20 hours (for short-live proteins: Cyclin A2, Cyclin B1, Cyclin E, Cyclin D1, c-Myc, p21, Geminin, and Cdt1) or 48 hours (for longer-live proteins: Rb) after the electroporation.
Immunofluorescence
Antibodies used in this study are p21 Waf1/Cip1 (CST #2947) at 1:250, phospho-Rb (Ser807/811) (CST #8516) at 1:250, phospho-Rb 780 (BD Biosciences #668385) at 1:250, p21 (BD Biosciences #556430) at 1:250, total Rb (a gift from Julien Sage) at 1:200, p53 (DO-1) (Santa Cruz sc-126) at 1:100 and p53 (Ab-1) (Calbiochem OP03) at 1:100, Fra-1 (Santa Cruz #28310) at 1:200, Cyclin E clone HE12 (Zymed #32–1600) at 1:400, Cyclin D1 clone SP4 (Thermo Scientific RM-9140-S0) at 1:250, Cyclin A2 (Santa Cruz #751) at 1:500, phospho-Histone H3 (Ser10) (CST #9706 and #9701) at 1:200, p27 (BD Bioscience #610241) at 1:100, Geminin (CST #5165) at 1:250, Cyclin B1 (CST #4138) at 1:100, c-Myc (CST #5605) at 1:250, CDT1 (CST #8064) at 1:200, phospho-c-Jun (Ser73) (CST #3270) at 1:800, and Alexa Fluor-488, -546, -647 secondary antibodies (ThermoFisher) at 1:500. For Cyclin E IF, cells were fixed in −20°C methanol for 5 minutes and then washed twice with PBS. For all other antibodies, cells were fixed with 4% paraformaldehyde and then washed twice with PBS. Cells were then incubated with a blocking/permeabilization buffer (10% FBS, 1% BSA, 0.1% TX-100 and 0.01% NaN 3 for antibodies against Cyclin E, p21, Cdt1, Geminin, Fra1, p53, and phospho-c-Jun) for an hour at room temperature, or sequentially permeabilized with 0.2% TX-100 for 15 minutes at 4°C and blocked with 3% BSA for an hour at room temperature (for antibodies against Cyclin A2, Cyclin B1, Cyclin D1, c-Myc, p27, and total Rb). Primary antibody staining was carried out overnight at 4°C in the corresponding blocking buffer and visualized using secondary antibodies conjugated to Alexa Fluor-488, -546, or -647. Where phospho-Rb and phospho-Histone H3 antibodies were used in conjunction with an antibody for a protein of interest in Fig 2 , cells were processed using the method appropriate for the protein of interest. Where indicated, cells were incubated in media containing 10 μM EdU for 15 minutes, and then fixed and processed according to manufacturer’s instructions (ThermoFisher # C10340 ). Images were acquired on an ImageXpress Micro XLS widefield microscope (Molecular Devices) with a 10X 0.45NA objective and processed using custom scripts in MATLAB.
Time-lapse microscopy
Cells were plated at least 24 hours prior to imaging in phenol red-free full-growth media in a 96-well plate (Greiner bio-one #655090) such that the density would remain subconfluent until the end of the imaging period. Images were acquired every 12 minutes on an ImageXpress Micro XLS widefield microscope (Molecular Devices) with a 10X 0.45NA objective; CFP exposure = 75 ms; YFP exposure = 200 ms. Cells were imaged in a humidified, 37°C chamber at 5% CO 2 .
Image processing and cell tracking
Images were processed as described in Cappell et al., 2016 ([ 35 ]), with a general description reproduced here: Mean nuclear intensities were measured by averaging the background-subtracted pixel intensities in each nucleus as defined by a nuclear mask. The nuclear mask was established by performing segmentation on H2B-mTurquoise- or Hoechst-stained images as follows. Log-transformed images were convolved with a rotationally symmetric Laplacian of Gaussian filter and objects were defined as contiguous pixels exceeding a threshold filter score. In order to segment cells in contact with their nearest neighbor, a custom segmentation algorithm was implemented to detect and bridge concave inflections in the perimeter of each object (hereafter referred to as the “deflection bridging algorithm”). The deflection bridging algorithm was implemented on every identified object in the first imaging frame and then only adaptively in subsequent frames. This was accomplished by iteratively tracking cells in each frame, detecting probable merge events (as discussed below) and selectively implementing the deflection bridging algorithm on putative merged objects. Local background subtraction was performed on images of sensors or antibodies that were nuclear in subcellular distribution. For local background subtraction, the nuclear mask was expanded by 25 μm and the background for each cell was calculated as the median pixel intensity of local nonmasked pixels. For cytoplasmically localized sensors or antibodies, the nuclear mask was dilated by 50 μm, and the global background was calculated as the mode intensity of all nonmasked pixels. As before, CDK2 activity was calculated as the ratio of cytoplasmic to nuclear mean DHB fluorescence, with the cytoplasmic component calculated as the mean of the top 50th percentile of a ring of pixels outside of the nuclear mask. Tracking of cells between frames was implemented by screening the nearest future neighbor for consistency in total H2B-mTurquoise fluorescence (“conservation of mass”). Because the stage jittered slightly after fixation and IF in the time-lapse + IF dataset, we implemented the following jitter correction procedure to ensure precise matching of the CDK2 activity trace of each cell to its IF intensity: We first subtracted the image at a specific time from the image in the next frame to get a “difference score” between 2 images. We then repeated the process, with 1 image moving in a 2-dimensional manner, to get multiple “difference scores” when the stage jittered. The position with the lowest score indicated the amount of jittering and the images were aligned accordingly. “Conservation of mass” was further exploited to detect merges or splits, which allowed recovery of overlapping traces. Mitosis events (called at anaphase) were called when the total H2B fluorescence of the 2 nearest future neighbors of a given cell were both between 45% and 55% of the total H2B fluorescence of the past cell. The R-point was defined as the time CDK2 activity first began to rise. Computationally, this involves calculating slopes of CDK2 activity using windows of 6–10 time points and then maximizing a linear function for time-since-mitosis, CDK2 activity, and CDK2 slope (long times-since-mitosis, low CDK2 activity, and high CDK2 slope). The tracking code is available for download here: https://github.com/scappell/Cell_tracking . Definition of populations Traces were computationally classified, and manually verified, as CDK2 inc (blue), CDK2 low (red), or CDK2 emerge (green) based on CDK2 activity at 2 hours after mitosis: CDK2 inc traces must remain ≥ 0.5 for all frames post-anaphase; CDK2 low traces must remain < 0.5 for all frames post-anaphase; CDK2 emerge traces initially enter the CDK2 low state and then emerge—these traces must remain < 0.5 for at least 3 hours post-anaphase before rising.
Supporting information S1 Fig Methods for measuring cell-cycle progression, or lack thereof. (A) The CDK2 sensor consists of an mVenus-tagged peptide containing 4 CDK2 phosphorylation sites (S) close to an NLS and an NES. Phosphorylation of the sensor by CDK2 masks the basic residues of the NLS and unmasks the NES, and causes translocation of the sensor to the cytoplasm in a manner correlated with CDK2 activity. The cytoplasmic:nuclear ratio of this sensor thus serves as a readout for CDK2 activity. See Spencer et al., 2013 [ 11 ] for details. (B) Defining cells in different cell-cycle phases using multiple markers. Cutoffs were defined conservatively to select a relatively pure population of the cells of interest; see Fig 1B–1D for the gates (cutoffs) used. (C) Dye and filter cubes used to visualize the IF signals. Abbreviations: CDK2, Cyclin-Dependent Kinase 2; IF, immunofluorescence; NES, nuclear export sequence; NLS, nuclear localization sequence; POI, protein of interest. (PDF) Click here for additional data file. S2 Fig Quiescent, CDK2 low MCF10A are not senescent and can reengage with the cell cycle. (A) MCF10A were stained for β-galactosidase activity after being exposed to sustained vehicle control (DMSO, 5 days, left), Nutlin-3 (8 μM, 5 days, middle), or Etoposide (12.5 μM, 24-hour treatment followed by drug washout and 4 days of recovery in growth media, right). DMSO-treated cells do not stain positive for β-galactosidase activity compared with cells treated with either Nutlin-3 or Etoposide. Scale bar, 50 μm. (B) The β-galactosidase activity stain was quantified by first examining each channel (red, green, and blue) of the RGB images; cells that stained turquoise for β-galactosidase activity had low values in the red channel. We therefore manually outlined each cell in the images shown using a custom MATLAB GUI and stored the red pixel values for each cell. The red pixel values for each cell were then plotted as histograms. Ten cells’ histograms are shown for each condition; the total number of cells analyzed is indicated in (C). Given the bimodality of the β-galactosidase activity stain in some cells treated with Nutlin-3, we used the saddle point (50 AU, red dashed line) as a threshold for blueness (equivalent to a lack of redness) and counted the number of cells with at least 5% of their red pixels as below this value. (C) Table depicting the number of senescent cells in each image based on the quantification in (B). No DMSO-treated cells had 5% of their pixels below the 50 AU threshold, whereas the Nutlin-3– and Etoposide-treated cells had 41% and 81% below this threshold, respectively. (D) Cells can re-enter the cell cycle after a prolonged period in the CDK2 low state. The plot shows CDK2 activity traces from individual unperturbed MCF10A cells that started the movie in the CDK2 low state, emerged from the CDK2 low state at some point in the movie, and did not have a mitosis during the imaging period. The percentage of the total population with this behavior is indicated; error represents the standard deviation across 96 replicate wells. Abbreviation: CDK2, Cyclin-Dependent Kinase 2. (PDF) Click here for additional data file. S3 Fig Protein levels for asynchronous Hs68 cells in G0, G1, S, G2, and M phases of the cell cycle. (A–H) Column 1: Density scatter of the indicated protein versus DNA content; data are pooled from 9 IF images from 1 representative well. Column 2: Contour plot of the indicated protein versus DNA content; contours are color coded by cell-cycle phase according to the legend. Data are pooled from 9 IF images from 1 representative well. Column 3: Histogram (probability density) of the indicated protein for G0 cells (purple, defined as 2N DNA content, EdU-negative, and hypo-phosphorylated Rb) versus G1 cells (blue, defined as 2N DNA content, EdU-negative, and hyper-phosphorylated Rb). Two biological replicates are shown. Abbreviations: IF, immunofluorescence, Rb, retinoblastoma protein. (PDF) Click here for additional data file. S4 Fig Levels of proteins that are relatively invariant in asynchronous MCF10A and Hs68 cells. Column 1: Density scatter of the indicated protein versus DNA content. Column 2: Histogram (probability density) of the indicated protein for G0 versus G1 cells (as defined in Fig 1C ). Two biological replicates are shown. (PDF) Click here for additional data file. S5 Fig Dynamics of proteins that are relatively invariant in proliferating and spontaneously quiescent MCF10A cells. Column 1: Time-lapse imaging of CDK2 activity in asynchronous cells was followed by fixation and IF staining for the indicated protein. Protein signals were then reconstructed as a function of time since anaphase for CDK2 inc cells (blue dots) and CDK2 low cells (red dots), as in Fig 1H . Nuclear intensity for Cyclin B1 is included as a comparison to the cytoplasmic intensity for Cyclin B1 shown in Fig 3 . We include data from 2 widely used antibodies for p53, one which shows no difference between CDK2 inc and CDK2 low cells and the other which shows p53 to be slightly higher in CDK2 low cells. Column 2: Moving average through the blue or red points from Column 1. Error bars represent standard deviation. All data are from MCF10A cells. Number of cells plotted: p27: 714; total Rb: 1,462; p53(Ab-1): 1,357; p53(DO-1): 1,897; Fra1: 1,804; Cyclin B1: 318. The data for each antibody come from 8 replicate wells, pooled together. Abbreviations: CDK2, Cyclin-Dependent Kinase 2; IF, immunofluorescence; Rb, retinoblastoma protein. (PDF) Click here for additional data file. S6 Fig Validation of antibodies used in this study. (A) MCF10A cells were transfected with siRNAs against the indicated genes for 20 hours (for CCNA2, CCNB1, CCNE1/2, CDKN1A, CDT1, GMNN, and MYC) or 48 hours (for RB1) and analyzed by western blot. Note only the bottom band on the anti-Cyclin E blot is specific for Cyclin E. (B) Distribution of IF signal intensity after siRNA treatments described in (A). (C) MCF10A cells were contact inhibited for the indicated time and then analyzed by western blot. Abbreviation: IF, immunofluorescence; siRNA, small interfering RNA. (PDF) Click here for additional data file. S7 Fig Representative IF images for the antibodies used in this study. Abbreviation: IF, immunofluorescence. (PDF) Click here for additional data file. S8 Fig Characterization of the mCitrine-Cyclin D1 knock-in MCF10A cell line. (A) Left: The expected DNA band sizes for the wild-type CCND1 gene and the mCitrine-Cyclin D1 fusion. Right: PCR amplification of the CCND1 gene in parental and mCitrine-CCND1 knock-in cells run in duplicate on 0.8% agarose gel. The mCitrine gene was knocked into both CCND1 alleles resulting in the absence of the wild-type band in the mCitrine-CCND1 knock-in cells. Bands were excised and sequenced as additional verification. (B) The mCitrine-Cyclin D1 knock-in MCF10A cell line responds in the same way as untagged Cyclin D1 in parental MCF10A cells. WT: parental MCF10A cells. CCND1 knock-in: MCF10A cells with mCitrine knocked into the CCND1 locus to produce a mCitrine-Cyclin D1 fusion protein. MLN: 1.4 μM MLN4924 treatment for 2 hours. Btz: 1 μM Bortezomib treatment for 2 hours. Meki: 100 nM PD0325901 treatment for 32 hours. Meki WO: 100 nM PD0325901 treatment for 32 hours followed by drug washout and return to full growth medium for 6 hours. (C) mCitrine intensity linearly correlates with Cyclin D1 antibody staining in the mCitrine-Cyclin D1 knock-in cell line. Left: representative images of mCitrine signal and Cyclin D1 antibody staining in the same cells. Right: Quantification of the images; axes are natural log scale. Abbreviation: WT, wild type. (PDF) Click here for additional data file. S9 Fig Data synthesis for proteins that are relatively invariant over the cell cycle. Moving average traces from S5 Fig Column 2 were normalized such that the minimum signal experienced between CDK2 inc and CDK2 low data for a given protein was set to 0, and the maximum signal experienced between CDK2 inc and CDK2 low data for this protein was set to 1. Abbreviation: CDK2, Cyclin-Dependent Kinase 2. (PDF) Click here for additional data file. S1 Movie CDK2 activity in unperturbed MCF10A cells. MCF10A cells expressing mVenus-tagged CDK2 sensor were imaged in full growth media every 12 minutes for 24 hours. The arrows mark representative cells that enter the CDK2 inc (blue), CDK2 low (red), or CDK2 emerge (green) state after mitosis, or a prolonged quiescent cell (purple) that was quiescent throughout the movie. The CDK2 activity of the 4 cells over time is plotted in the right panel. Abbreviation: CDK2, Cyclin-Dependent Kinase 2. (AVI) Click here for additional data file.
📊 Figures
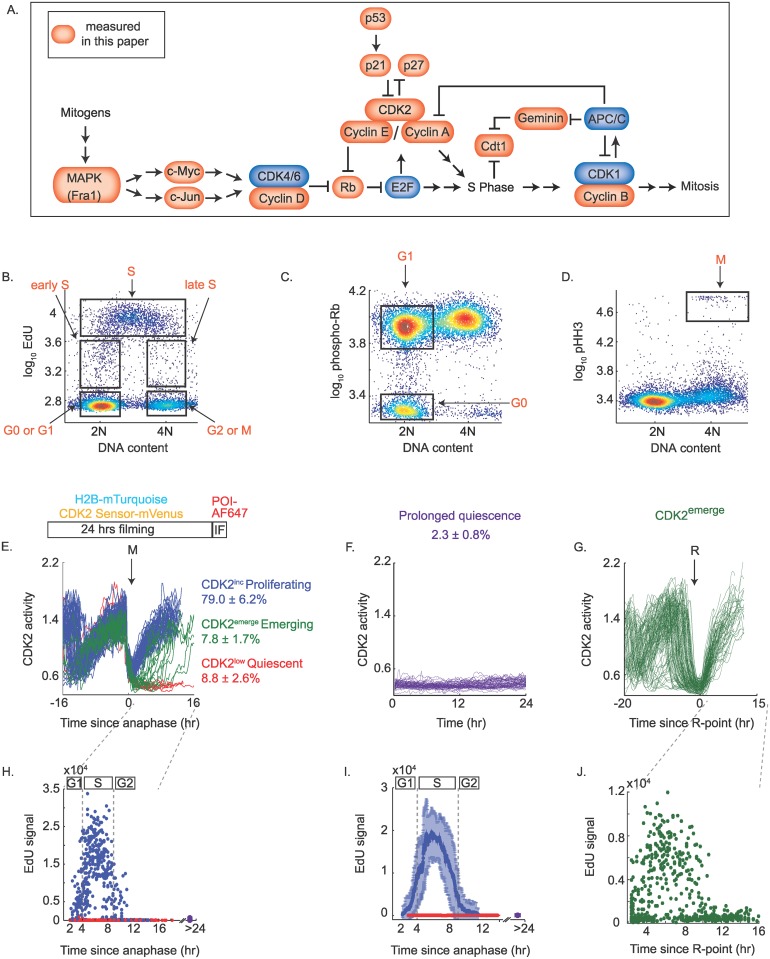
Fig 1
Single-cell IF methods for identifying cells in G0, G1, S, G2, and M phases of the cell cycle.
(A) Cell-cycle signaling network depicting in red the proteins measured in this study. (B) Density scatter plot of EdU versus DNA content used to define G0/G1, early S, S, late S, and G2/M populations...

Fig 2
Protein levels for asynchronous MCF10A cells in G0, G1, S, G2, and M phases of the cell cycle.
(Au2013H) Column 1: Density scatter of the indicated protein versus DNA content; data are pooled from 9 IF images from 1 representative well. Column 2: Contour plot of the indicated protein versus DNA...
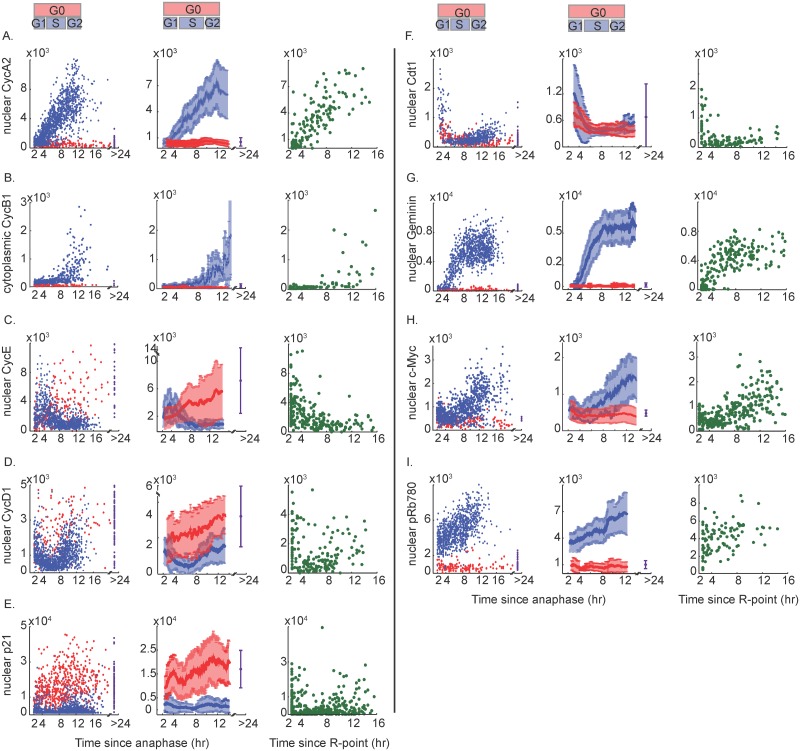
Fig 3
Protein dynamics for proliferating and spontaneously quiescent MCF10A cells.
(Au2013I) Column 1: Time-lapse imaging of CDK2 activity in asynchronous cells was followed by fixation and IF staining for the indicated protein. Protein signals were then reconstructed as a function ...
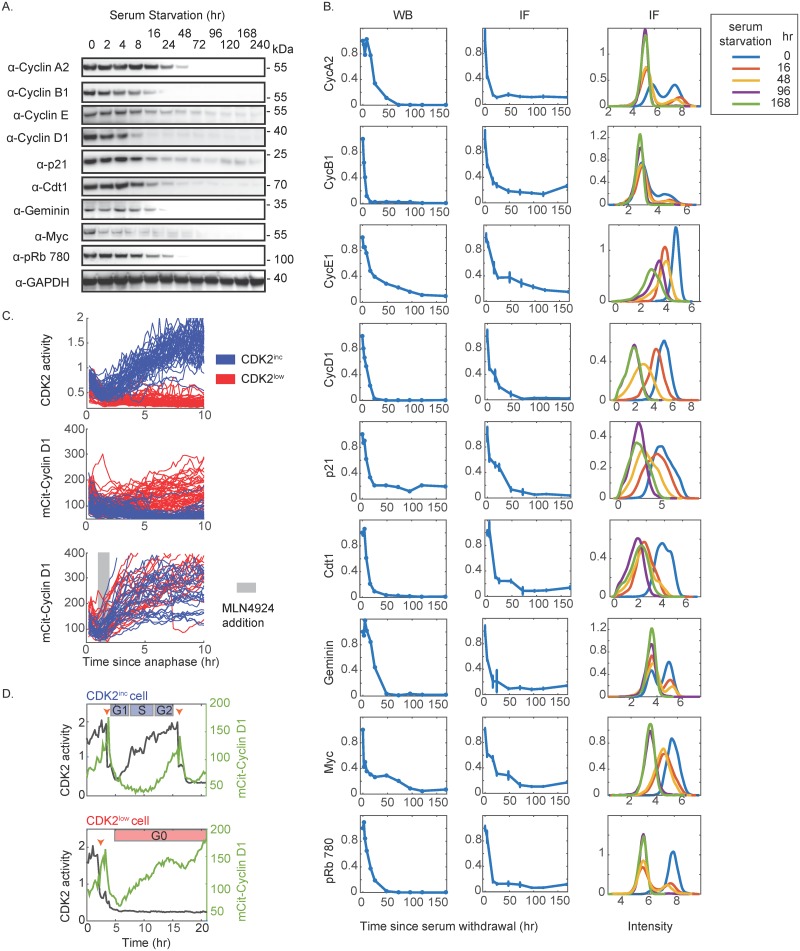
Fig 4
Validation of antibody staining in serum-starved cells and validation of Cyclin D1 results by time-lapse imaging of mCitrine-Cyclin D1.
(Au2013B) Cells were serum starved for the indicated time and analyzed by western blotting (A) or IF (B). (B) Column 1: Quantification of western blots in (A). Column 2: Average IF signal of the indic...
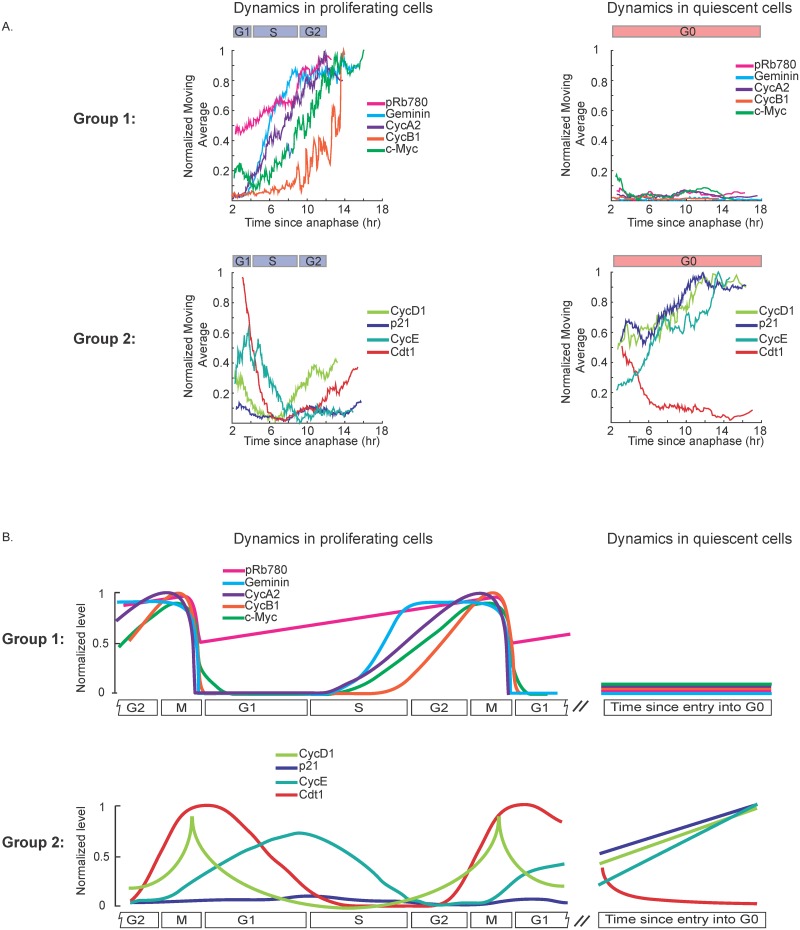
Fig 5
Data synthesis to generate maps of protein dynamics during cell-cycle progression and cell-cycle exit.
(A) Moving average traces from Fig 3 Column 2 were normalized such that the minimum signal experienced across CDK2 inc and CDK2 low data for a given protein was set to 0, and the maximum signal experi...
Figure images are served from the NIH/NLM PubMed Central Open Access Subset or Europe PMC; copyright remains with the publishers and authors.
💬 Discussion
0 commentsNo comments yet. Be the first to start a discussion!
Leave a Comment