Abstract
Hunger and pain are two competing signals that individuals must resolve to ensure survival. However, the neural processes that prioritize conflicting survival needs are poorly understood. We discovered that hunger attenuates behavioral responses and affective properties of inflammatory pain without altering acute nociceptive responses. This effect is centrally controlled, as activity in hunger-sensitive agouti-related protein (AgRP)-expressing neurons abrogates inflammatory pain. Systematic analysis of AgRP projection subpopulations revealed that the neural processing of hunger and inflammatory pain converge in the hindbrain parabrachial nucleus (PBN). Strikingly, activity in AgRP → PBN neurons blocked the behavioral response to inflammatory pain as effectively as hunger or analgesics. The anti-nociceptive effect of hunger is mediated by neuropeptide Y (NPY) signaling in the PBN. By investigating the intersection between hunger and pain, we have identified a neural circuit that mediates competing survival needs and uncovered NPY Y1 receptor signaling in the PBN as a target for pain suppression.
🔬 Techniques
🔭 Microscopes
💻 Software
✨ Fluorophores
🧪 Sample Preparation
🏭 Microscope Brands
🧪 Reagent Suppliers
💻 Software Details
💾 Data Repositories
🏛️ Research Organizations (ROR)
Affiliated research institutions:
📋 Methods
CONTACT FOR REAGENT AND RESOURCE SHARING
Further information and requests for resources and reagents should be directed to and will be fulfilled by the Lead Contact, J. Nicholas Betley. ( jnbetley@sas.upenn.edu ).
EXPERIMENTAL MODEL AND SUBJECT DETAILS
Mice were group housed on a 12 h light/12 h dark cycle with ad libitum access to food (Purina Rodent Chow, 5001) and water unless otherwise noted. Group housed adult male and female mice (at least 8 weeks old) were used for experimentation. Agrp-IRES-Cre (Jackson Labs 012899, Agrp tm1(cre)Lowl /J ) ( Tong et al., 2008 ), Ai32 (Jackson Labs 012569, B6;129S-Gt(ROSA)26Sor tm32(CAG-COP4*H134R/EYFP)Hze /J ) ( Madisen et al., 2012 ), R26-LSL-Gi-DREADD (Jackson Labs 026219, B6N.129-Gt(ROSA)26Sor tm1(CAG-CHRM4*,-mCitrine)/Ute /J) ( Zhu et al., 2016 ), VGlut2-IRES-FlpO and Gad2-IRES-FlpO generated as described in Method Details, and C57BL/6J mice were used for experimentation. Genotyping was performed using primers and conditions provided by Jackson Labs or custom primers for Gad2-IRES-FlpO and VGlut2-IRES-FlpO mice as described in Method Details. All mice were habituated to handling and experimental conditions prior to experiments. For within-subject behavioral analyses, all mice received all experimental conditions. For between-subject analyses, mice were randomly assigned to experimental condition. We performed experiments in both male and female subjects, and did not observed any trends or significant sex differences. Thus, to ensure our studies were appropriately powered and to minimize the number of subjects who had to undergo pain assays, we combined males and females for analyses in all experiments. All procedures were approved by the University of Pennsylvania Institutional Animal Care and Use Committee. METHOD DETAILS Recombinant Adeno-Associated Virus (rAAV) Constructs and Production The following Cre- or FlpO-dependent rAAV vectors were used: AAV1.CAGGS.Flex.ChR2-tdTomato.WPRE.SV40 (titer: 1.38e13 GC/ml), AAVrh10.CAGGS.flex.ChR2.tdTomato.WPRE.SV40 (titer: 1.23e13 GC/ml), AAV1rh.CAG.Flex.eGFP.WPRE.bGH (titer: 1.708e13 GC/ml), AAV1.Syn.Flex.GCaMP6s.WPRE.SV40 (titer: 4.216e13 GC/ml), AAV-fDIO-Cre-GFP (titer: 2.91e13 GC/ml), pAAV-hSyn-DIO-hM4D(Gi)-mCherry (titer: 4.3e12 GC/ml). All viruses were produced by the University of Pennsylvania Vector Core, except for the latter which was purchased from Addgene (ID 44362). CAG, promoter containing a cytomegalovirus enhancer; the promoter, first exon and first intron of the chicken beta actin gene; and the splice acceptor of rabbit beta-globin gene. Syn, human Synapsin 1 promoter. FLEX, Cre-dependent flip-excision switch. WPRE, woodchuck hepatitis virus response element. bGH, bovine growth hormone polyadenylation signal. ChR2, channelrhodopsin-2. GCaMP, Genetically encoded calcium indicator resulting from a fusion of GFP, M13 and Calmodulin. DIO, Double-floxed inverted oreientation. hM4, human M4 muscarinic receptor.
Show full methods section
CONTACT FOR REAGENT AND RESOURCE SHARING
Further information and requests for resources and reagents should be directed to and will be fulfilled by the Lead Contact, J. Nicholas Betley. ( jnbetley@sas.upenn.edu ).
EXPERIMENTAL MODEL AND SUBJECT DETAILS
Mice were group housed on a 12 h light/12 h dark cycle with ad libitum access to food (Purina Rodent Chow, 5001) and water unless otherwise noted. Group housed adult male and female mice (at least 8 weeks old) were used for experimentation. Agrp-IRES-Cre (Jackson Labs 012899, Agrp tm1(cre)Lowl /J ) ( Tong et al., 2008 ), Ai32 (Jackson Labs 012569, B6;129S-Gt(ROSA)26Sor tm32(CAG-COP4*H134R/EYFP)Hze /J ) ( Madisen et al., 2012 ), R26-LSL-Gi-DREADD (Jackson Labs 026219, B6N.129-Gt(ROSA)26Sor tm1(CAG-CHRM4*,-mCitrine)/Ute /J) ( Zhu et al., 2016 ), VGlut2-IRES-FlpO and Gad2-IRES-FlpO generated as described in Method Details, and C57BL/6J mice were used for experimentation. Genotyping was performed using primers and conditions provided by Jackson Labs or custom primers for Gad2-IRES-FlpO and VGlut2-IRES-FlpO mice as described in Method Details. All mice were habituated to handling and experimental conditions prior to experiments. For within-subject behavioral analyses, all mice received all experimental conditions. For between-subject analyses, mice were randomly assigned to experimental condition. We performed experiments in both male and female subjects, and did not observed any trends or significant sex differences. Thus, to ensure our studies were appropriately powered and to minimize the number of subjects who had to undergo pain assays, we combined males and females for analyses in all experiments. All procedures were approved by the University of Pennsylvania Institutional Animal Care and Use Committee. METHOD DETAILS Recombinant Adeno-Associated Virus (rAAV) Constructs and Production The following Cre- or FlpO-dependent rAAV vectors were used: AAV1.CAGGS.Flex.ChR2-tdTomato.WPRE.SV40 (titer: 1.38e13 GC/ml), AAVrh10.CAGGS.flex.ChR2.tdTomato.WPRE.SV40 (titer: 1.23e13 GC/ml), AAV1rh.CAG.Flex.eGFP.WPRE.bGH (titer: 1.708e13 GC/ml), AAV1.Syn.Flex.GCaMP6s.WPRE.SV40 (titer: 4.216e13 GC/ml), AAV-fDIO-Cre-GFP (titer: 2.91e13 GC/ml), pAAV-hSyn-DIO-hM4D(Gi)-mCherry (titer: 4.3e12 GC/ml). All viruses were produced by the University of Pennsylvania Vector Core, except for the latter which was purchased from Addgene (ID 44362). CAG, promoter containing a cytomegalovirus enhancer; the promoter, first exon and first intron of the chicken beta actin gene; and the splice acceptor of rabbit beta-globin gene. Syn, human Synapsin 1 promoter. FLEX, Cre-dependent flip-excision switch. WPRE, woodchuck hepatitis virus response element. bGH, bovine growth hormone polyadenylation signal. ChR2, channelrhodopsin-2. GCaMP, Genetically encoded calcium indicator resulting from a fusion of GFP, M13 and Calmodulin. DIO, Double-floxed inverted oreientation. hM4, human M4 muscarinic receptor.
Generation of FlpO mice
VGlut2-IRES-FlpO mouse generation
Targeting vector construction: The targeting vector was constructed using a recombineering technique previously described ( Liu et al., 2003 ). A 8,572 bp genomic DNA fragment containing exon 9–12 of the VGlut2 gene was retrieved from BAC clone RP23-228J18 to a vector containing the DT gene, a negative selection marker. A cassette of IRES-FlpO-loxP2272-ACE-Cre POII NeoR-loxp2272 was inserted between stop codon TAA and 3’ UTR. The length of the 5’ homologous arm is 5,519 bp and that for the 3’ arm is 3,049 bp. ES cell targeting and screening: The targeting vector was electroporated into F1 hybrid of 129S6 × C57BL/6J ES cells derived by the Janelia Transgenic Facility. The G418 resistant ES clones were screened by nested PCR using primers outside the construct paired with primers inside the inserted cassette. The primer sequences were as follows: 5’ arm forward primers: VGlut2 Scr F1 (5’-CAGCTCCTTTGAGAATGGCA-3’) and VGlut2 Scr F2 (5’-CCTGACAGTTTCAAAACGTGG-3’). Reverse primers: IRES R1 (5’-AGGAACTGCTTCCTTCACGA-3’) and IRES R2 (5’-CCTAGGAATGCTCGTCAAGA-3’). 3’ arm forward primers: ACE F3 (5’-ACAGCACCATTGTCCACTTG-3’) and ACE F4, (5’-GCTGGTAAGGGATATTTGCC-3’); Reverse primers: VGlut2 Scr R3 (5’-ACATTGGTGCCACTTAGCTG-3’) and VGlut2 Scr R4 (5’-GCATGTGAGCTACCTTAAGC-3’). Generation of chimera and F1 genotyping: The PCR positive ES clones were expanded for generation of chimeric mice. The ES cells were aggregated with 8-cell embryos of CD-1 strain. The chimeras were mated with wildtype C57BL/6J females and the neo cassette was automatically removed in F1 pups. The F1 pups were genotyped by PCR using primers flanking the insertion site and a primer in IRES for the 5’ arm. The primer set VGlut2 gt F P1 (5’- TGCTACCTCACAGGAGAATG-3’) and IRES P3 (5’-GCTTCGGCCAGTAACGTTAG-3’). The PCR products are 186 bp for the mutant allele. The primer set for the 3’ arm is VGlut2 P2 (5’- TGACAACTGCCACAGATTG-3’) and FlpO gt F P4 (5’-CTGGACTACCTGAGCAGCTA-3’). The generated PCR products are 294 bp for the mutant allele. The primer set VGlut2 P1 (5’-TGCTACCTCACAGGAGAATG-3’) and Vglut2 P2 (5’-TGACAACTGCCACAGATTG-3’) is designed to detect the wildtype allele for homozygote genotyping. The correct targeting was further confirmed by obtaining homozygotes from chimera × F1 heterozygous females mating. The mouse lines from two independent ES cell clones were homozygosity tested and bred for experiments. Genotyping PCR: The template DNA was obtained by digesting an ear piece in 50 μl proteinase K buffer (50 mM Tris pH 8.8, 1 mM EDTA pH 8.0, 0.5% Tween-20 and proteinase K 0.6 mg/ml). The reaction was incubated at 55°C overnight and heat inactivated at 100°C for 10 minutes. 0.5 µl of the template was used in 12 µl PCR reaction. The reaction was carried out with an initial denature cycle of 94°C for 3 min, followed by 35 cycles of 94°C 30 s, 55°C 30 s and 72°C 30 s and ended with one cycle of 72°C for 5 min.
Gad2-IRES-FlpO mouse generation
Targeting vector construction: The targeting vector was constructed using a recombineering technique previously described ( Liu et al., 2003 ). A 10,389 bp genomic DNA fragment containing exon 16 of the Gad2 gene was retrieved from BAC clone RP23-27D24 to a vector containing the DT gene, a negative selection marker. A cassette of IRES-FlpO-loxP2272-ACE-Cre POII NeoR-loxp2272 was inserted between stop codon TAA and 3’ UTR. The length of the 5’ homologous arm is 3,195 bp and that for the 3’ arm is 7,193 bp. ES cell targeting and screening: The targeting vector was electroporated into F1 hybrid of 129S6 × C57BL/6J ES cells derived by the Janelia Transgenic Facility. The G418 resistant ES clones were screened by nested PCR using primers outside the construct paired with primers inside the inserted cassette. The primer sequences were as follows: 5’ arm forward primers: Gad2 Scr F1 (5’-CAATTGCTGAGCTGAAGTGC-3’) and Gad2 Scr F2 (5’-CAAGCAGTCAGCAGATTCCA-3’). Reverse primers: IRES R1 (5’-AGGAACTGCTTCCTTCACGA-3’) and IRES R2 (5’-CCTAGGAATGCTCGTCAAGA-3’). 3’ arm forward primers: ACE F3 (5’-ACAGCACCATTGTCCACTTG-3’) and ACE F4 (5’-GCTGGTAAGGGATATTTGCC-3’); Reverse primers: Gad2 Scr R3 (5’-GGCTTGATTCCTCAGAGGAA-3’) and Gad2 Scr R4 (5’-GCACAACAGTTGGACCTTAG-3’). Generation of chimera and F1 genotyping: The PCR positive ES clones were expanded for generation of chimeric mice. The ES cells were aggregated with 8-cell embryos of CD-1 strain. The chimeras were mated with wildtype C57BL/6J females and the neo cassette was automatically removed in F1 pups. The F1 pups were genotyped by PCR using primers flanking the insertion site and a primer in IRES for the 5’ arm. The primer set Gad2 gt F P1 (5’-TATGGGACCACAATGGTCAG-3’) and IRES P3 (5’-GCTTCGGCCAGTAACGTTAG-3’). The PCR products are 212 bp for the mutant allele. The primer set for the 3’ arm is Gad2 P1 (5’-TATGGGACCACAATGGTCAG-3’), Gad2 P2 (5’- TGCTGGGATTAAAGGCATGC-3’) and FlpO gt F P4 (5’-CATCAACAGGCGGATCTGAT-3’). The generated PCR products are 261 bp for the mutant allele and 325 bp for wildtype allele. The correct targeting was further confirmed by obtaining homozygotes from chimera × F1 heterozygous females mating. The mouse lines from three independent ES cell clones were homozygosity tested and were bred for experiments. Genotyping PCR: Genotyping PCR was performed as for VGlut2-IRES-FlpO mice. Viral Injections, Fiber Optic and Cannula Placement Bilateral viral injections and unilateral implantation of ferrule-capped optical fibers (200 µm core, NA 0.37 for optogenetic stimulation; 400 µm core, NA 0.48 for fiber photometry, Doric) were performed as previously described ( Betley et al., 2013 ). For somatic stimulation of AgRP neurons, Agrp-IRES-Cre mice were crossed with Ai32 mice to express ChR2 in AgRP neurons. Mice were anesthetized with isoflurane (1.5–3%), given ketoprofen (5 mg/kg) and bupivacaine (2 mg/kg) analgesia and placed into a stereotaxic device (Stoelting). An optical fiber was placed over the arcuate hypothalamic nucleus (ARC) at bregma −1.35 mm, midline ±0.25 mm, skull surface −5.8 mm. For axonal stimulation of AgRP neurons, a rAAV encoding Cre-dependent ChR2 was bilaterally injected into the ARC of AgRP-IRES-Cre mice using the aforementioned ARC injection coordinates (150 nl per site, bilaterally). Optical fibers were unilaterally implanted according to the following coordinates. BNST: bregma +0.85 mm, midline ±0.82 mm, skull surface −3.8 mm; PVH: bregma −0.5 mm, midline ±0.2 mm, skull surface −5.4 mm; PVT: bregma −1.0 mm, midline ±0.0 mm, skull surface −2.7 mm; LH: bregma −1.0 mm, midline ±0.9 mm, skull surface −5.4 mm; CeA: bregma −1.15 mm, midline ±2.4 mm, skull surface −4.25 mm; ARC: bregma −1.35 mm, midline ±0.25 mm, skull surface −5.8 mm; PAG: bregma −4.4 mm, midline ±0.6 mm, skull surface −2.8 mm; lateral PBN: bregma −5.8 mm, midline ±1.2 mm, skull surface −3.7 mm. Fibers were secured to the skull with bone screws and dental cement. For pharmacological experiments, mice were implanted with unilateral 26 gauge guide cannulae (Plastics One, Roanoke, VA) above the lateral PBN (according to the above coordinates) which were secured to the skull with bone screws and dental cement ( Alhadeff et al., 2015 ). For chemogenetic inhibition of lateral PBN neurons, VGlut2-IRES-FlpO and Gad2-IRES-FlpO mice were bilaterally injected (200 nl/hemisphere) in the lateral PBN with a FlpO-dependent rAAV encoding Cre, and a Cre-dependent rAAV encoding inhibitory Designer Receptors Exclusively Activated by Designer Drugs (DREADDs, hM4D). For fiber photometry, a rAAV encoding Cre-dependent GCaMP6s was bilaterally injected into the ARC of AgRP-IRES-Cre mice using the following coordinates: bregma −1.35 mm; midline ±0.25 mm; skull surface −6.15 mm and −6.3 mm (250 nl per site, bilaterally), and an optical fiber was implanted over the ARC using the following coordinates: bregma −1.35 mm; midline ±0.25 mm; skull surface −6.0 mm. Mice were given at least 3 weeks for recovery and transgene expression. Fiber and cannula placements were verified postmortem.
General Experimental Design
For each experiment, our subject numbers were determined by our pilot studies, laboratory publications, and power analyses [power=0.8, significance level=0.05, effect sizes=10–30%]. For within-subject behavioral and fiber photometry analyses, all mice received all experimental conditions. For between-subject analyses, mice were randomly assigned to experimental condition. For all behavioral and fiber photometry experiments, experiments were performed in at least two cohorts to ensure replicability of results, by at least 2 researchers who were blinded to experimental conditions. For histological experiments, protein intensities and neuron counts were quantified by 4 research assistants who were blinded to experimental condition. For all behavioral and fiber photometry experiments, virus expression, fiber placements, and/or cannula placements were verified postmortem, and any mice with viral expression or implants outside of the area of interest were excluded from all analyses. In Vivo Photostimulation Photostimulation was performed as previously described ( Betley et al., 2013 ), with 10 ms pulses at 20 Hz for 1 s, repeated every 4 s. The output beam from a diode laser (450 nm, Opto Engine) was controlled by a microcontroller (Arduino Uno) running a pulse generation script. The laser was coupled to a multimode optical fiber (200 µm core, NA 0.37, Doric) with a 1.25 mm OD zirconium ferrule (Kientech) and mating sleeve that allowed delivery of light to the brain by coupling to the implanted ferrule-capped optical fiber in the mouse. Power was set to ensure delivery of at least 2 mW/mm 2 to AgRP soma and at least 5 mW/mm 2 to the center of the AgRP neuron projection fields. Food Deprivation/Restriction For 24 h food deprivation, mice were placed in a cage with alpha dry bedding and ad libitum access to water, but no food, 24 h prior to experimentation. For chronic food restriction, mice were weighed at the same time each day and given chow once daily (1.5–3.0 g) after experimentation to maintain 85–90% of their starting body weight. Food Intake Experiments Effects of AgRP neuron stimulation on food intake Mice were allowed to habituate for at least one hour to a chamber with a lined floor and ad libitum access to chow and water. Following the habituation period, food intake was measured for 1 h to establish a pre-stimulation baseline. Photostimulation was performed during the next hour. After each hour, food intake was measured. For somatic AgRP neuron stimulation, only mice that consumed >0.6 g of chow were included in experiments. Food intake evoked by stimulation of each AgRP neuron projection subpopulation was measured and reported in Figure S3D . Effects of AgRP neuron inhibition on food intake Mice were habituated to an empty home cage with a lined floor. Mice were food deprived for 24 h, intraperitoneally (i.p.) injected with saline or clozapine-N-oxide (CNO, 2.5 mg/kg, Tocris), and placed into their cage with ad libitum access to chow and water. Chow intake was measured 4 h post-injection, accounting for crumbs. Effects of hotplate exposure on latency to feed 24 h food deprived mice were individually placed in a home cage with a lined floor and access to water. After a 10 min habituation period, mice were exposed to a cast iron plate at either 25°C or 52°C for 1 min and immediately placed back into the cage with food and water. Latency to consume food was measured. Effects of formalin injection on food intake 24 h food deprived mice were individually placed in a home cage with a lined floor and access to water. After a 10 min habituation period, mice were injected subcutaneously in the dorsal hindpaw with saline or 2% formalin (20 µl, Sigma HT50-1-2) and returned to their cage with food. Food intake was recorded 1 h post-injection. Inflammatory Pain Measurements (Formalin Test) Mice were placed in a clear enclosure for a 10 min habituation period. Mice were subcutaneously injected in the dorsal hindpaw with saline or 2% formalin (20 µl). Mice were monitored for time spent licking paw, and number of lick bouts, for 1 h post-injection by researchers blinded to experimental condition. All sessions were video-recorded. The time spent paw licking was grouped into 5 min bins ( Hunskaar and Hole, 1987 ) and recorded for 1 h. Additionally, acute (0–5 min) and inflammatory (15–45 min) phase pain responses were quantified.
Effects of ketoprofen on formalin test
The non-steroidal anti-inflammatory drug ketoprofen (30 mg/kg) or saline was administered subcutaneously 30 min before formalin injection.
Effects of food deprivation on formalin test
Food was removed 24 h prior to formalin injection. Ad libitum fed mice served as controls. Effects of formalin on paw inflammation 24 h food deprived mice were lightly anesthetized and paw circumference was measured immediately before saline or formalin paw injection. Paw circumference was measured again 30 min post-injection.
Optogenetic AgRP neuron stimulation
To assess the effects of AgRP neuron stimulation on acute and inflammatory phase pain responses to formalin, mice received optogenetic stimulation of AgRP neurons or individual projection subpopulations beginning 10 min prior to formalin injection and lasting throughout the formalin test. To assess the ability of AgRP neuron stimulation to affect an ongoing inflammatory pain response, stimulation of AgRP neurons or AgRP→PBN neurons was initiated 25 min post-formalin injection and lasted for the duration of the formalin test. To assess whether the offset of AgRP→PBN neuron activity results in a reinstatement of inflammatory phase pain response, laser stimulation was given 10 min prior to formalin injection and terminated 25 min post-formalin injection. To test whether prolonged AgRP→PBN neuron stimulation affects the ability to paw lick, mice were stimulated for 40 min and formalin-induced acute phase pain was measured. Chemogenetic AgRP neuron inhibition To assess the necessity of AgRP neuron activity for the inhibition of inflammatory pain by hunger, mice were 24 h food deprived and i.p. injected with CNO (2.5 mg/kg) 15 min before formalin injection. Chemogenetic inhibition of lateral PBN VGlut2 and Gad2 neurons To determine whether lateral PBN glutamatergic (VGlut2-expressing) or GABAergic (Gad2-expressing) neurons mediate inflammatory pain responses, VGlut2 hM4D , Gad2 hM4D , and control mice were i.p. injected with CNO (2.5 mg/kg) 15 min before formalin injection. Thermal Pain Measurements (Hotplate Test) A cast iron plate with plexiglass walls was placed on a hotplate and heated to 52°C. Mice were placed on the hotplate and latency to withdraw paw was recorded by researchers blinded to experimental condition. All sessions were video-recorded.
Effects of morphine on hotplate test
Mice underwent a baseline hotplate test and were subsequently i.p. injected with saline or morphine (10 mg/kg). Mice were tested again on the hotplate 30 min post-injection.
Effects of food deprivation on hotplate test
Food was removed 24 h prior to hotplate test. Ad libitum fed mice served as controls.
Optogenetic AgRP neuron stimulation during hotplate test
To assess the effects of AgRP neuron stimulation on acute thermal pain response, mice were placed in a plexiglass chamber, attached to patch fibers, and allowed to habituate for 30 min. Mice underwent a baseline hotplate test, and 5 min later laser stimulation was initiated. Mice were tested again on the hotplate following 15 and 45 min of stimulation of AgRP neurons or control light delivery to GFP-expressing mice. A separate experiment was performed to assess the role of AgRP→PBN neurons on acute thermal pain by delivering light to the PBN of mice expressing either ChR2 or GFP in AgRP neurons, using identical experimental procedures. Mechanical Pain Measurements (Von Frey Test) Mice were habituated for 30 min in small plexiglass chambers atop mesh flooring. Twelve Von Frey filaments (ranging from 0.008 g to 6 g) were used. Starting with the smallest Von Frey filament and continuing in ascending order, each filament was applied to the plantar surface of the hind paw until the filament bent. Each filament was tested 5 times. The number of withdrawal responses was recorded for each filament, and the percentage withdrawal responses for each filament was calculated (# of withdrawal trials/total trials). Withdrawal threshold was determined as the filament at which the mouse responded with a paw withdrawal to >50% of trials. To test the effects of hunger on mechanical pain, mice were 24 h food deprived and then subjected to the Von Frey test. Inflammation-Induced Sensitization Complete Freund’s Adjuvant (CFA, Sigma) was diluted 1:1 in saline and injected (20 µl) into the plantar surface of the paw after a baseline Von Frey or hotplate test. Given that we and others observe a more robust CFA-induced sensitization to thermal pain at 55°C ( Carey et al., 2017 ), we used this temperature for CFA-induced thermal sensitization. Von Frey or hotplate tests were repeated 3 h, 24 h, and 48 h post-CFA injection. Effects of hunger on inflammation-induced sensitization Mice were 24 h food deprived and subjected to Von Frey or hotplate tests as described above. Mice were provided enough food in one daily aliquot to maintain 85–90% BW through the rest of testing (up to 48 h post-CFA injection). Effects of AgRP neuron stimulation on inflammation-induced sensitization Optogenetic AgRP neuron stimulation was performed for 1 h before each of the post-CFA Von Frey tests (3 h, 24 h, and 48 h post-CFA injection). Conditioned Place Avoidance Two-sided apparatus were used with distinct visual (black vs. white walls), textural (flooring: plastic vs. soft textural side of Kimtech bench-top protector), and olfactory (almond vs. peppermint extract) cues. A neutral middle zone to shuttle between sides was maintained and the chamber was equipped with an overhead camera to track mouse position. Ad libitum fed mice were habituated to the apparatus and a pre-conditioning preference was determined via AnyMaze software. Mice were then separated into two groups: food restricted (85–90% of initial body weight) or ad libitum fed. Conditioning, which consisted of a saline paw injection (20 µl) on the less preferred side or a 2% formalin paw injection (20 µl) on the preferred side was performed twice daily for four days. To isolate conditioning to the inflammatory phase of formalin pain, mice were placed in the apparatus 15 min post-injection. After conditioning, all mice were given ad libitum access to food. The next day, mice were given access to both sides of the apparatus and their position and activity were tracked. The percentage occupancy, shifts in occupancy, and total distance traveled in the formalin-paired side during the post-conditioning test were calculated. To control for any associative learning deficits during hunger, the same conditioned place avoidance paradigm was used, except that mice were given i.p. saline on the less preferred side and i.p. lithium chloride (125 mg/kg) on the preferred side during conditioning.
Locomotor Activity Assays
Effects of food deprivation of formalin-induced immobility Mice were habituated to 10” × 10” × 10” plexiglass chambers. Food was removed from mice 24 h prior to 2% formalin injection, and mice were placed in chambers and video-recorded during the inflammatory phase following formalin injection (15–45 min post-injection). Videos were analyzed with AnyMaze software (Stoelting) for time spent immobile, which was defined as not changing position in the X–Y grid for at least 8 s. Effects of AgRP→PBN neuron stimulation on locomotor activity Mice were habituated to 10” × 10” × 10” plexiglass chambers. AgRP→PBN neurons were optogenetically stimulated for 30 min and behavior was video-recorded. Videos were analyzed with AnyMaze software (Stoelting) for total distance traveled and time spent immobile, which was defined as not changing position in the X–Y grid for at least 8 s.
Immunohistochemistry and Imaging
Mice were transcardially perfused with 0.1 M phosphate buffered saline (PBS) followed by 4% paraformaldehyde (PFA). Brains were removed and post-fixed for 4 h in PFA and then washed overnight in PBS. Coronal brain sections were cut (30–200 µm sections) on a vibratome or cryostat and stored in PBS. Brain sections were incubated overnight at 4°C with primary antibodies diluted in PBS, 1% BSA and 0.1% Triton X-100. Antibodies used: goat anti-AgRP (1:2,500, Neuromics, GT15023), rabbit anti-cFos (1:5,000, Cell Signaling, 2250), guinea pig anti-RFP (1:10,000) ( Betley et al., 2013 ), rabbit anti-GFP (1:5,000, Invitrogen, A-11122), rabbit anti-NPY (1:1,500, Immunostar, 22940), rat anti-GAD65 (1:2,000) ( Betley et al., 2009 ), guinea pig anti-VGlut2 (1:2,000, SYSY, 135404). Sections were washed 3 times and incubated with species appropriate and minimally cross-reactive fluorophore-conjugated secondary antibodies (1:500, Jackson ImmunoResearch) for 2 h at room temperature. Sections were washed twice with PBS and mounted and coverslipped with Fluorogel. Epifluorescence images were taken on a Leica stereoscope to verify fiber placements, cannula placements, and obtain low magnification images. Confocal micrographs were taken on a Leica STED laser scanning microscope using a 20×, 0.75 NA objective for quantification of Fos immunoreactivity under AgRP axons; a 40×, 1.3 NA objective for quantification of protein expression in AgRP→PBN terminals; and a 63× or 100×, 1.4 NA objective for protein colocalization of mCherry, VGlut2, and GAD65 in PBN axon terminals.
Quantification of Protein Expression Immediate early gene protein expression analysis
To quantify the number of neurons expressing Fos protein under AgRP axons, mice received no treatment (n=3) or a 20 µl subcutaneous injection of formalin (5%, n=3) or saline (n=3) in the dorsal hindpaw. Two hours later, mice were perfused and brains were processed for immunohistochemistry. First, images of Fos and AgRP from a formalin-treated mouse were obtained in each of the major AgRP projection target regions. Identical image acquisition settings were maintained for all subsequent imaging of Fos and AgRP in experimental and control mice. To quantify the number of Fos-expressing neurons in each AgRP neuron target region, single optical sections (pinhole = 1 airy unit, 2–4 sections/mouse/AgRP target region) were used and the AgRP neuron staining was used to define the region for quantification (see Figure 4A ).
Quantification of synaptic protein expression
Ad libitum fed (n=2) and 24 h food deprived (n=3) mice were perfused and PBN brain sections were processed for NPY, the GABA synthetic enzyme GAD65, and AgRP immunoreactivity. Confocal images were obtained first from a food deprived mouse so that the intensities of NPY, GAD65, and AgRP were in the linear range. Image acquisition settings were maintained for all subsequent imaging and 2 PBN images per mouse were obtained. For intensity quantifications, single confocal sections (pinhole = 1 airy unit) were used and the intensities of NPY, GAD65, and AgRP were calculated using the histogram function on Adobe Photoshop. Colocalization of hM4D, Vglut2, and GAD65 in lPBN neurons To determine the specificity of expression of hM4D in the Gad2-IRES-FlpO and Vglut2-IRES-FlpO knock-in lines, staining was performed against mCherry, Vglut2 and GAD65 in coronal sections from at least 2 mice/line used for experimentation. For quantification, single confocal sections (pinhole = 1 airy unit) were used and the number of Vglut2+ or GAD65+ structures that expressed hM4D-mCherry were counted. Pharmacology For all experiments, mice were habituated to handling and infusion procedures. Drugs were diluted from frozen aliquots before each experiment and microinjected (100 nl) with a Hamilton syringe attached to an internal cannula (Plastics One) and microliter syringe pump (PHD Ultra, Harvard Apparatus) into the PBN of mice immediately before a formalin test (see above) or food intake measurements. Effects of lPBN NPY, GABA agonists, and AgRP analogue on formalin-induced inflammatory pain Neuropeptide Y [NPY, Tocris, 0.1 µg], GABA A and GABA B receptor agonists [muscimol, Tocris, 25 ng and baclofen, Tocris, 25 ng], an AgRP analogue [melanocortin 4 receptor antagonist; SHU9119, 25 pmol] or vehicle [artificial cerebrospinal fluid (aCSF)] was microinjected into the lateral PBN immediately before paw injection of formalin. Effects of lPBN NPY, GABA agonists, and AgRP analogue on food intake The aforementioned drugs were infused in the lPBN during the light cycle and food intake was recorded 1 h post-injection. Effects of locus coeruleus NPY on formalin-induced inflammatory pain Since AgRP axons terminate both in the lPBN and the locus coeruleus, NPY or vehicle was infused in the locus coeruleus area (directly medial from lPBN) immediately before formalin paw injection. Effects of lPBN NPY Y1 receptor antagonist on the inhibition of inflammatory pain by hunger Microinjections of the selective NPY Y1 receptor antagonist BIBO 3304 [Tocris, 3 µg], GABA A and GABA B antagonists [saclofen, 100 ng, Sigma, and bicuculline, 10 ng, Sigma] or vehicle (50% DMSO in aCSF) were infused into the lPBN of 24 h food deprived mice. Effects of lPBN NPY Y1 receptor antagonist on the inhibition of inflammatory pain by AgRP→PBN stimulation To test whether the protective effects of AgRP→PBN neuron stimulation on inflammatory pain are mediated by NPY, we performed an experiment similar to that in ( Atasoy et al., 2012 ). Mice expressing ChR2 in AgRP neurons were injected in the lPBN with vehicle or the Y1 receptor antagonist BIBO 3304. An optic fiber was then inserted through the PBN cannula and a formalin paw injection was administered. AgRP→PBN stimulation occurred throughout the duration of the formalin test. Fiber Photometry Food-restricted (85–90% body weight) mice in their home cage were attached to a patch fiber (400 µm core, NA 0.48, Doric) and connected to 405 nm and 490 nm LEDs (Thor Labs, M405F1, M470F3) modulated by a real-time amplifier [Tucker-Davis Technology (TDT), Alachua, FL, RZ5P] and focused onto a femtowatt photoreceiver (Newport, Model 2151) ( Figure 6C ) ( Gunaydin et al., 2014 ). Changes in calcium-dependent GcaMP6s fluorescence (490 nm) signal were compared with calcium-independent GCaMP6s fluorescence (405 nm), providing internal control for movement and bleaching artifacts ( Lerner et al., 2015 ; Su et al., 2017 ). Fluorescence measurements (1 Hz) were extracted from Synapse software (TDT), processed in MatLab (GraphPad), and expressed as ΔF/F, where the denominator represents average baseline fluorescence. Effects of acute thermal pain on AgRP neuron activity Food restricted (85–90% BW) mice were connected to the fiber photometry setup for a 5 min baseline period in their home cage. Mice were then placed on a 25°C or 52°C plate for 1 min, after which they returned to their cage. GCaMP6s fluorescence was monitored for 10 min following hotplate exposure. Effects of acute and inflammatory formalin-induced pain on AgRP neuron activity Food restricted (85–90% BW) mice were connected to the fiber photometry setup for a 5 min baseline period in their home cage. Mice were injected in the dorsal hindpaw with 2% formalin or saline (20 µl) and returned to their cage. GCaMP6s fluorescence was monitored for 1 h post-formalin injection.
QUANTIFICATION AND STATISTICAL ANALYSES
Data were expressed as means ± SEMs in figures and text. Paired or unpaired two-tailed t-tests with or without Bonferroni corrections and Pearson regressions were performed as appropriate. One-way, two-way, and repeated measures ANOVA were used to make comparisons across more than two groups using SigmaPlot or STATISTICA. Test, statistics, significance levels, and sample sizes for each experiment are listed in Supplementary Tables 1 and 2 . ns p>0.05, t-tests and post-hoc comparisons: *p
📊 Figures
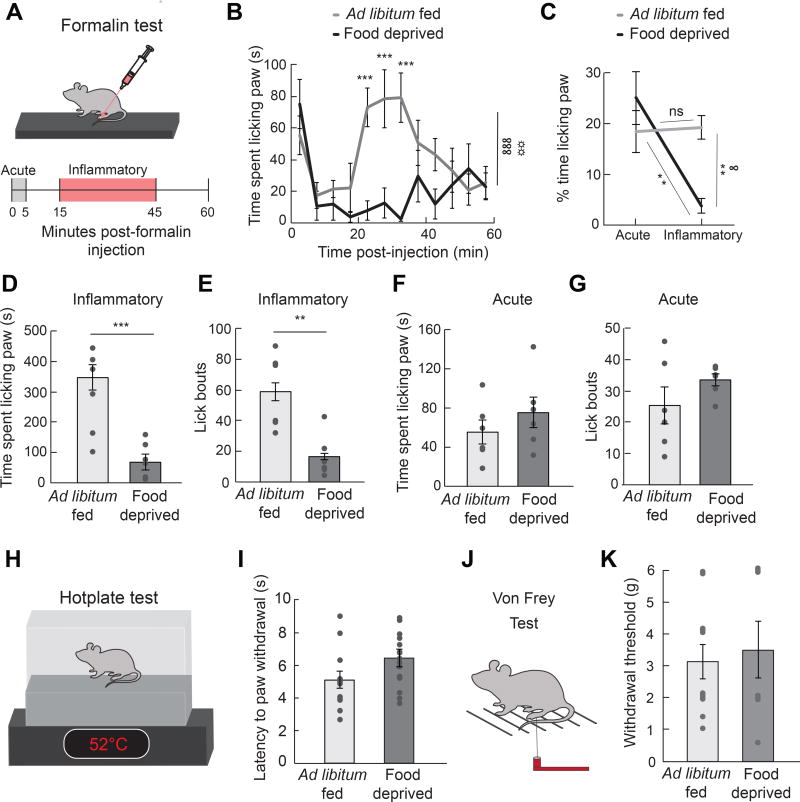
Figure 1
Hunger Attenuates Response to Inflammatory Pain
( A ) Experimental design (formalin test): paw injection of 2% formalin was administered at 0 min; time spent licking paw was measured for 60 min and quantified during the acute phase (0u20135 min) an...
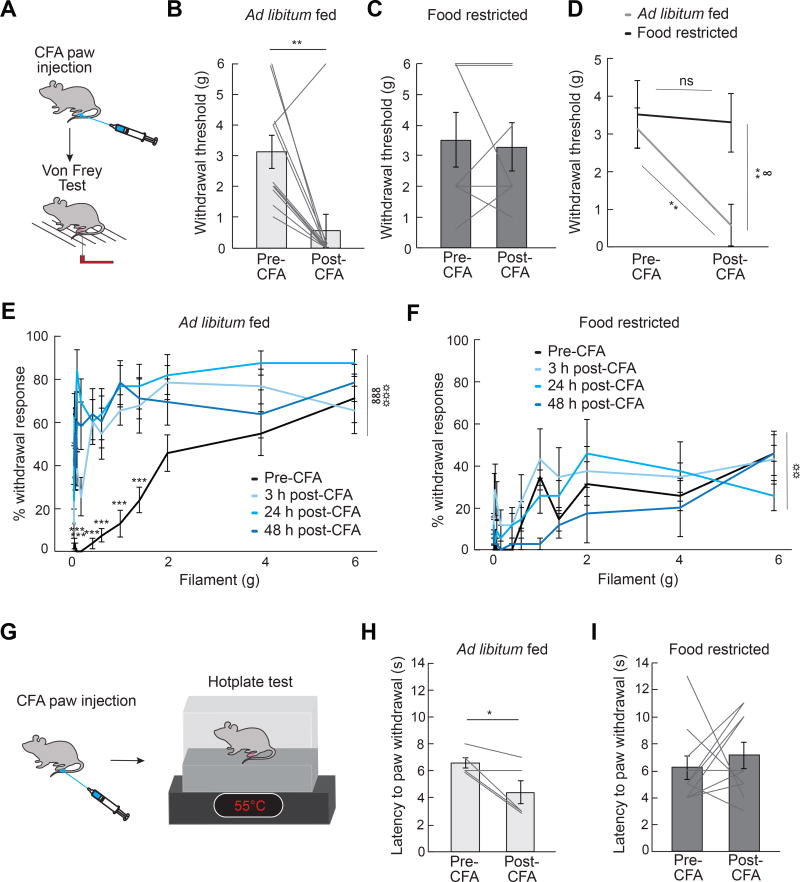
Figure 2
Hunger Attenuates Inflammation-Induced Sensitization to Mechanical and Thermal Pain
( A ) Experimental design [Complete Freundu2019s Adjuvant (CFA) and Von Frey Test]: CFA was injected in the plantar surface of the hindpaw after a baseline Von Frey test. Mice were subjected again to ...
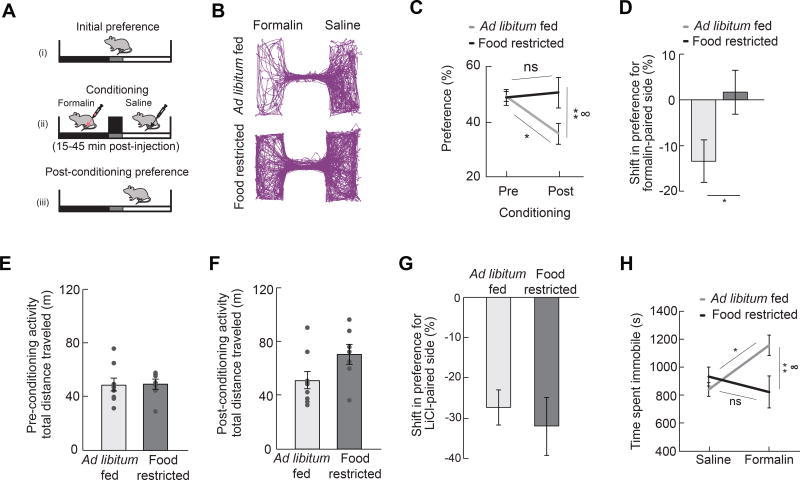
Figure 3
Hunger Attenuates Negative Affective Components of Pain
( A ) Experimental design [conditioned place avoidance (CPA)]: one side of a two-sided chamber was paired with the inflammatory phase following formalin paw injection in either ad libitum fed or food ...
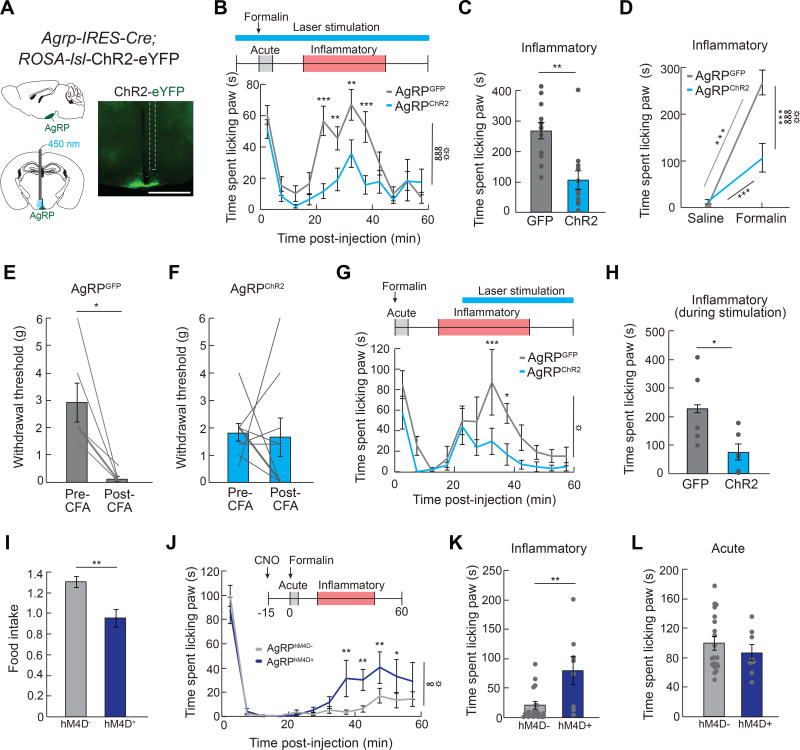
Figure 4
AgRP Neurons Mediate Suppression of Inflammatory Pain
( A ) Schematic and representative image of ChR2 in AgRP-IRES-Cre mice implanted with an optical fiber (white dashed line indicates fiber track) above the ARC. Scale bar, 1 mm. ( B ) Top, experimental...
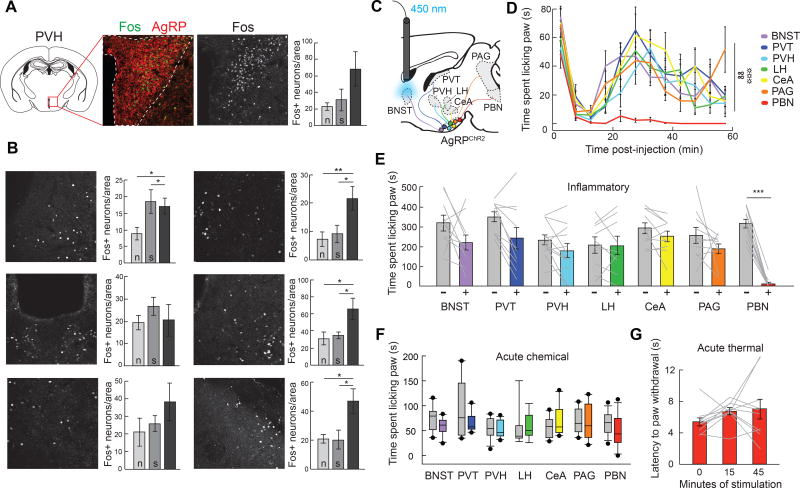
Figure 5
AgRPu2192PBN Neuron Activity Suppresses Inflammatory Pain
( A ) Immediate early gene protein expression analysis was performed to detect changes in neural activity in AgRP neuron target regions following formalin paw injection. Fos+ neurons in each target re...
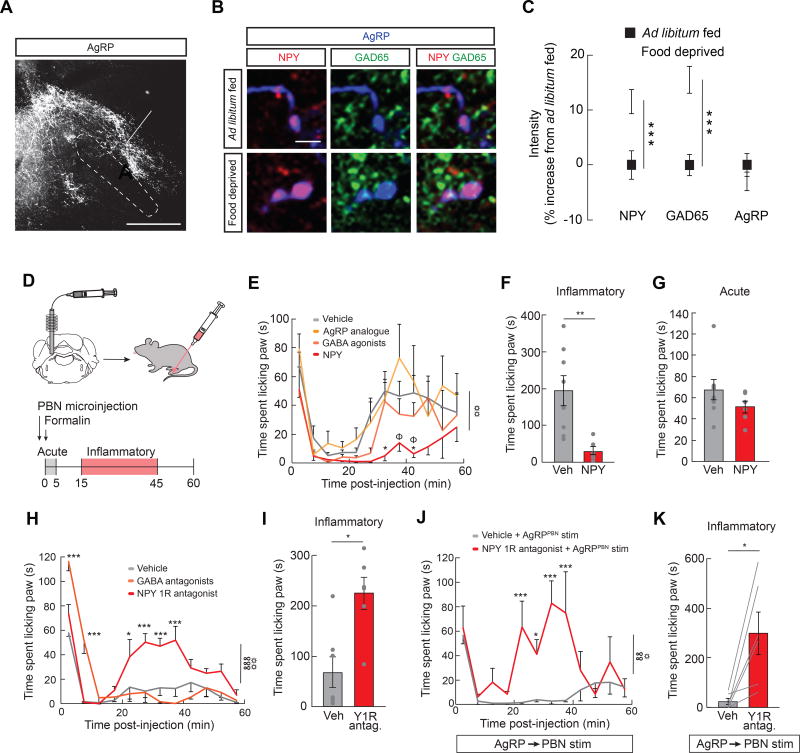
Figure 6
Lateral PBN NPY Signaling Suppresses Inflammatory Pain
( A ) Representative image of AgRP fibers terminating in the lateral PBN (lPBN) and locus coeruleus area. LC, locus coeruleus; lPBN, lateral PBN; scp, superior cerebellar peduncle. Scale bar, 500 u00b...
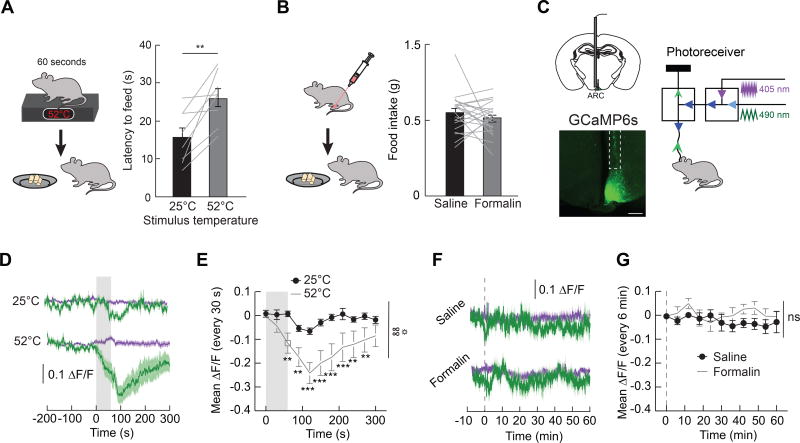
Figure 7
Acute Pain Inhibits Feeding Behavior and Activity in AgRP Neurons
( A ) Left, experimental design: latency to feed (first bite) was measured following 60 s exposure to a 52u00b0C hotplate. Right, graph: latency to feed after 60 s exposure to either a 25u00b0C or 52u...
Figure images are served from the NIH/NLM PubMed Central Open Access Subset or Europe PMC; copyright remains with the publishers and authors.
💬 Discussion
0 commentsNo comments yet. Be the first to start a discussion!
Leave a Comment